| Param | Original file | Final file |
|---|---|---|
| Filename | modeM0/AS1A04_021T04_9000001682_11472cztM0_level2.evt | modeM0/AS1A04_021T04_9000001682_11472cztM0_level2_quad_clean.evt |
| Size (bytes) | 612,624,960 | 69,468,480 |
| Size | 584.2 MB | 66.3 MB |
| Events in quadrant A | 5,051,951 | 387,897 |
| Events in quadrant B | 5,892,615 | 384,210 |
| Events in quadrant C | 3,196,067 | 432,652 |
| Events in quadrant D | 3,931,799 | 403,891 |
| Mode M0 | |||
|---|---|---|---|
| Quadrant | BADHDUFLAG | Total packets | Discarded packets |
| A | 0 | 19848 | 3 |
| B | 0 | 22257 | 2 |
| C | 0 | 14408 | 2 |
| D | 0 | 16538 | 2 |
| Mode SS | |||
|---|---|---|---|
| Quadrant | BADHDUFLAG | Total packets | Discarded packets |
| A | 0 | 144 | 0 |
| B | 0 | 144 | 0 |
| C | 0 | 144 | 0 |
| D | 0 | 144 | 0 |
| Mode M9 | |||
|---|---|---|---|
| Quadrant | BADHDUFLAG | Total packets | Discarded packets |
| A | 0 | 8 | 0 |
| B | 0 | 8 | 0 |
| C | 0 | 8 | 0 |
| D | 0 | 8 | 0 |
| Quadrant | Total seconds | Saturated seconds | Saturation percentage |
|---|---|---|---|
| A | 7100 | 647 | 9.112676% |
| B | 7100 | 772 | 10.873239% |
| C | 7100 | 32 | 0.450704% |
| D | 7101 | 79 | 1.112519% |
Noise dominated data is calculated using 1-second bins in cleaned event files. If a bin has >2000 counts, and if more than 50% of those come from <1% of pixels, then it is considered to be noise-dominated and hence unusable.
| Quadrant | # 1 sec bins | Bins with >0 counts | Bins with >2000 counts | High rate bins dominated by noise | Noise dominated (total time) | Noise dominated (detector-on time) | Marked lightcurve |
|---|---|---|---|---|---|---|---|
| A | 7931 | 7102 | 368 | 368 | 4.64% | 5.18% | 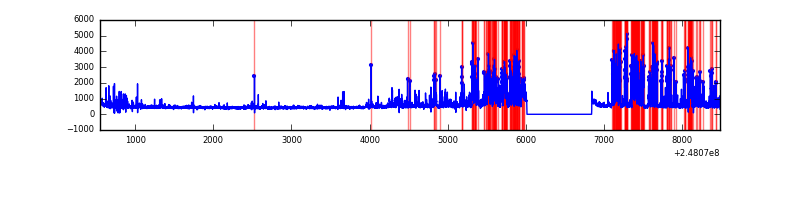 |
| B | 7931 | 7102 | 432 | 432 | 5.45% | 6.08% | 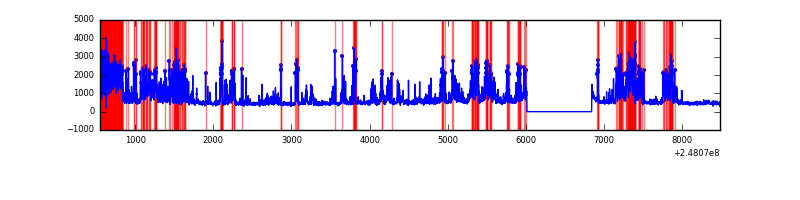 |
| C | 7931 | 7102 | 0 | 0 | 0.00% | 0.00% | 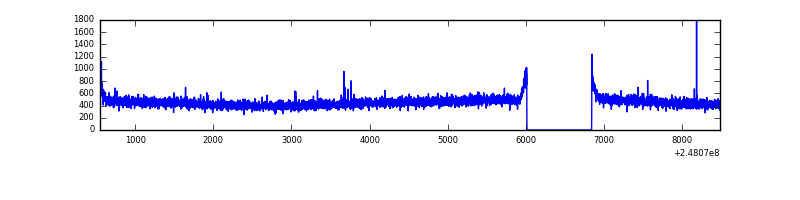 |
| D | 7932 | 7103 | 41 | 41 | 0.52% | 0.58% |  |
Top three noisy pixels from each quadrant. If the there are fewer than three noisy pixels in the level2.evt file, extra rows are filled as -1
| Pixel properties | Quadrant properties | ||||||
|---|---|---|---|---|---|---|---|
| Quadrant | DetID | PixID | Counts | Sigma | Mean | Median | Sigma |
| A | 8 | 5 | 1749697 | 10569.1 | 797 | 778 | 165.5 |
| A | 1 | 162 | 66919 | 399.7 | 797 | 778 | 165.5 |
| A | 1 | 178 | 38210 | 226.21 | 797 | 778 | 165.5 |
| B | 4 | 81 | 1379083 | 8948.4 | 801 | 779 | 154.0 |
| B | 4 | 239 | 1067171 | 6923.37 | 801 | 779 | 154.0 |
| B | 3 | 64 | 138667 | 895.21 | 801 | 779 | 154.0 |
| C | 13 | 61 | 5873 | 26.39 | 818 | 823 | 191.4 |
| C | 14 | 234 | 5829 | 26.16 | 818 | 823 | 191.4 |
| C | 1 | 3 | 2197 | 7.18 | 818 | 823 | 191.4 |
| D | 1 | 52 | 281027 | 1453.79 | 804 | 783 | 192.8 |
| D | 5 | 222 | 164964 | 851.71 | 804 | 783 | 192.8 |
| D | 2 | 120 | 112125 | 577.6 | 804 | 783 | 192.8 |
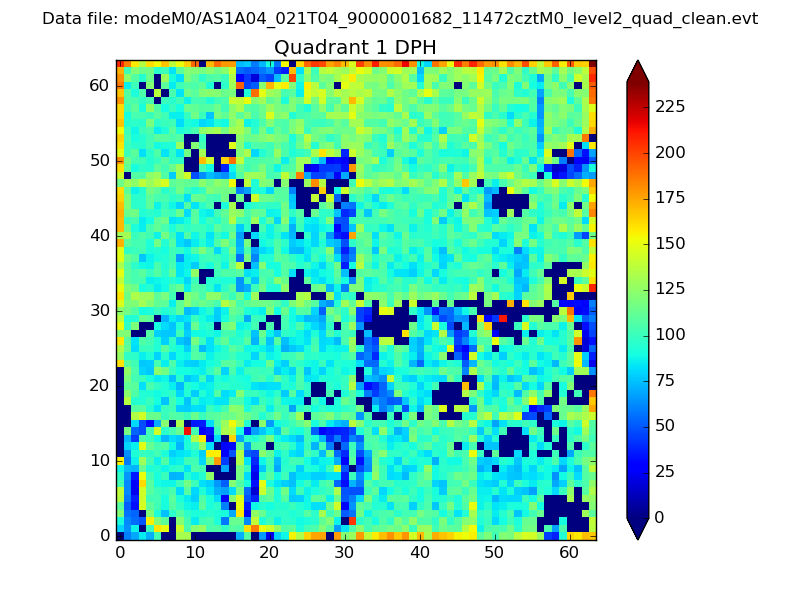
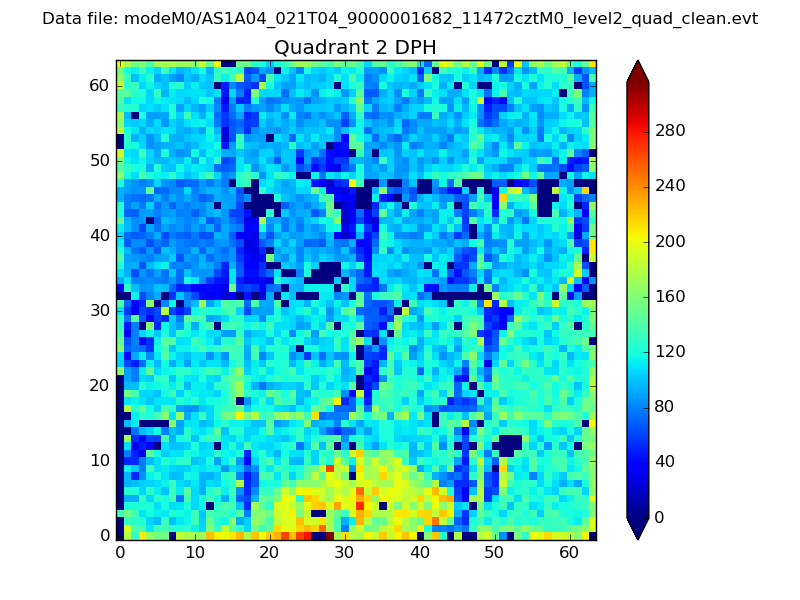
Histogram calculated using DETX and DETY for each event in the final _common_clean file
| Quadrant A |  |
 |
Quadrant B |
|---|---|---|---|
| Quadrant D |  |
 |
Quadrant C |
| Plot type | Count rate plots | Images |
|---|---|---|
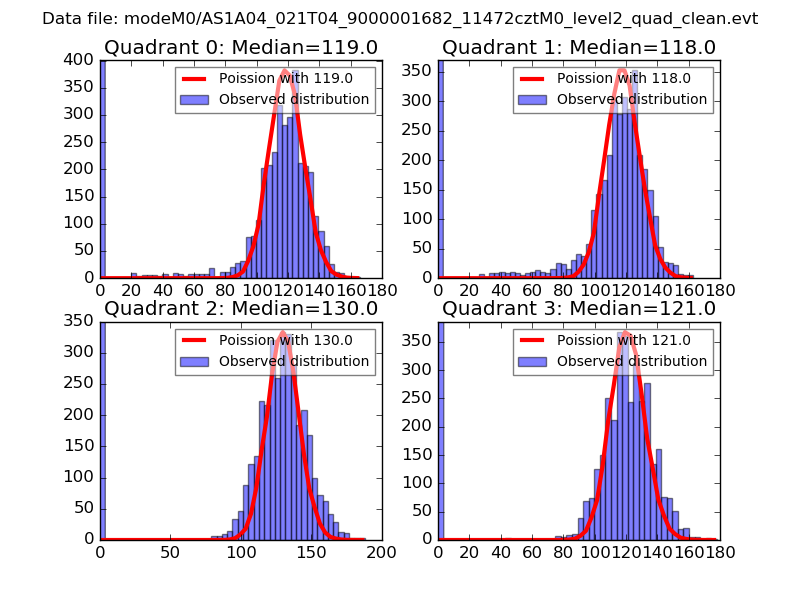
| Comparison with Poisson distribution Blue bars denote a histogram of data divided into 1 sec bins. Red curve is a Poisson curve with rate = median count rate of data. |
 |
 |
| Quadrant-wise count rates Data is divided into 100 sec bins |
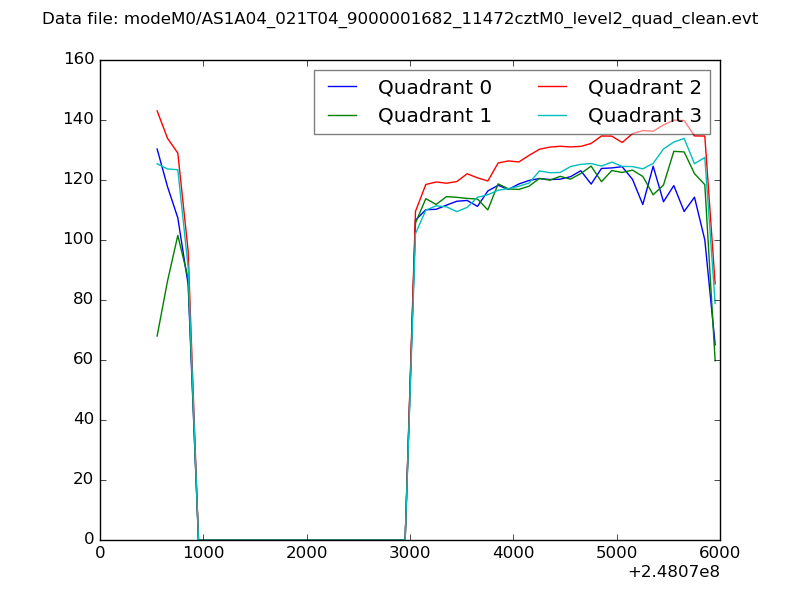 |
|
| Module-wise count rates for Quadrant A Data is divided into 100 sec bins |
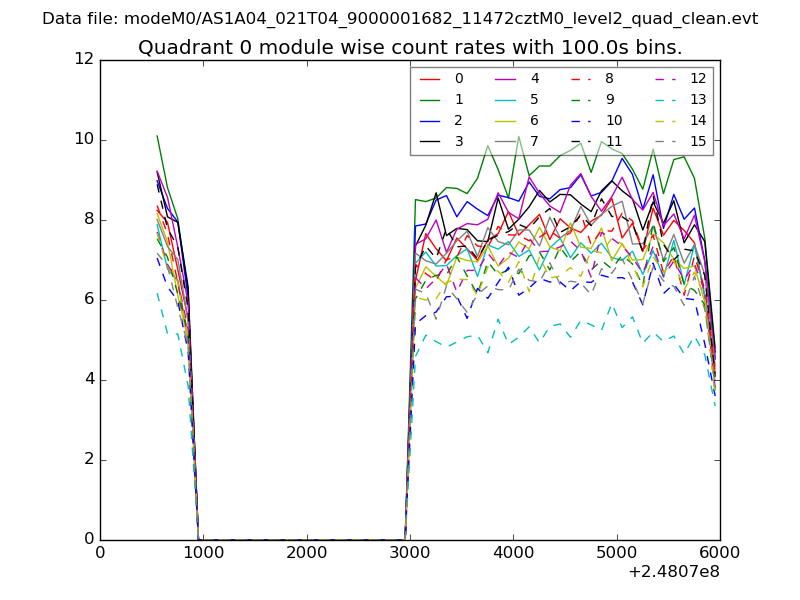 |
 |
| Module-wise count rates for Quadrant B Data is divided into 100 sec bins |
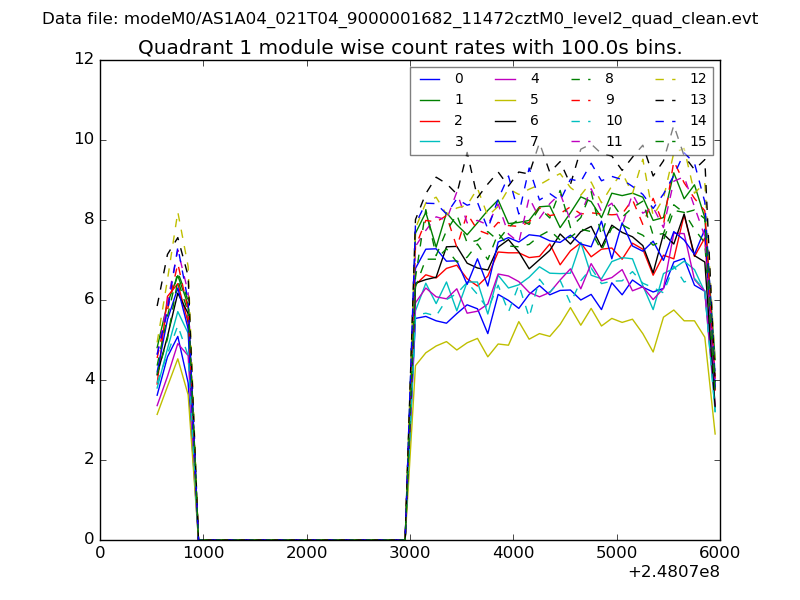 |
 |
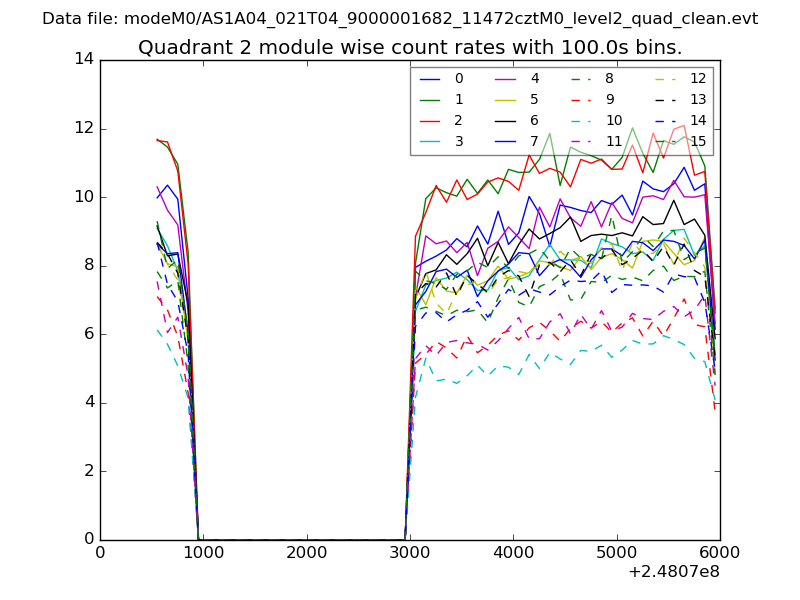
| Module-wise count rates for Quadrant C Data is divided into 100 sec bins |
 |
 |
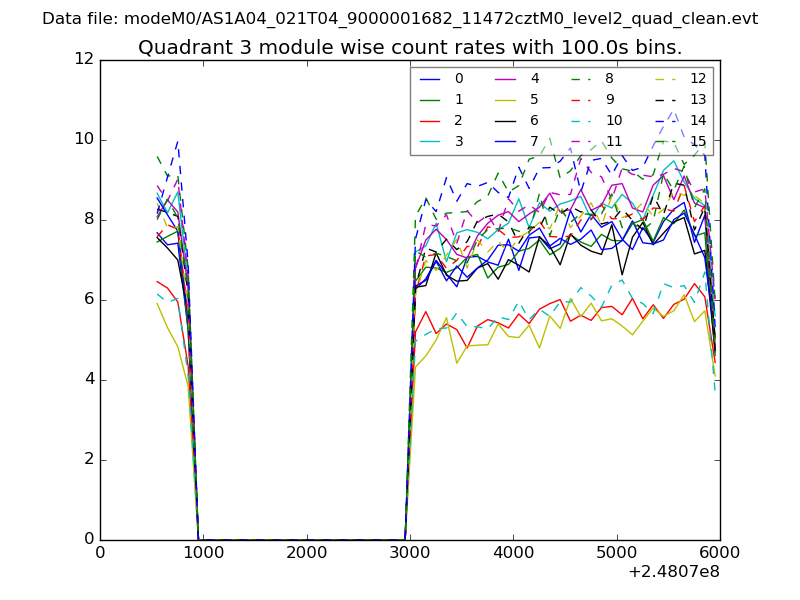
| Module-wise count rates for Quadrant D Data is divided into 100 sec bins |
 |
 |
| Parameter | Plot |
|---|---|
| CZT HV Monitor | 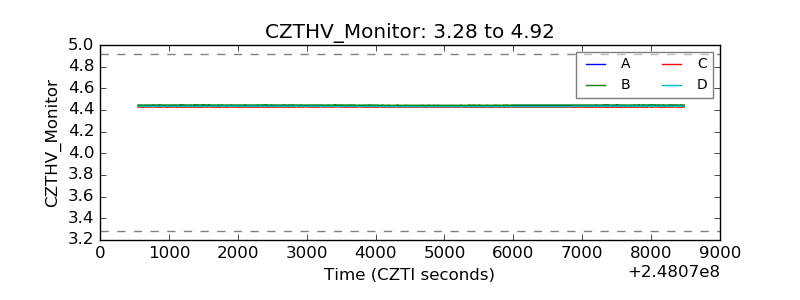 |
| D_VDD | 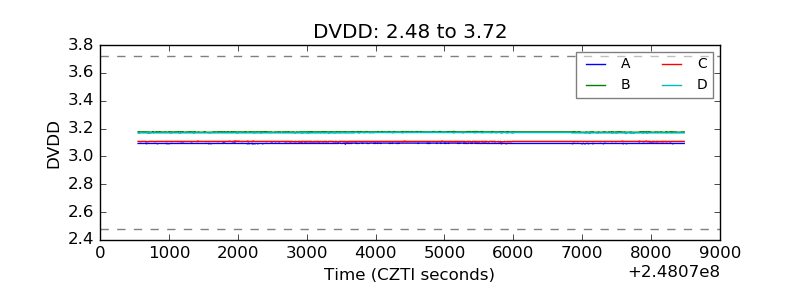 |
| Temperature 1 | 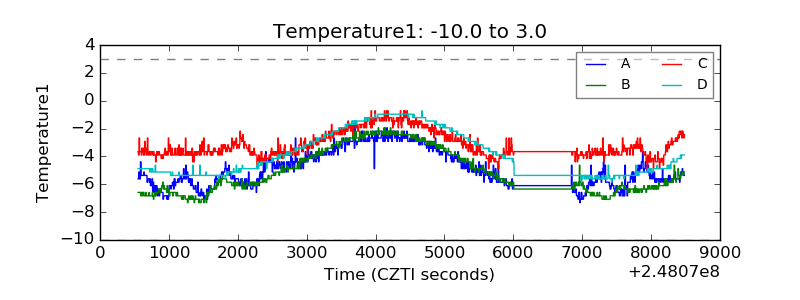 |
| Veto HV Monitor | 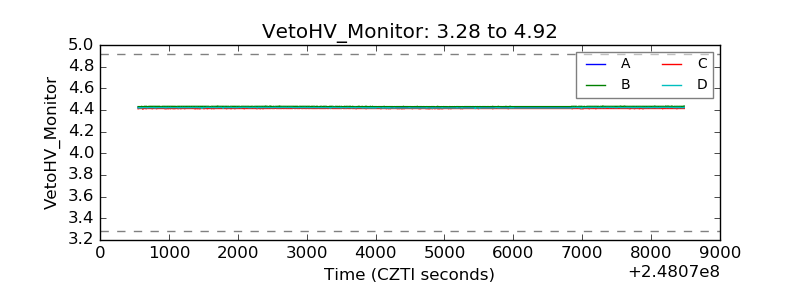 |
| Veto LLD | 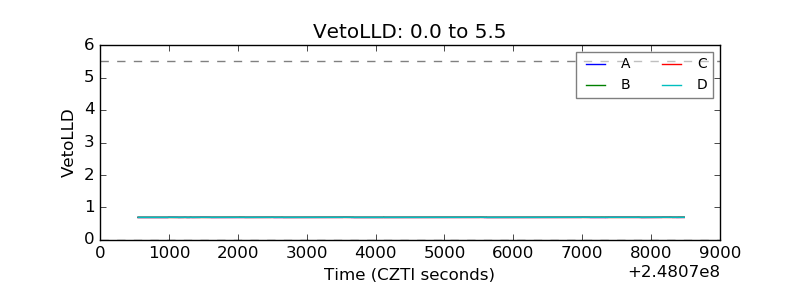 |
| Alpha Counter | 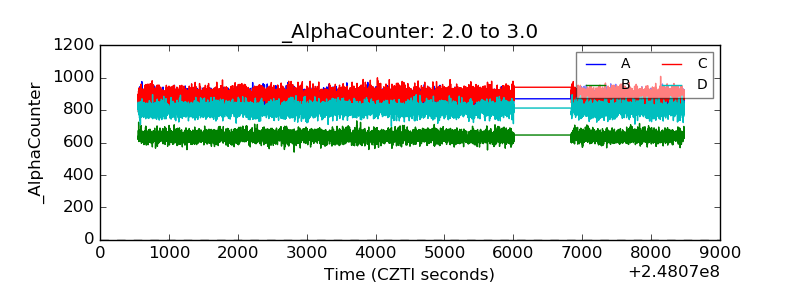 |
| _CPM_Rate | 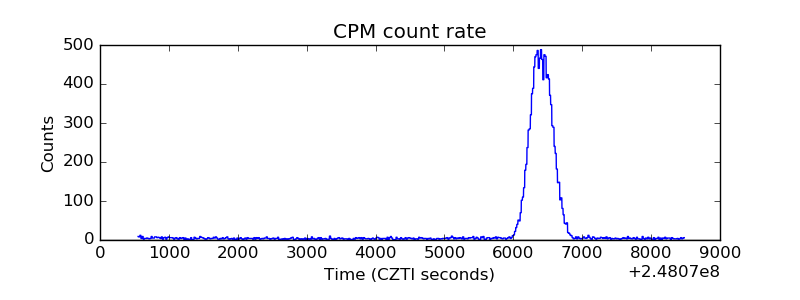 |
| CZT Counter | 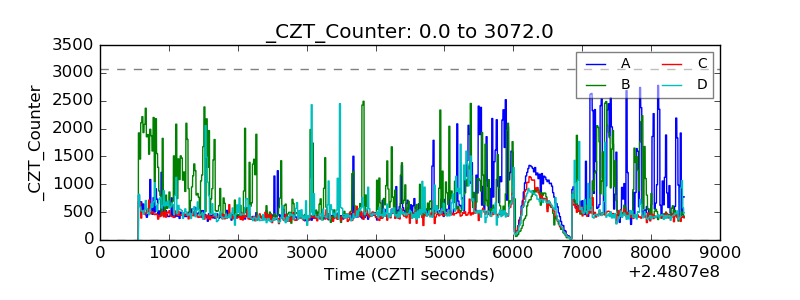 |
| +2.5 Volts monitor | 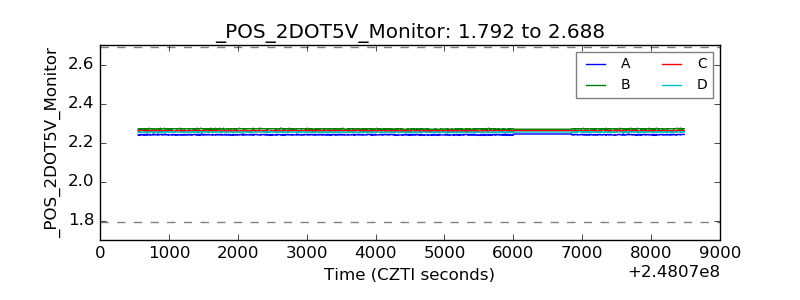 |
| +5 Volts monitor |  |
| _ROLL_ROT | 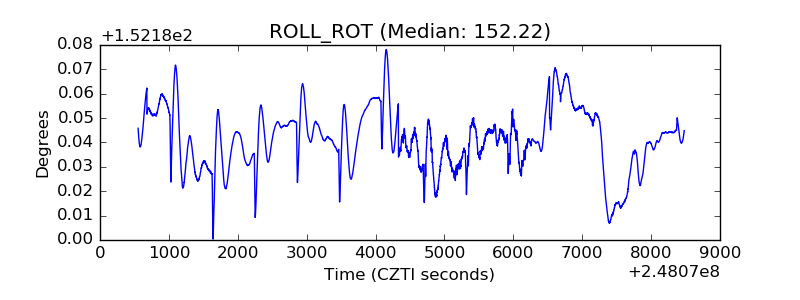 |
| _Roll_DEC | 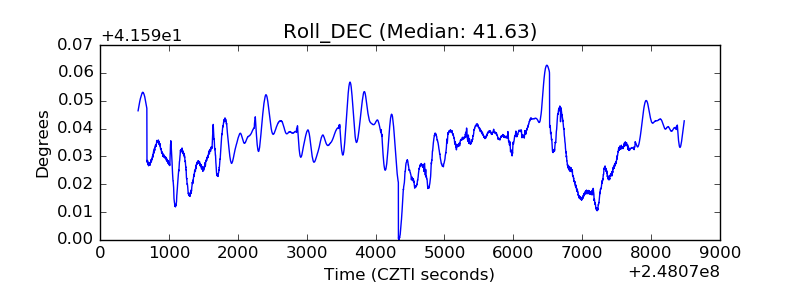 |
| _Roll_RA | 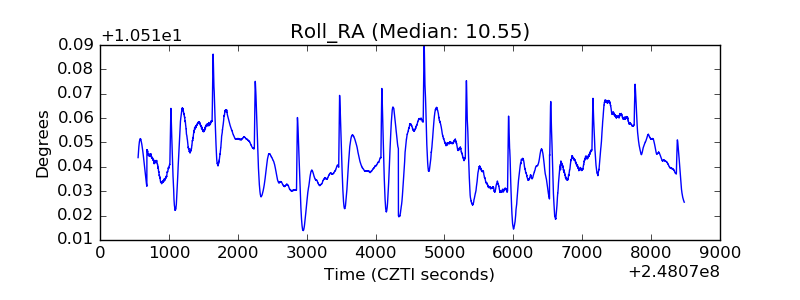 |
| Veto Counter | 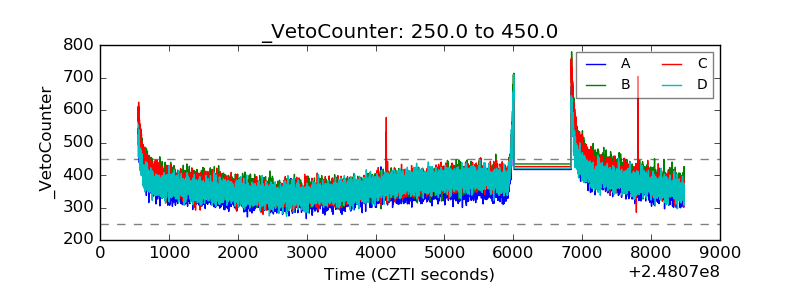 |