| Param | Original file | Final file |
|---|---|---|
| Filename | modeM0/AS1A04_021T04_9000001682_11473cztM0_level2.evt | modeM0/AS1A04_021T04_9000001682_11473cztM0_level2_quad_clean.evt |
| Size (bytes) | 758,871,360 | 72,840,960 |
| Size | 723.7 MB | 69.5 MB |
| Events in quadrant A | 7,451,308 | 401,671 |
| Events in quadrant B | 7,595,943 | 384,279 |
| Events in quadrant C | 3,281,609 | 480,266 |
| Events in quadrant D | 4,177,124 | 447,439 |
| Mode M0 | |||
|---|---|---|---|
| Quadrant | BADHDUFLAG | Total packets | Discarded packets |
| A | 0 | 26900 | 3 |
| B | 0 | 27282 | 2 |
| C | 0 | 14484 | 2 |
| D | 0 | 17093 | 2 |
| Mode SS | |||
|---|---|---|---|
| Quadrant | BADHDUFLAG | Total packets | Discarded packets |
| A | 0 | 144 | 0 |
| B | 0 | 144 | 0 |
| C | 0 | 144 | 0 |
| D | 0 | 144 | 0 |
| Mode M9 | |||
|---|---|---|---|
| Quadrant | BADHDUFLAG | Total packets | Discarded packets |
| A | 0 | 18 | 0 |
| B | 0 | 18 | 0 |
| C | 0 | 18 | 0 |
| D | 0 | 18 | 0 |
| Quadrant | Total seconds | Saturated seconds | Saturation percentage |
|---|---|---|---|
| A | 7054 | 1282 | 18.174086% |
| B | 7054 | 1669 | 23.660335% |
| C | 7054 | 70 | 0.992345% |
| D | 7054 | 142 | 2.013042% |
Noise dominated data is calculated using 1-second bins in cleaned event files. If a bin has >2000 counts, and if more than 50% of those come from <1% of pixels, then it is considered to be noise-dominated and hence unusable.
| Quadrant | # 1 sec bins | Bins with >0 counts | Bins with >2000 counts | High rate bins dominated by noise | Noise dominated (total time) | Noise dominated (detector-on time) | Marked lightcurve |
|---|---|---|---|---|---|---|---|
| A | 8865 | 7057 | 848 | 848 | 9.57% | 12.02% | 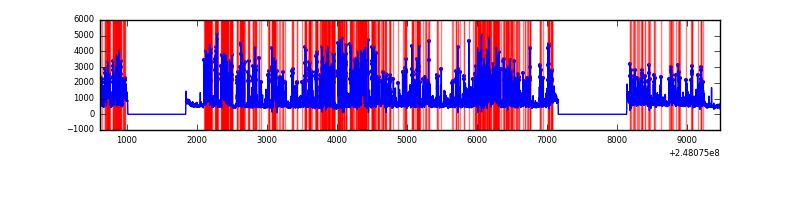 |
| B | 8865 | 7057 | 1019 | 1019 | 11.49% | 14.44% | 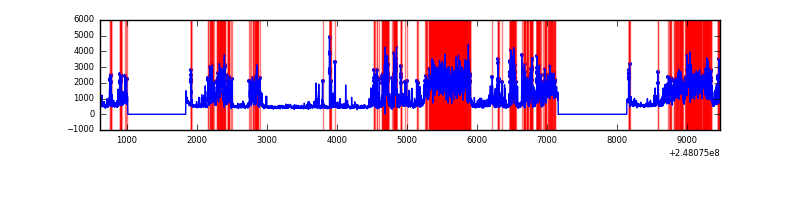 |
| C | 8865 | 7057 | 0 | 0 | 0.00% | 0.00% | 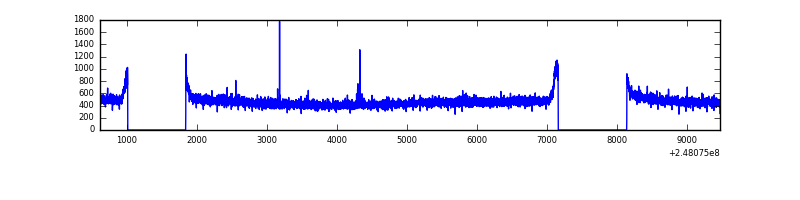 |
| D | 8865 | 7057 | 62 | 62 | 0.70% | 0.88% | 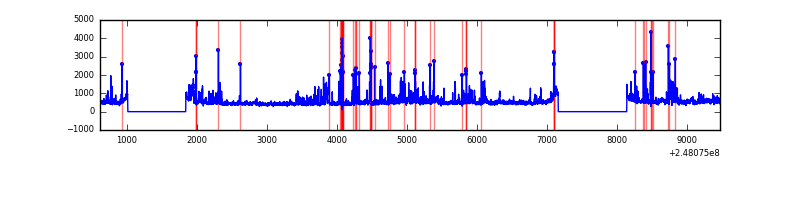 |
Top three noisy pixels from each quadrant. If the there are fewer than three noisy pixels in the level2.evt file, extra rows are filled as -1
| Pixel properties | Quadrant properties | ||||||
|---|---|---|---|---|---|---|---|
| Quadrant | DetID | PixID | Counts | Sigma | Mean | Median | Sigma |
| A | 8 | 5 | 4264588 | 26505.31 | 794 | 776 | 160.9 |
| A | 1 | 162 | 30017 | 181.77 | 794 | 776 | 160.9 |
| A | 9 | 143 | 23213 | 139.48 | 794 | 776 | 160.9 |
| B | 4 | 81 | 3206786 | 21581.9 | 778 | 759 | 148.6 |
| B | 4 | 239 | 866140 | 5825.45 | 778 | 759 | 148.6 |
| B | 3 | 64 | 302378 | 2030.4 | 778 | 759 | 148.6 |
| C | 14 | 234 | 8054 | 36.91 | 839 | 846 | 195.3 |
| C | 13 | 61 | 6191 | 27.37 | 839 | 846 | 195.3 |
| C | 1 | 3 | 2079 | 6.31 | 839 | 846 | 195.3 |
| D | 1 | 52 | 576075 | 2868.91 | 827 | 804 | 200.5 |
| D | 2 | 14 | 181475 | 901.02 | 827 | 804 | 200.5 |
| D | 10 | 253 | 86028 | 425.02 | 827 | 804 | 200.5 |
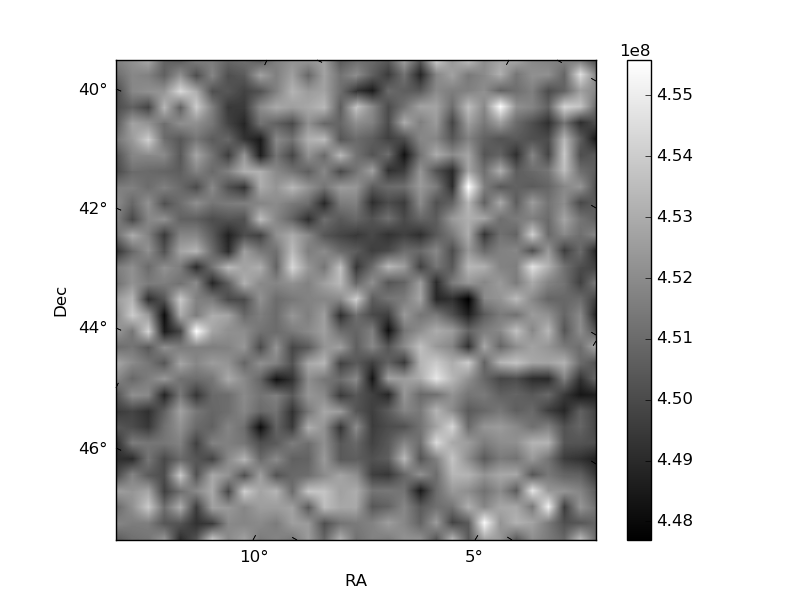
Histogram calculated using DETX and DETY for each event in the final _common_clean file
| Quadrant A |  |
 |
Quadrant B |
|---|---|---|---|
| Quadrant D |  |
 |
Quadrant C |
| Plot type | Count rate plots | Images |
|---|---|---|
| Comparison with Poisson distribution Blue bars denote a histogram of data divided into 1 sec bins. Red curve is a Poisson curve with rate = median count rate of data. |
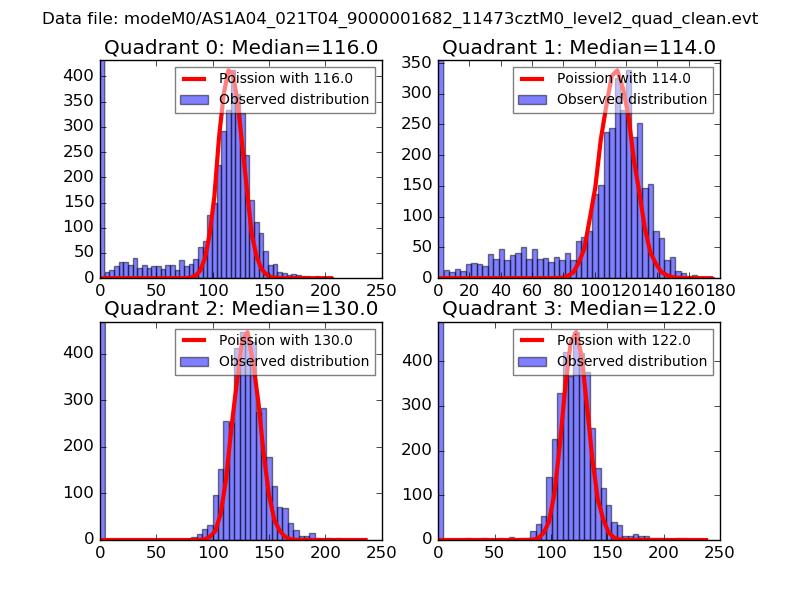 |
 |
| Quadrant-wise count rates Data is divided into 100 sec bins |
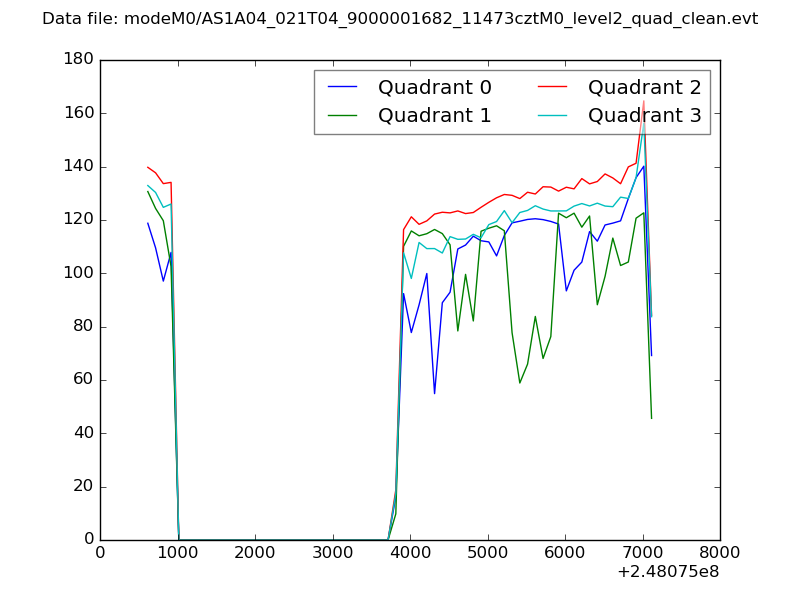 |
|
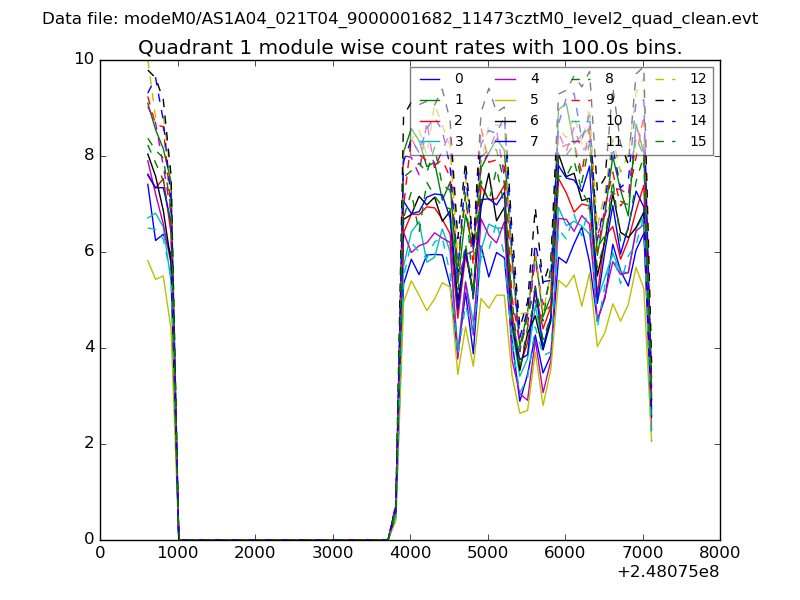
| Module-wise count rates for Quadrant A Data is divided into 100 sec bins |
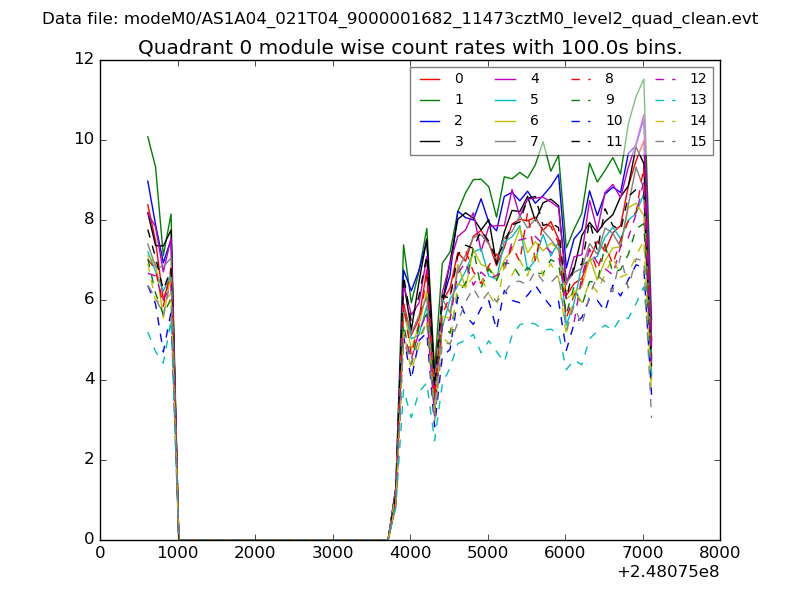 |
 |
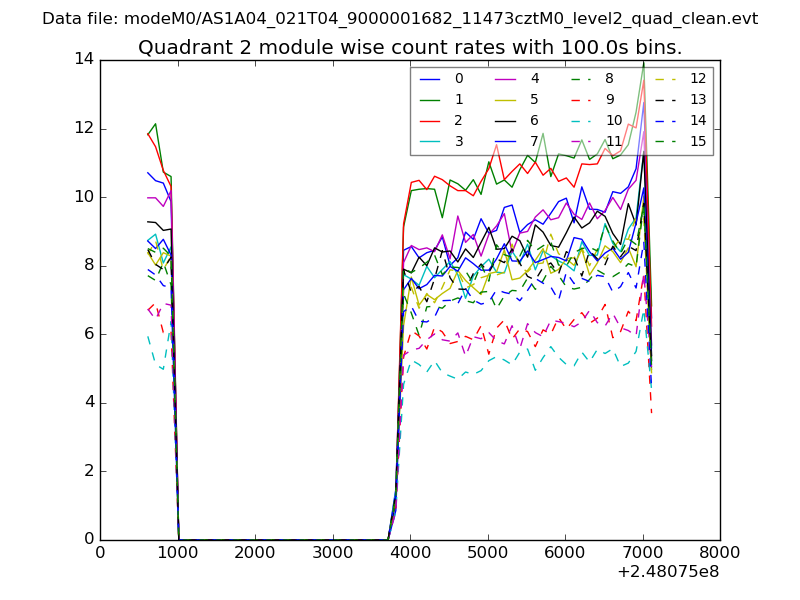
| Module-wise count rates for Quadrant B Data is divided into 100 sec bins |
 |
 |
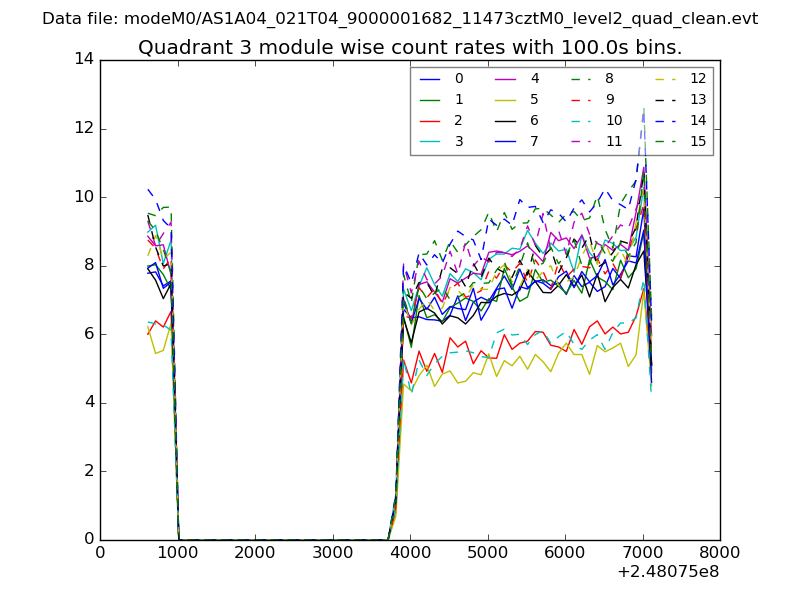
| Module-wise count rates for Quadrant C Data is divided into 100 sec bins |
 |
 |
| Module-wise count rates for Quadrant D Data is divided into 100 sec bins |
 |
 |
| Parameter | Plot |
|---|---|
| CZT HV Monitor | 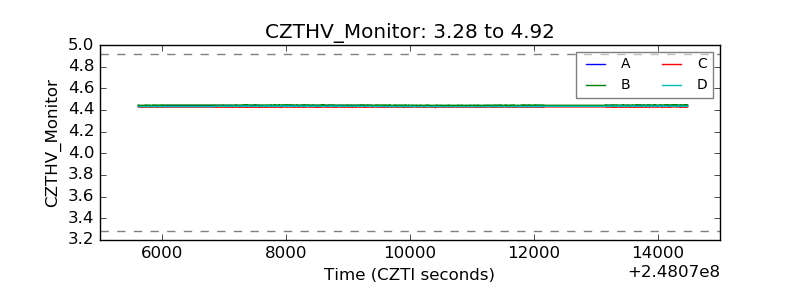 |
| D_VDD | 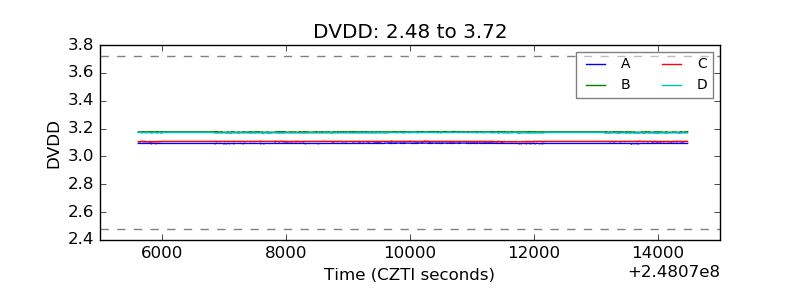 |
| Temperature 1 | 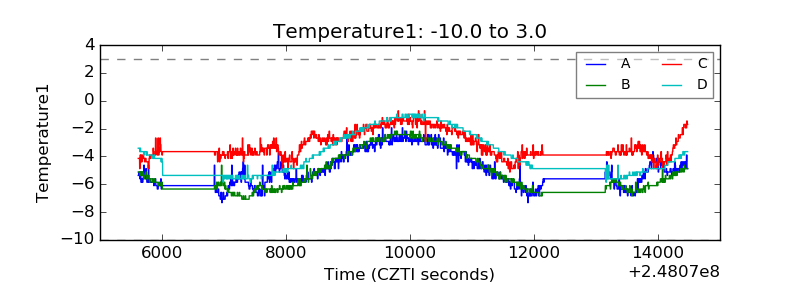 |
| Veto HV Monitor | 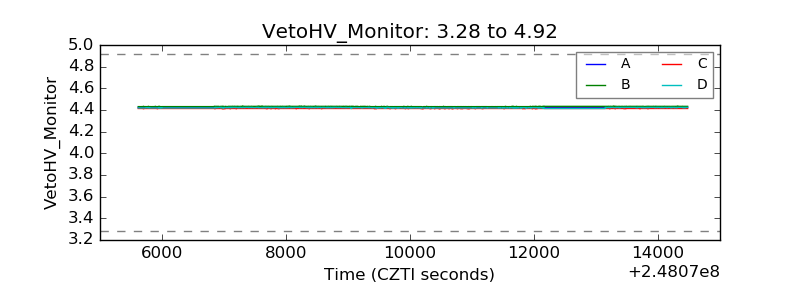 |
| Veto LLD | 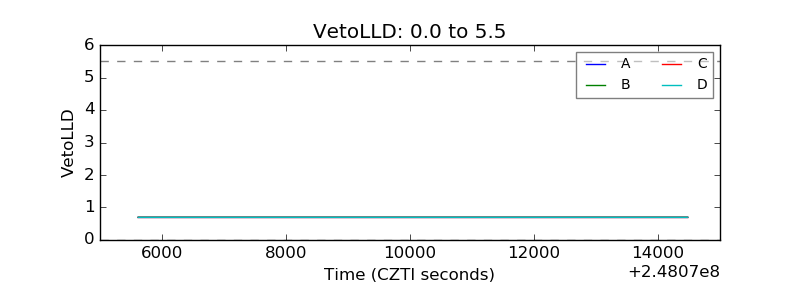 |
| Alpha Counter |  |
| _CPM_Rate | 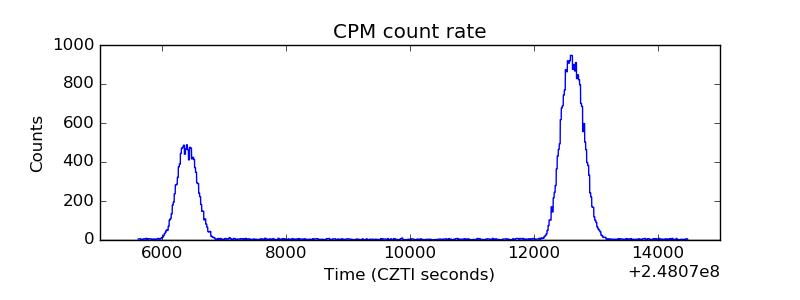 |
| CZT Counter |  |
| +2.5 Volts monitor |  |
| +5 Volts monitor |  |
| _ROLL_ROT | 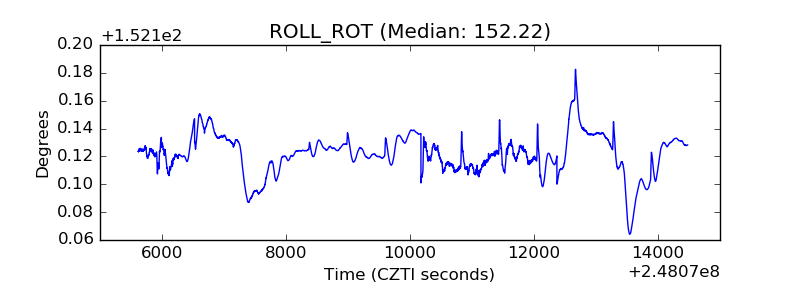 |
| _Roll_DEC | 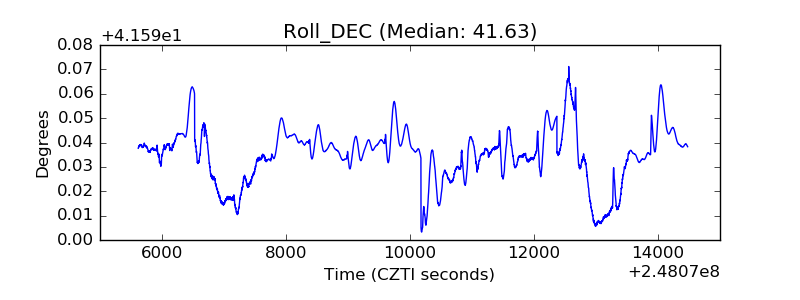 |
| _Roll_RA | 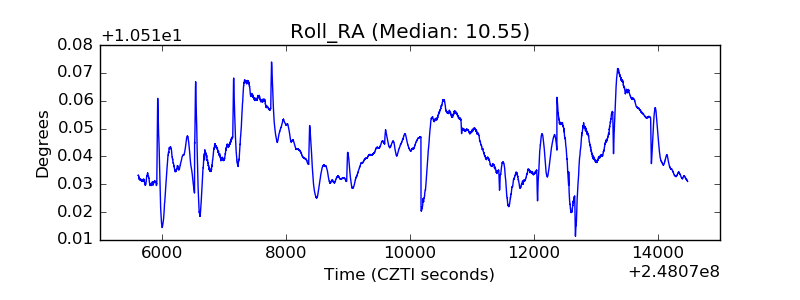 |
| Veto Counter | 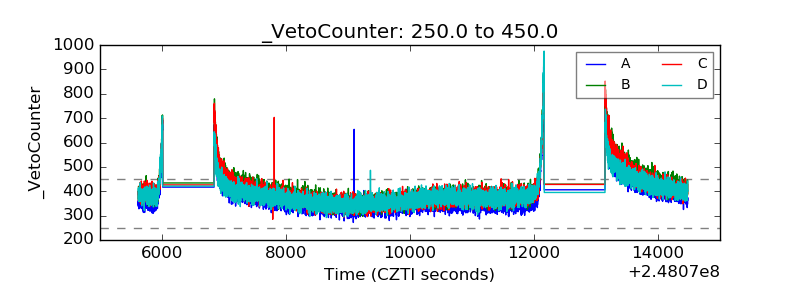 |