| Param | Original file | Final file |
|---|---|---|
| Filename | modeM0/AS1A04_021T04_9000001682_11475cztM0_level2.evt | modeM0/AS1A04_021T04_9000001682_11475cztM0_level2_quad_clean.evt |
| Size (bytes) | 713,761,920 | 80,550,720 |
| Size | 680.7 MB | 76.8 MB |
| Events in quadrant A | 6,084,069 | 476,306 |
| Events in quadrant B | 7,372,291 | 466,141 |
| Events in quadrant C | 3,226,701 | 531,417 |
| Events in quadrant D | 4,476,193 | 493,169 |
| Mode M0 | |||
|---|---|---|---|
| Quadrant | BADHDUFLAG | Total packets | Discarded packets |
| A | 0 | 22732 | 3 |
| B | 0 | 26521 | 2 |
| C | 0 | 14005 | 2 |
| D | 0 | 17655 | 2 |
| Mode SS | |||
|---|---|---|---|
| Quadrant | BADHDUFLAG | Total packets | Discarded packets |
| A | 0 | 136 | 0 |
| B | 0 | 136 | 0 |
| C | 0 | 136 | 0 |
| D | 0 | 136 | 0 |
| Mode M9 | |||
|---|---|---|---|
| Quadrant | BADHDUFLAG | Total packets | Discarded packets |
| A | 0 | 22 | 0 |
| B | 0 | 22 | 0 |
| C | 0 | 22 | 0 |
| D | 0 | 22 | 0 |
| Quadrant | Total seconds | Saturated seconds | Saturation percentage |
|---|---|---|---|
| A | 6776 | 656 | 9.681228% |
| B | 6776 | 1438 | 21.221960% |
| C | 6776 | 63 | 0.929752% |
| D | 6776 | 242 | 3.571429% |
Noise dominated data is calculated using 1-second bins in cleaned event files. If a bin has >2000 counts, and if more than 50% of those come from <1% of pixels, then it is considered to be noise-dominated and hence unusable.
| Quadrant | # 1 sec bins | Bins with >0 counts | Bins with >2000 counts | High rate bins dominated by noise | Noise dominated (total time) | Noise dominated (detector-on time) | Marked lightcurve |
|---|---|---|---|---|---|---|---|
| A | 8887 | 6779 | 328 | 328 | 3.69% | 4.84% | 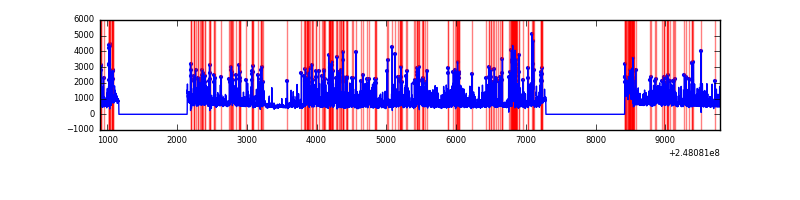 |
| B | 8887 | 6779 | 736 | 736 | 8.28% | 10.86% | 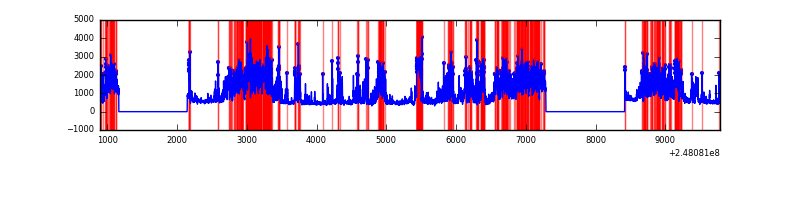 |
| C | 8887 | 6779 | 0 | 0 | 0.00% | 0.00% | 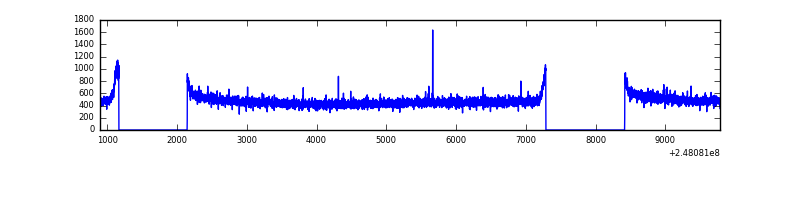 |
| D | 8887 | 6779 | 151 | 151 | 1.70% | 2.23% | 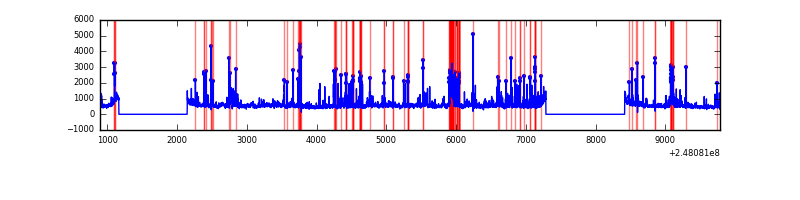 |
Top three noisy pixels from each quadrant. If the there are fewer than three noisy pixels in the level2.evt file, extra rows are filled as -1
| Pixel properties | Quadrant properties | ||||||
|---|---|---|---|---|---|---|---|
| Quadrant | DetID | PixID | Counts | Sigma | Mean | Median | Sigma |
| A | 8 | 5 | 2764984 | 16757.42 | 823 | 805 | 165.0 |
| A | 1 | 162 | 36738 | 217.84 | 823 | 805 | 165.0 |
| A | 9 | 143 | 32332 | 191.13 | 823 | 805 | 165.0 |
| B | 4 | 81 | 3200999 | 21283.32 | 792 | 775 | 150.4 |
| B | 4 | 239 | 723556 | 4806.91 | 792 | 775 | 150.4 |
| B | 0 | 85 | 199135 | 1319.21 | 792 | 775 | 150.4 |
| C | 13 | 61 | 6250 | 28.3 | 826 | 834 | 191.4 |
| C | 14 | 234 | 4877 | 21.13 | 826 | 834 | 191.4 |
| C | 3 | 9 | 2374 | 8.05 | 826 | 834 | 191.4 |
| D | 1 | 52 | 1081903 | 5593.58 | 814 | 792 | 193.3 |
| D | 2 | 120 | 110693 | 568.62 | 814 | 792 | 193.3 |
| D | 10 | 253 | 71866 | 367.73 | 814 | 792 | 193.3 |
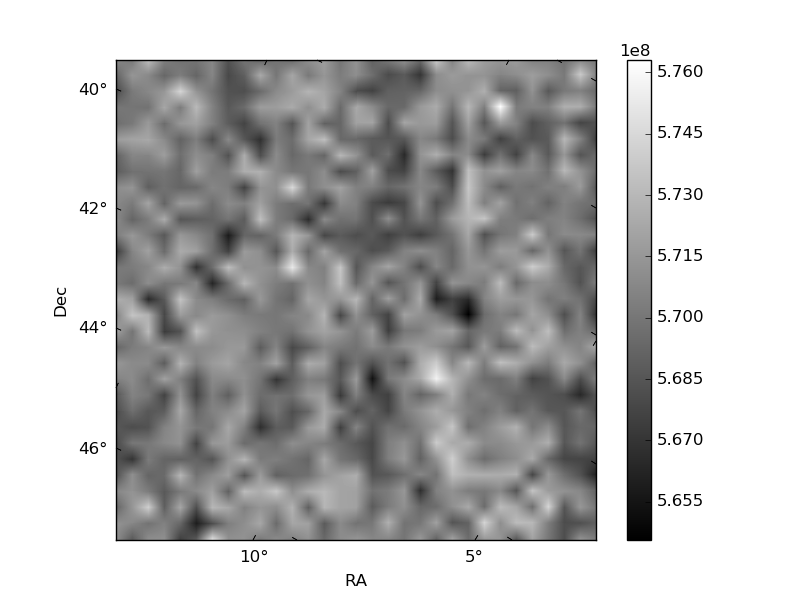
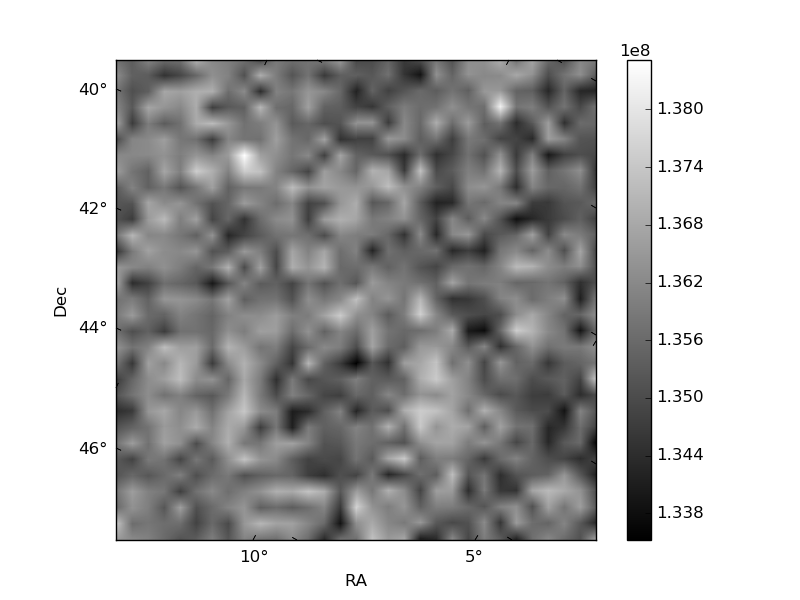
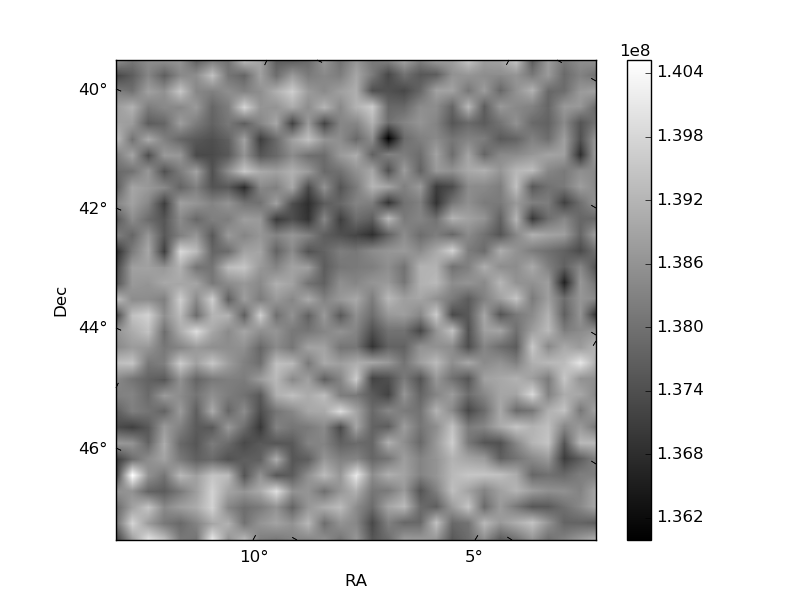
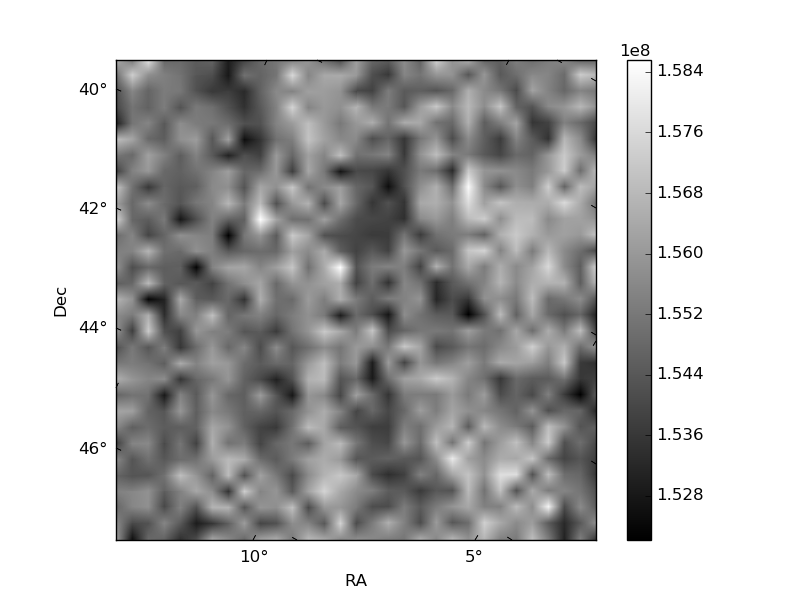
Histogram calculated using DETX and DETY for each event in the final _common_clean file
| Quadrant A | 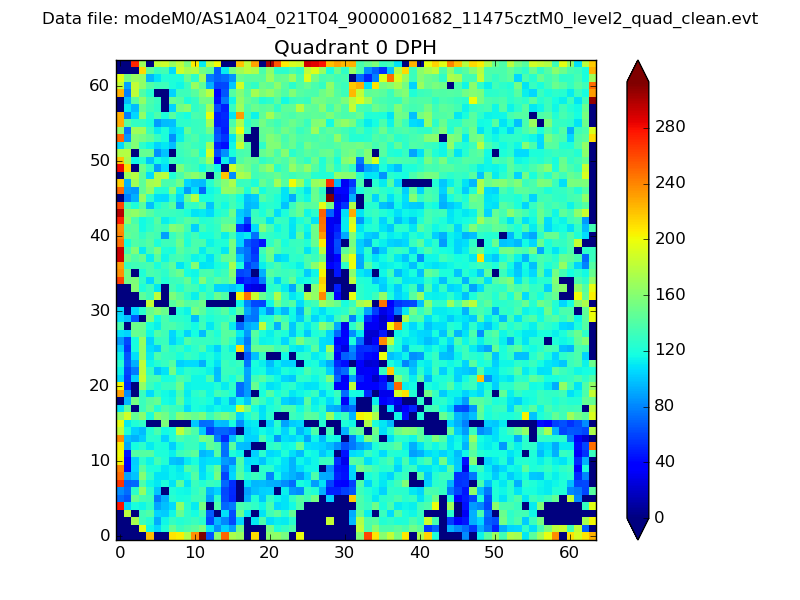 |
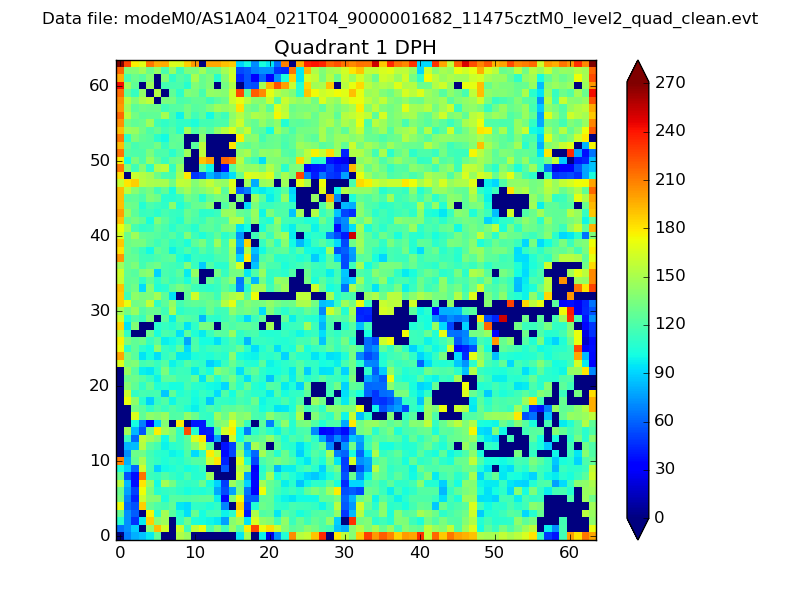 |
Quadrant B |
|---|---|---|---|
| Quadrant D | 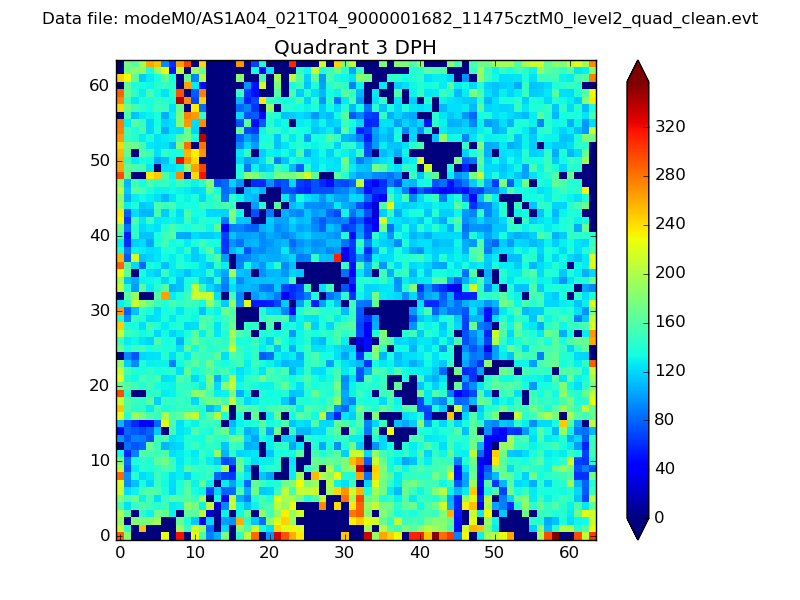 |
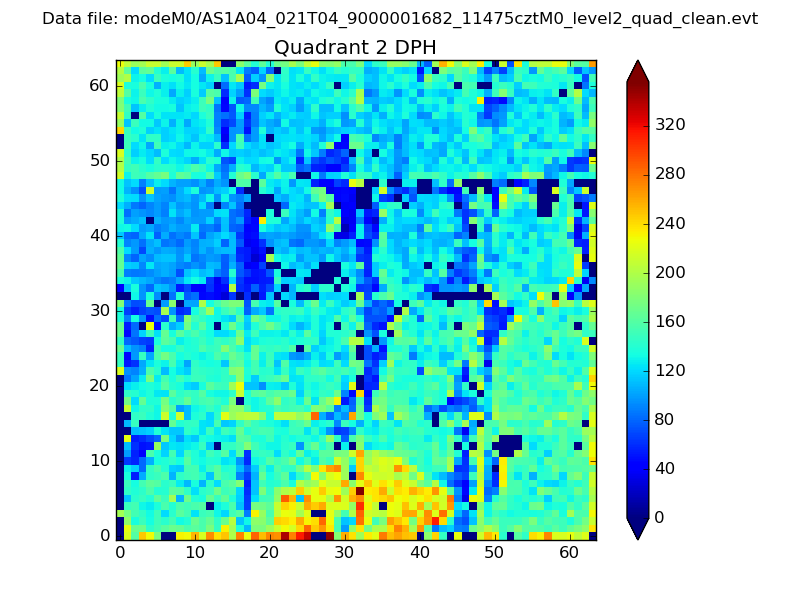 |
Quadrant C |
| Plot type | Count rate plots | Images |
|---|---|---|
| Comparison with Poisson distribution Blue bars denote a histogram of data divided into 1 sec bins. Red curve is a Poisson curve with rate = median count rate of data. |
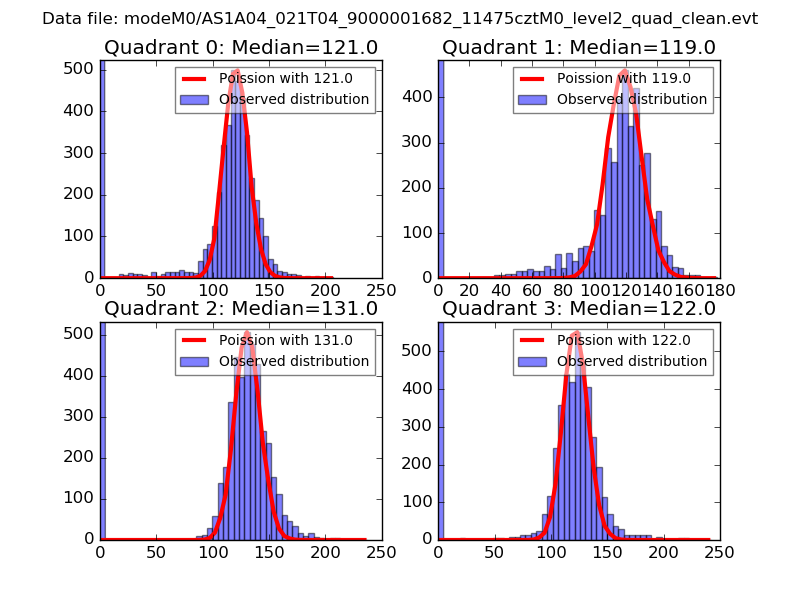 |
 |
| Quadrant-wise count rates Data is divided into 100 sec bins |
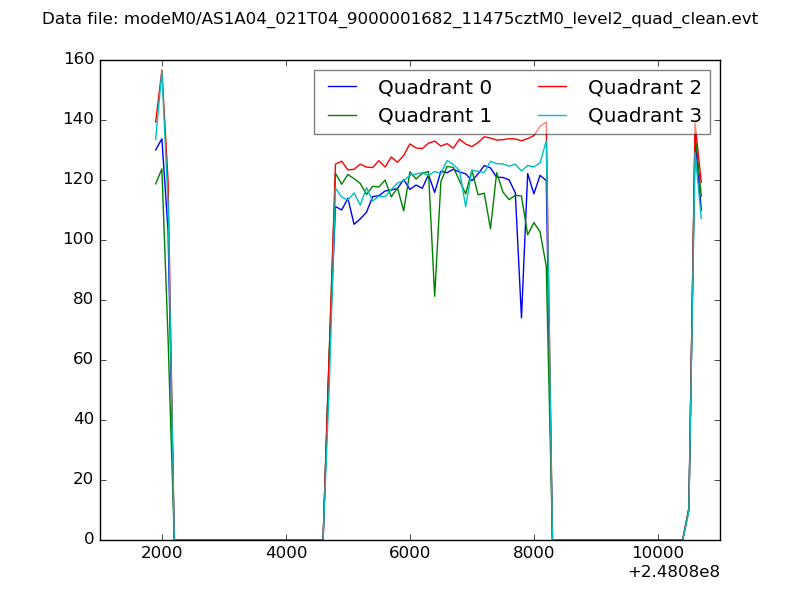 |
|
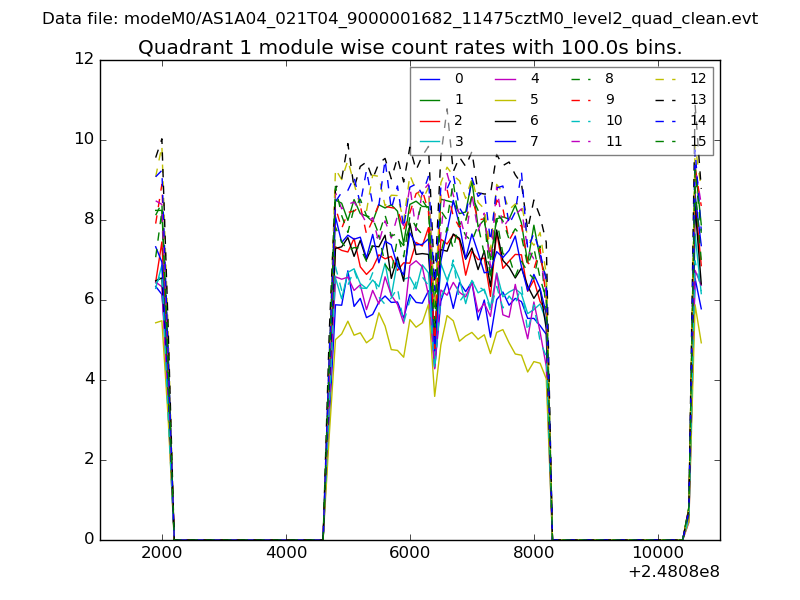
| Module-wise count rates for Quadrant A Data is divided into 100 sec bins |
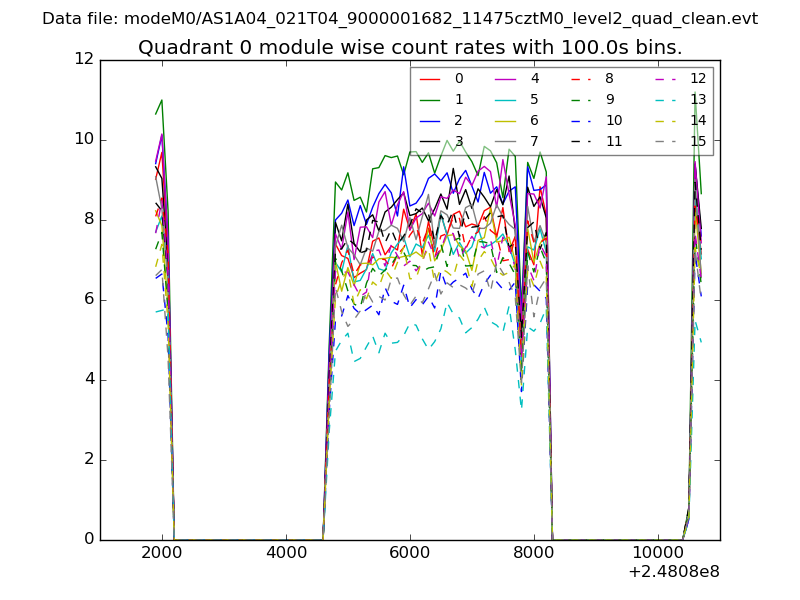 |
 |
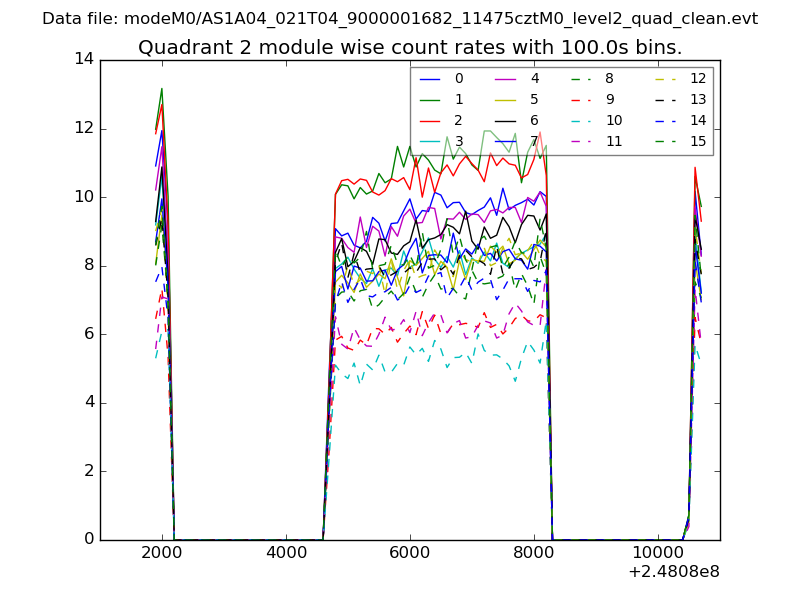
| Module-wise count rates for Quadrant B Data is divided into 100 sec bins |
 |
 |
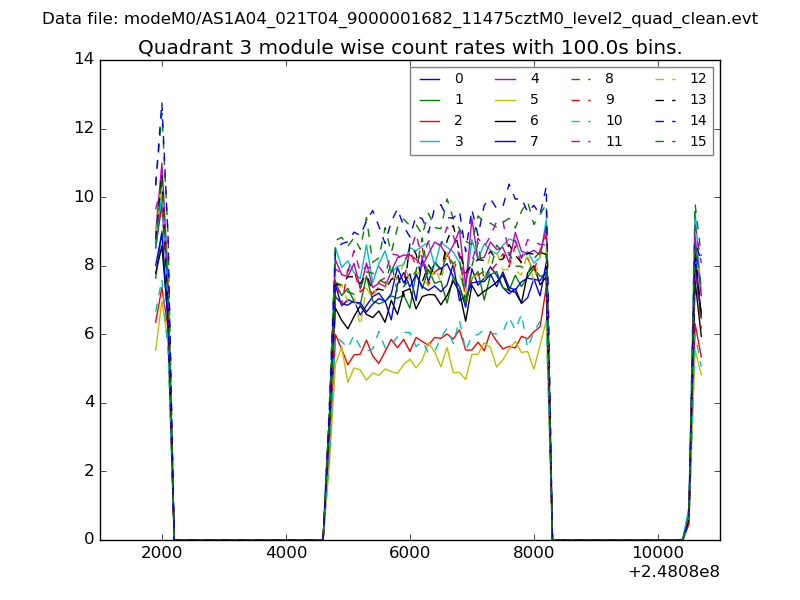
| Module-wise count rates for Quadrant C Data is divided into 100 sec bins |
 |
 |
| Module-wise count rates for Quadrant D Data is divided into 100 sec bins |
 |
 |
| Parameter | Plot |
|---|---|
| CZT HV Monitor | 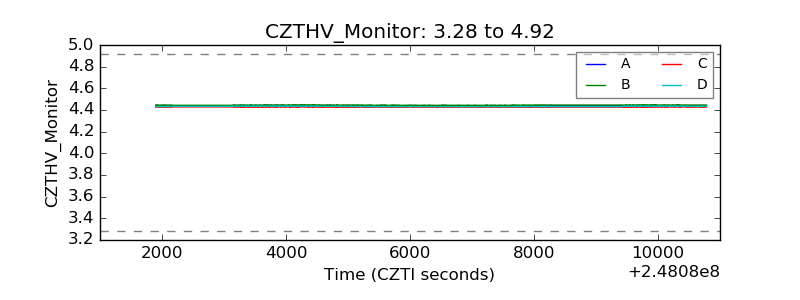 |
| D_VDD | 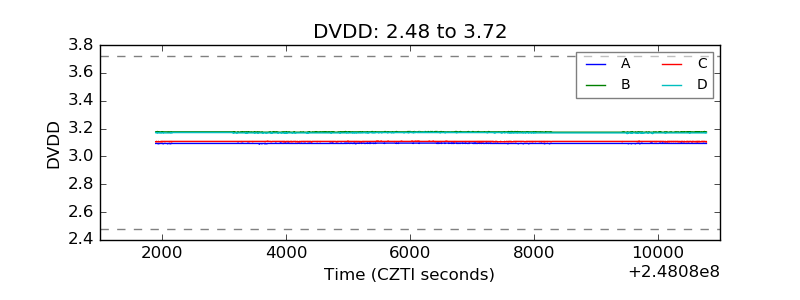 |
| Temperature 1 | 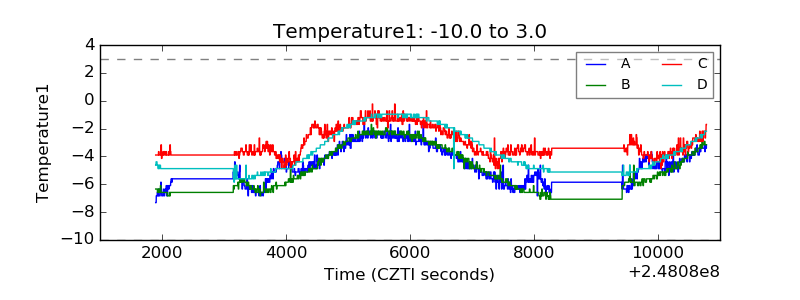 |
| Veto HV Monitor | 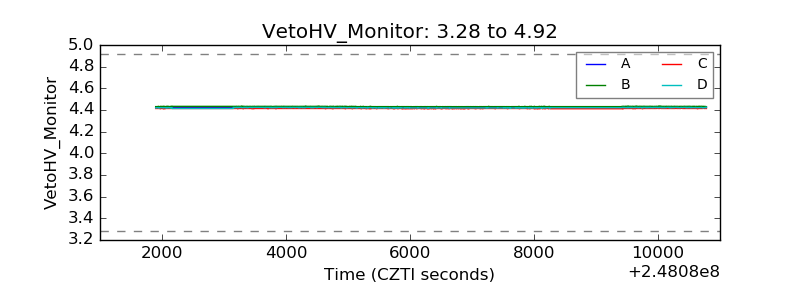 |
| Veto LLD | 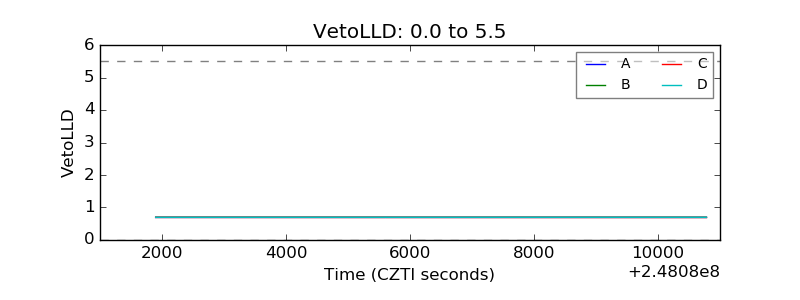 |
| Alpha Counter | 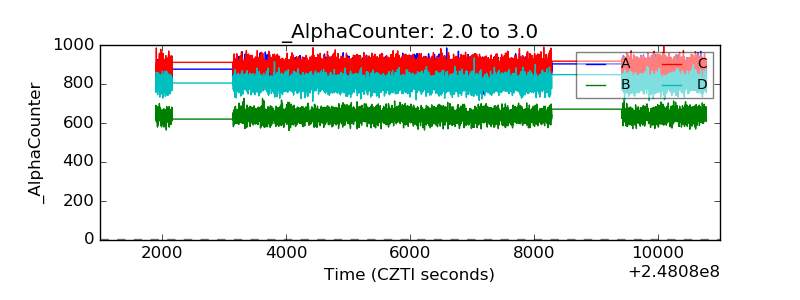 |
| _CPM_Rate | 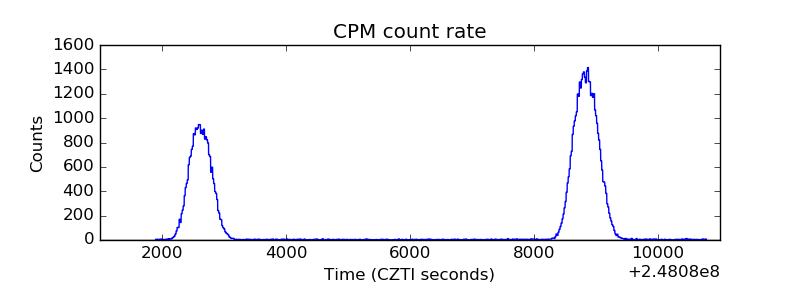 |
| CZT Counter | 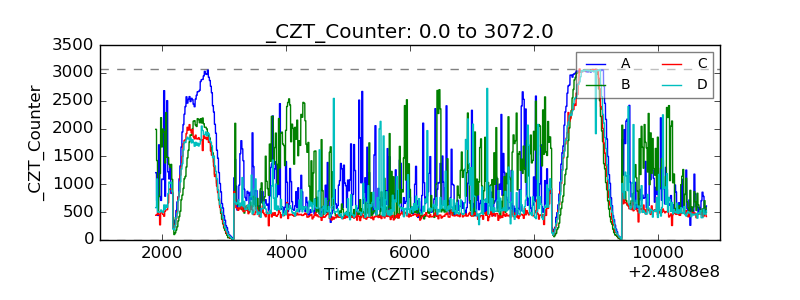 |
| +2.5 Volts monitor |  |
| +5 Volts monitor |  |
| _ROLL_ROT | 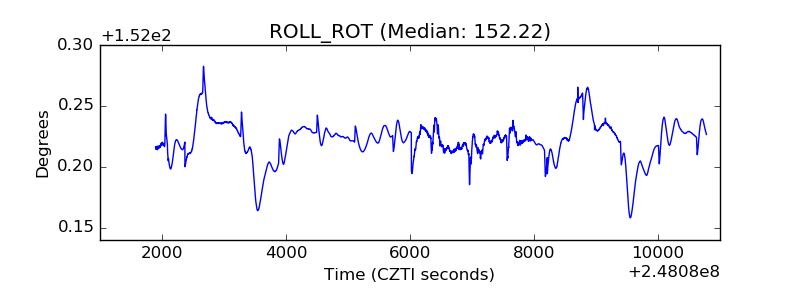 |
| _Roll_DEC | 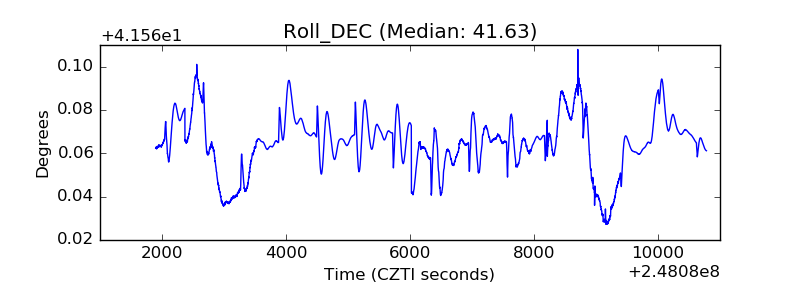 |
| _Roll_RA | 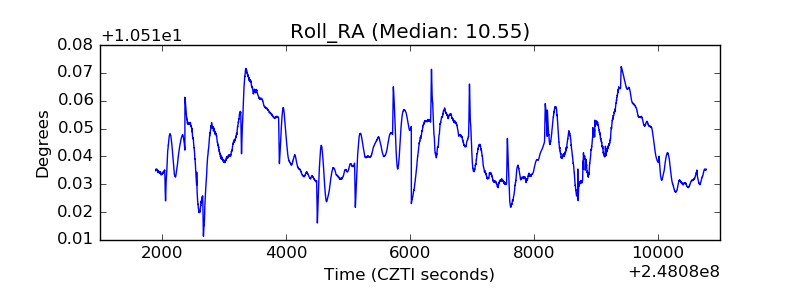 |
| Veto Counter | 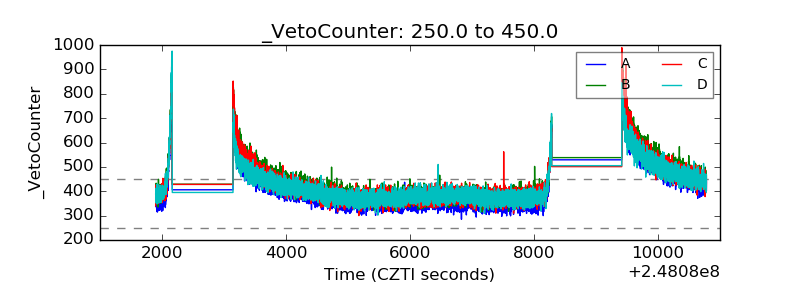 |