| Param | Original file | Final file |
|---|---|---|
| Filename | modeM0/AS1A04_021T04_9000001682_11476cztM0_level2.evt | modeM0/AS1A04_021T04_9000001682_11476cztM0_level2_quad_clean.evt |
| Size (bytes) | 629,749,440 | 88,174,080 |
| Size | 600.6 MB | 84.1 MB |
| Events in quadrant A | 6,283,218 | 525,645 |
| Events in quadrant B | 5,604,848 | 556,730 |
| Events in quadrant C | 3,157,567 | 589,121 |
| Events in quadrant D | 3,594,338 | 553,075 |
| Mode M0 | |||
|---|---|---|---|
| Quadrant | BADHDUFLAG | Total packets | Discarded packets |
| A | 0 | 23118 | 3 |
| B | 0 | 20874 | 2 |
| C | 0 | 13390 | 2 |
| D | 0 | 14793 | 2 |
| Mode SS | |||
|---|---|---|---|
| Quadrant | BADHDUFLAG | Total packets | Discarded packets |
| A | 0 | 130 | 0 |
| B | 0 | 130 | 0 |
| C | 0 | 130 | 0 |
| D | 0 | 130 | 0 |
| Mode M9 | |||
|---|---|---|---|
| Quadrant | BADHDUFLAG | Total packets | Discarded packets |
| A | 0 | 24 | 0 |
| B | 0 | 24 | 0 |
| C | 0 | 24 | 0 |
| D | 0 | 24 | 0 |
| Quadrant | Total seconds | Saturated seconds | Saturation percentage |
|---|---|---|---|
| A | 6385 | 882 | 13.813626% |
| B | 6385 | 894 | 14.001566% |
| C | 6385 | 73 | 1.143305% |
| D | 6385 | 136 | 2.129992% |
Noise dominated data is calculated using 1-second bins in cleaned event files. If a bin has >2000 counts, and if more than 50% of those come from <1% of pixels, then it is considered to be noise-dominated and hence unusable.
| Quadrant | # 1 sec bins | Bins with >0 counts | Bins with >2000 counts | High rate bins dominated by noise | Noise dominated (total time) | Noise dominated (detector-on time) | Marked lightcurve |
|---|---|---|---|---|---|---|---|
| A | 8721 | 6388 | 475 | 475 | 5.45% | 7.44% |  |
| B | 8721 | 6388 | 306 | 306 | 3.51% | 4.79% | 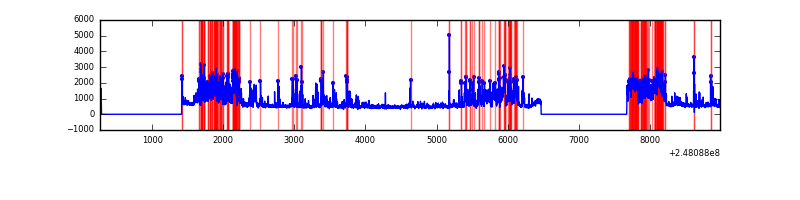 |
| C | 8721 | 6388 | 2 | 2 | 0.02% | 0.03% |  |
| D | 8721 | 6388 | 42 | 42 | 0.48% | 0.66% | 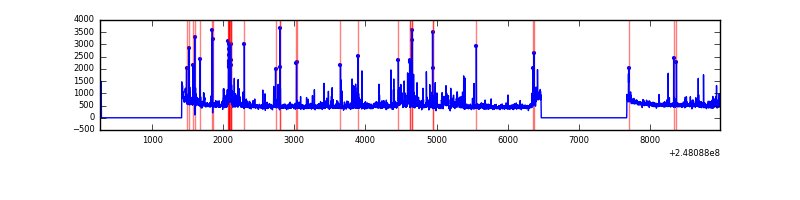 |
Top three noisy pixels from each quadrant. If the there are fewer than three noisy pixels in the level2.evt file, extra rows are filled as -1
| Pixel properties | Quadrant properties | ||||||
|---|---|---|---|---|---|---|---|
| Quadrant | DetID | PixID | Counts | Sigma | Mean | Median | Sigma |
| A | 8 | 5 | 3049503 | 18998.77 | 794 | 778 | 160.5 |
| A | 1 | 162 | 50734 | 311.31 | 794 | 778 | 160.5 |
| A | 9 | 143 | 40679 | 248.65 | 794 | 778 | 160.5 |
| B | 4 | 81 | 1808408 | 12093.22 | 789 | 771 | 149.5 |
| B | 4 | 239 | 528604 | 3531.24 | 789 | 771 | 149.5 |
| B | 15 | 204 | 73407 | 485.94 | 789 | 771 | 149.5 |
| C | 14 | 234 | 24547 | 128.22 | 803 | 809 | 185.1 |
| C | 13 | 61 | 5873 | 27.35 | 803 | 809 | 185.1 |
| C | 12 | 4 | 3320 | 13.56 | 803 | 809 | 185.1 |
| D | 2 | 120 | 216520 | 1133.78 | 802 | 781 | 190.3 |
| D | 1 | 52 | 192250 | 1006.23 | 802 | 781 | 190.3 |
| D | 5 | 222 | 60291 | 312.74 | 802 | 781 | 190.3 |
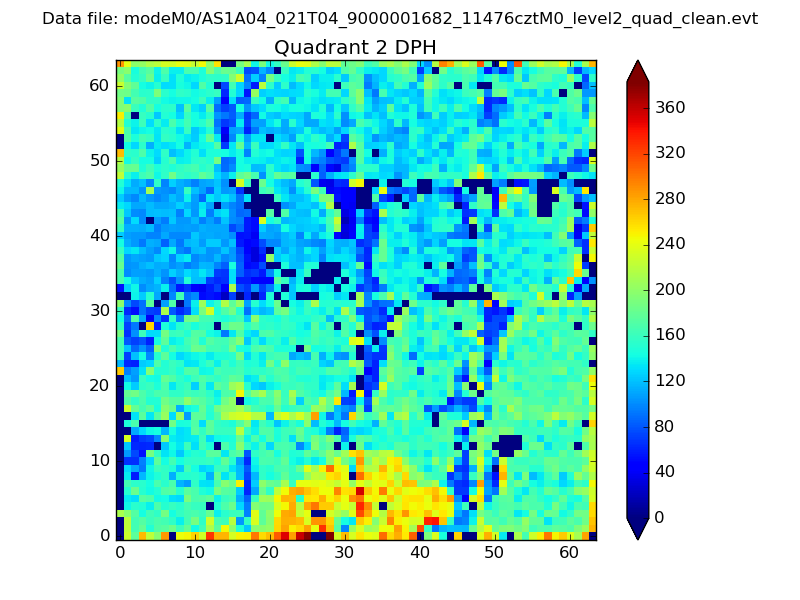
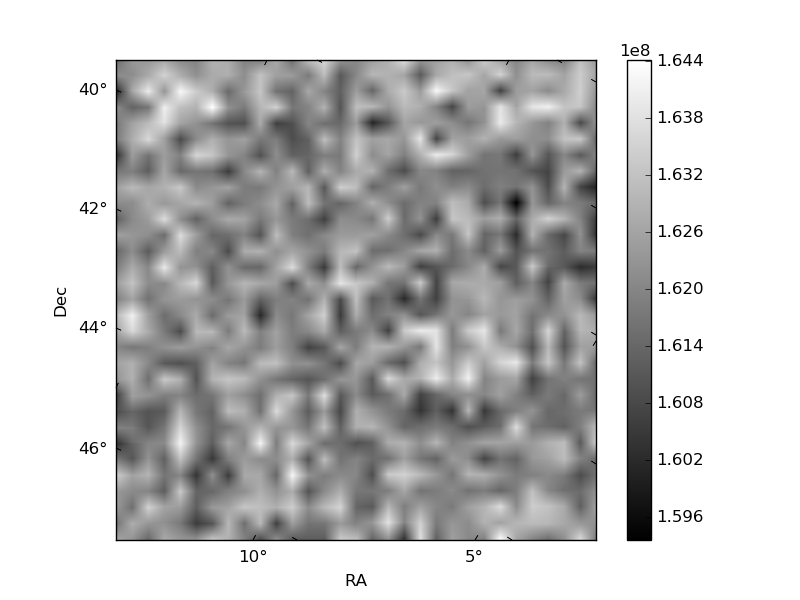
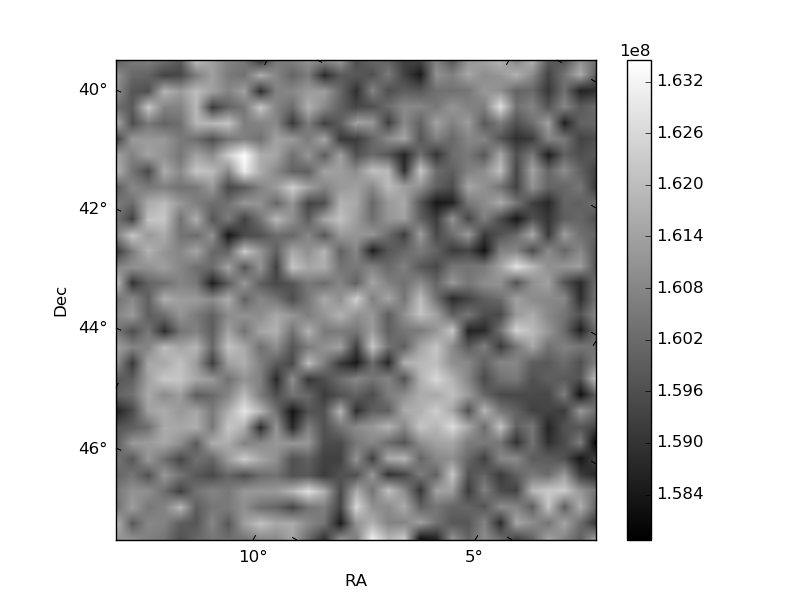
Histogram calculated using DETX and DETY for each event in the final _common_clean file
| Quadrant A | 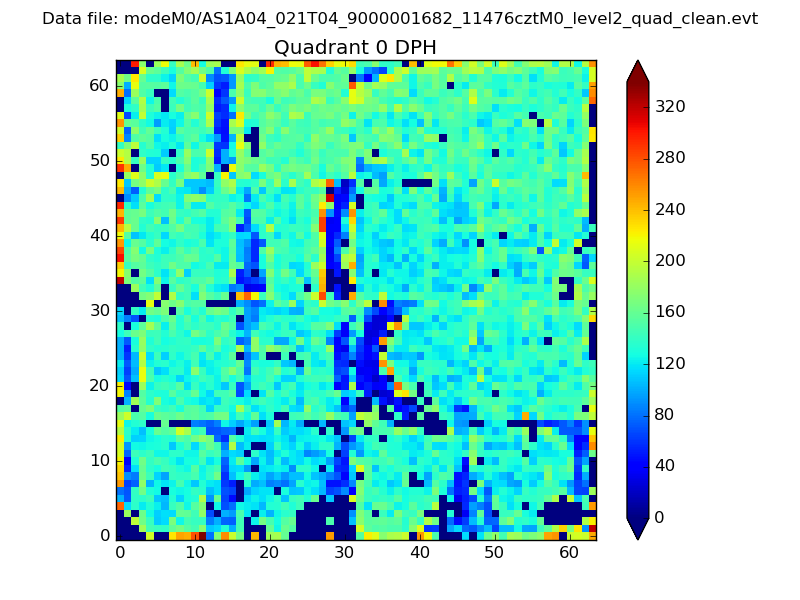 |
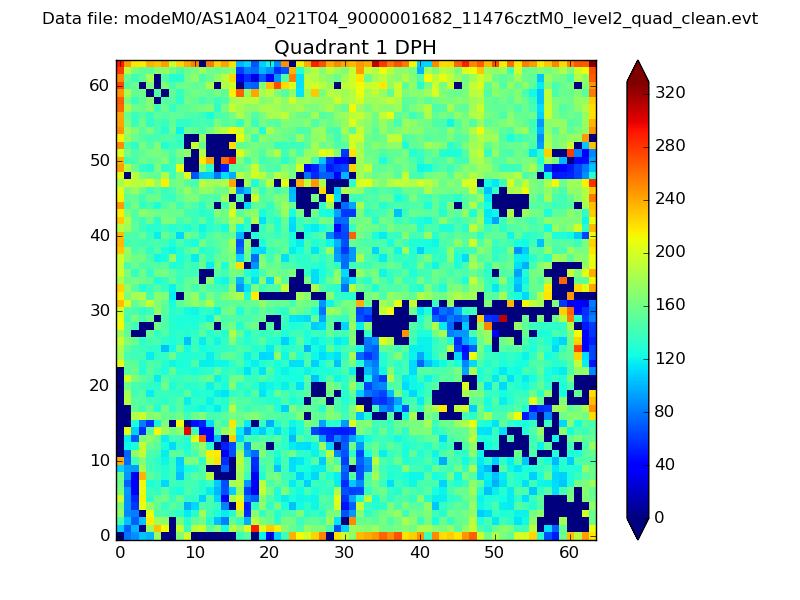 |
Quadrant B |
|---|---|---|---|
| Quadrant D | 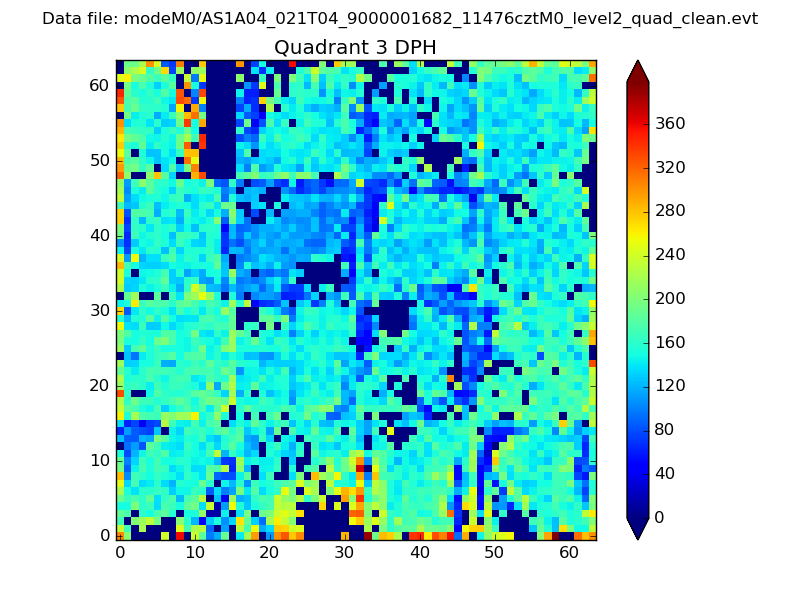 |
 |
Quadrant C |
| Plot type | Count rate plots | Images |
|---|---|---|
| Comparison with Poisson distribution Blue bars denote a histogram of data divided into 1 sec bins. Red curve is a Poisson curve with rate = median count rate of data. |
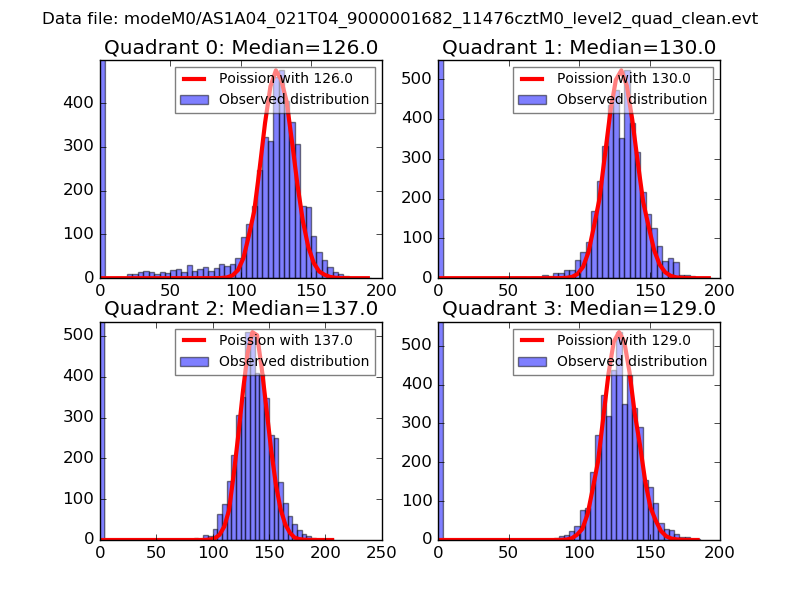 |
 |
| Quadrant-wise count rates Data is divided into 100 sec bins |
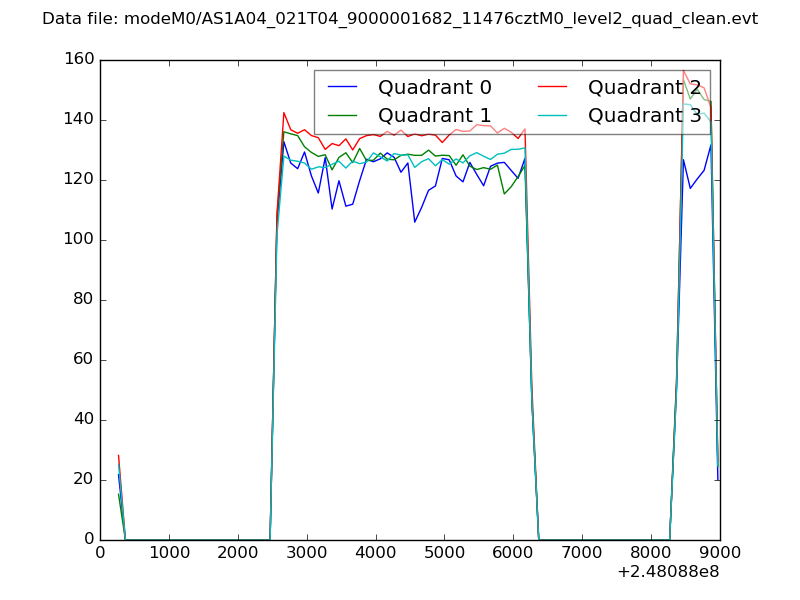 |
|
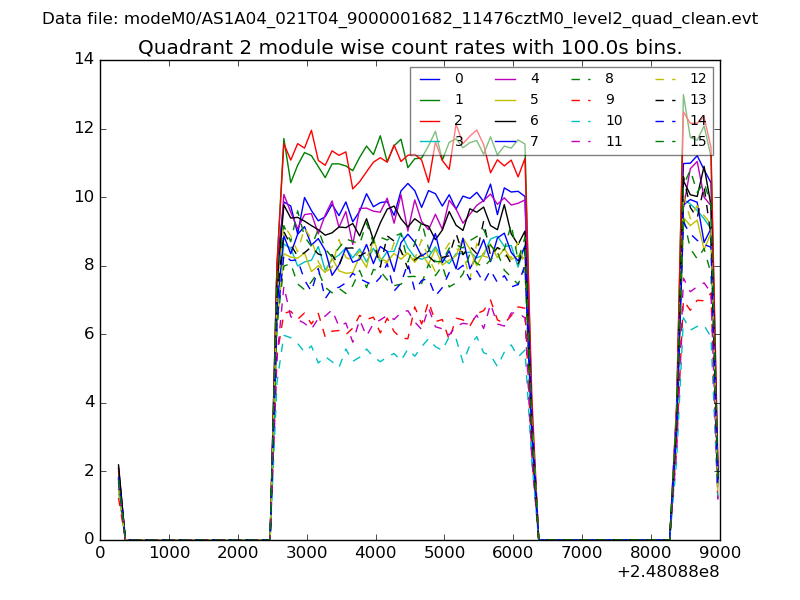
| Module-wise count rates for Quadrant A Data is divided into 100 sec bins |
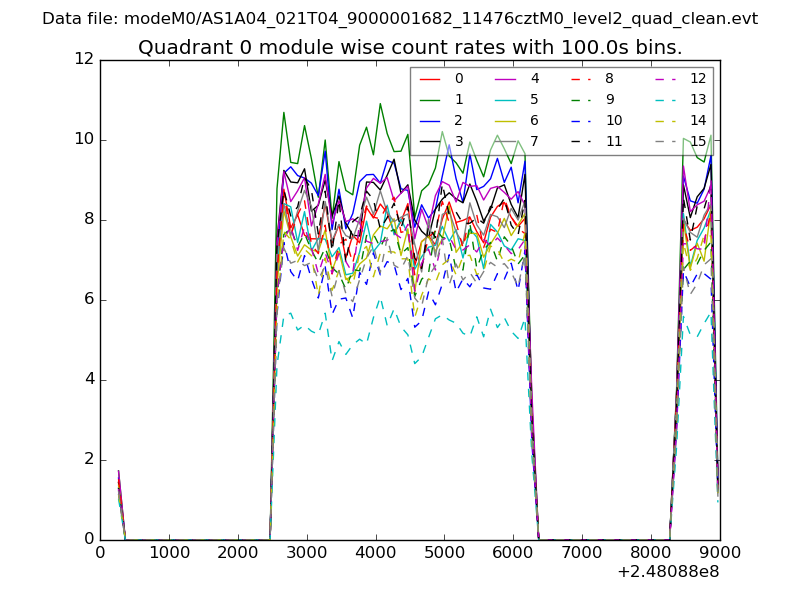 |
 |
| Module-wise count rates for Quadrant B Data is divided into 100 sec bins |
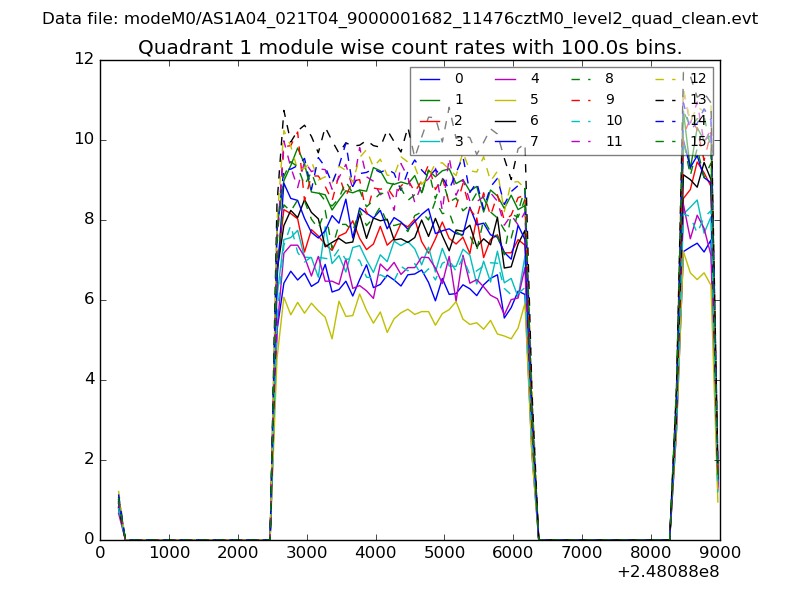 |
 |
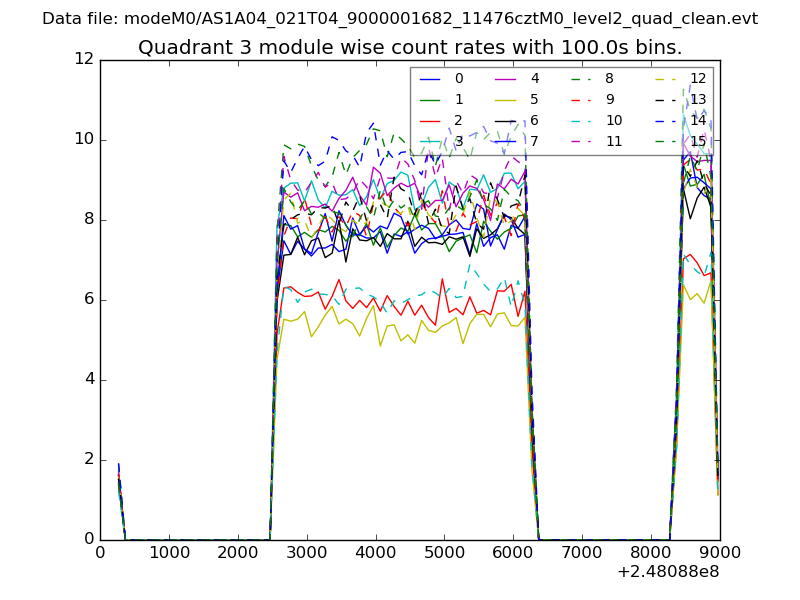
| Module-wise count rates for Quadrant C Data is divided into 100 sec bins |
 |
 |
| Module-wise count rates for Quadrant D Data is divided into 100 sec bins |
 |
 |
| Parameter | Plot |
|---|---|
| CZT HV Monitor | 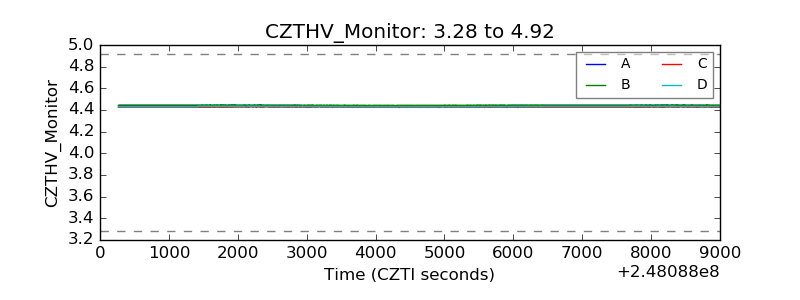 |
| D_VDD | 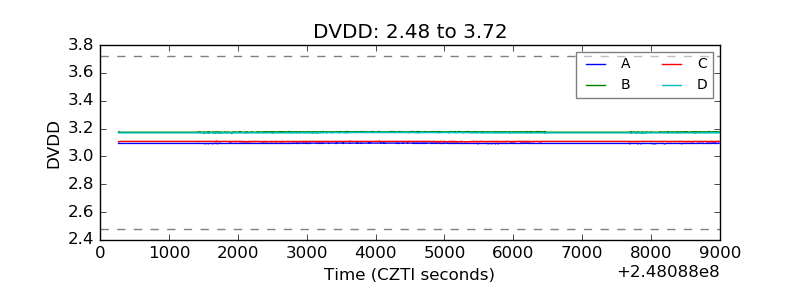 |
| Temperature 1 | 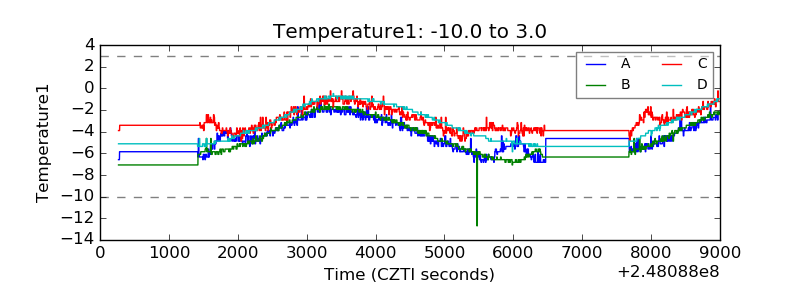 |
| Veto HV Monitor | 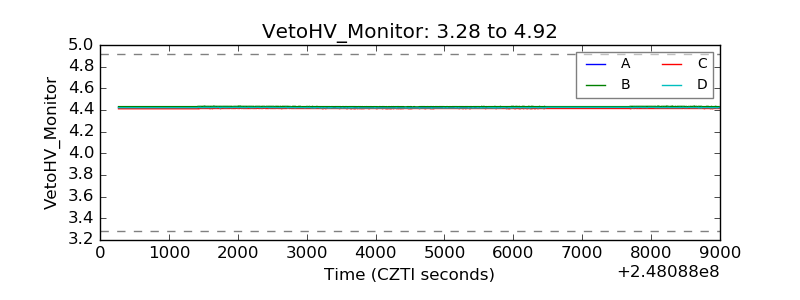 |
| Veto LLD | 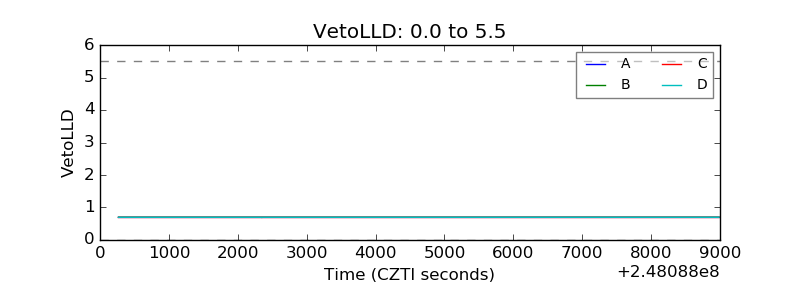 |
| Alpha Counter | 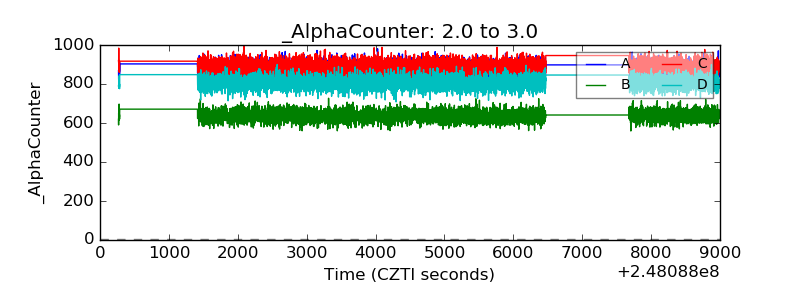 |
| _CPM_Rate | 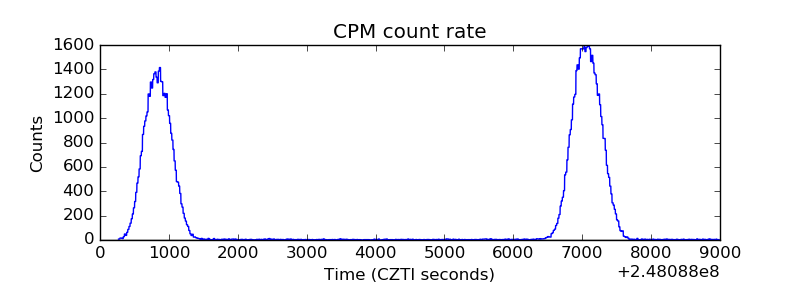 |
| CZT Counter | 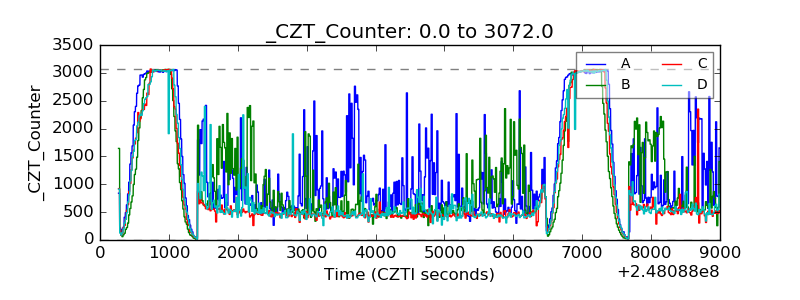 |
| +2.5 Volts monitor |  |
| +5 Volts monitor |  |
| _ROLL_ROT | 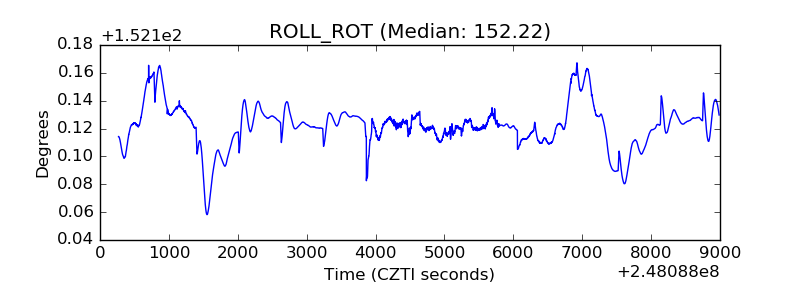 |
| _Roll_DEC | 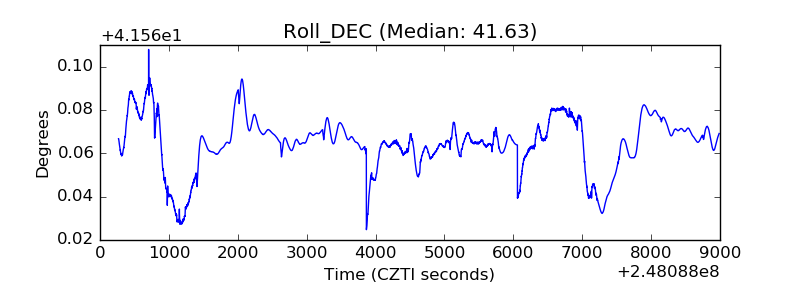 |
| _Roll_RA | 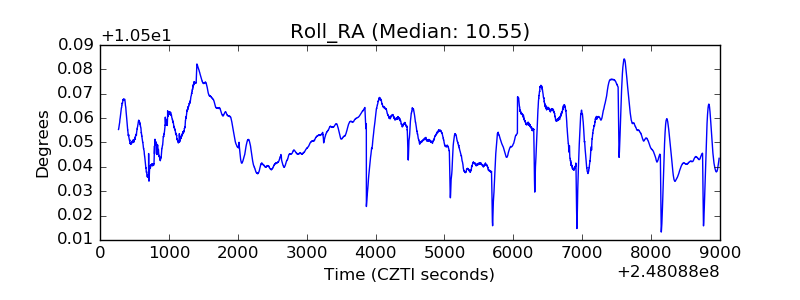 |
| Veto Counter | 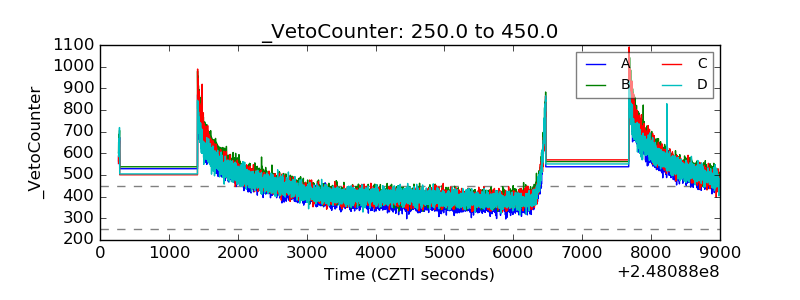 |