| Param | Original file | Final file |
|---|---|---|
| Filename | modeM0/AS1A04_021T04_9000001682_11478cztM0_level2.evt | modeM0/AS1A04_021T04_9000001682_11478cztM0_level2_quad_clean.evt |
| Size (bytes) | 695,128,320 | 107,438,400 |
| Size | 662.9 MB | 102.5 MB |
| Events in quadrant A | 7,960,700 | 654,877 |
| Events in quadrant B | 5,416,996 | 707,885 |
| Events in quadrant C | 2,991,840 | 766,082 |
| Events in quadrant D | 4,270,374 | 698,218 |
| Mode M0 | |||
|---|---|---|---|
| Quadrant | BADHDUFLAG | Total packets | Discarded packets |
| A | 0 | 27915 | 2 |
| B | 0 | 20247 | 1 |
| C | 0 | 12615 | 1 |
| D | 0 | 16599 | 1 |
| Mode SS | |||
|---|---|---|---|
| Quadrant | BADHDUFLAG | Total packets | Discarded packets |
| A | 0 | 122 | 0 |
| B | 0 | 122 | 0 |
| C | 0 | 122 | 0 |
| D | 0 | 122 | 0 |
| Mode M9 | |||
|---|---|---|---|
| Quadrant | BADHDUFLAG | Total packets | Discarded packets |
| A | 0 | 14 | 0 |
| B | 0 | 14 | 0 |
| C | 0 | 14 | 0 |
| D | 0 | 14 | 0 |
| Quadrant | Total seconds | Saturated seconds | Saturation percentage |
|---|---|---|---|
| A | 6107 | 1516 | 24.823972% |
| B | 6107 | 703 | 11.511380% |
| C | 6107 | 32 | 0.523989% |
| D | 6107 | 405 | 6.631734% |
Noise dominated data is calculated using 1-second bins in cleaned event files. If a bin has >2000 counts, and if more than 50% of those come from <1% of pixels, then it is considered to be noise-dominated and hence unusable.
| Quadrant | # 1 sec bins | Bins with >0 counts | Bins with >2000 counts | High rate bins dominated by noise | Noise dominated (total time) | Noise dominated (detector-on time) | Marked lightcurve |
|---|---|---|---|---|---|---|---|
| A | 7448 | 6109 | 1096 | 1096 | 14.72% | 17.94% | 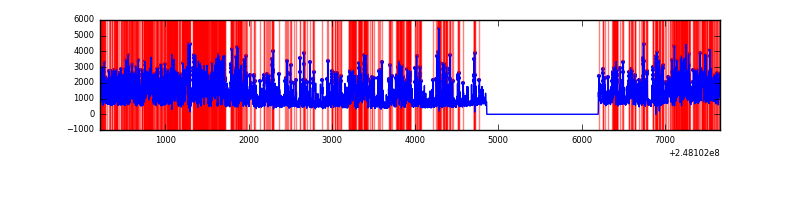 |
| B | 7448 | 6109 | 391 | 391 | 5.25% | 6.40% | 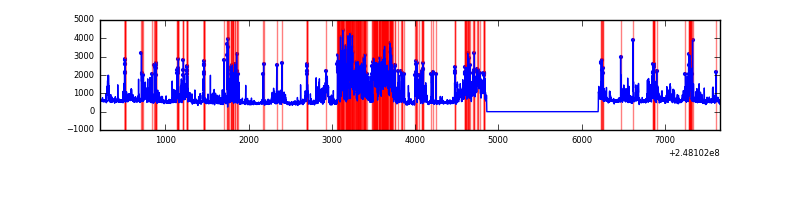 |
| C | 7448 | 6109 | 0 | 0 | 0.00% | 0.00% | 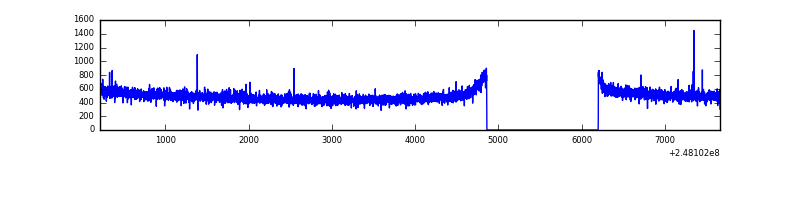 |
| D | 7448 | 6109 | 272 | 272 | 3.65% | 4.45% | 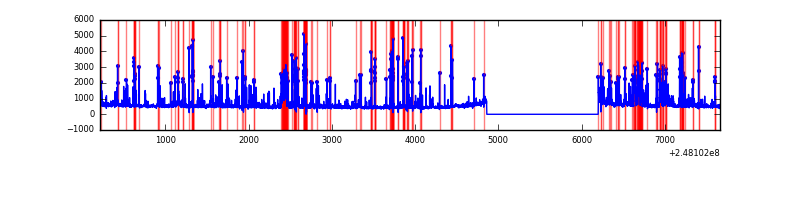 |
Top three noisy pixels from each quadrant. If the there are fewer than three noisy pixels in the level2.evt file, extra rows are filled as -1
| Pixel properties | Quadrant properties | ||||||
|---|---|---|---|---|---|---|---|
| Quadrant | DetID | PixID | Counts | Sigma | Mean | Median | Sigma |
| A | 8 | 5 | 5083587 | 34881.94 | 721 | 707 | 145.7 |
| A | 1 | 162 | 20024 | 132.57 | 721 | 707 | 145.7 |
| A | 15 | 174 | 17383 | 114.44 | 721 | 707 | 145.7 |
| B | 4 | 81 | 1203919 | 8574.7 | 745 | 728 | 140.3 |
| B | 4 | 239 | 786764 | 5601.79 | 745 | 728 | 140.3 |
| B | 3 | 64 | 319778 | 2273.75 | 745 | 728 | 140.3 |
| C | 13 | 61 | 5596 | 27.23 | 765 | 770 | 177.2 |
| C | 0 | 207 | 4703 | 22.19 | 765 | 770 | 177.2 |
| C | 14 | 234 | 3613 | 16.04 | 765 | 770 | 177.2 |
| D | 1 | 52 | 750618 | 4224.45 | 747 | 730 | 177.5 |
| D | 10 | 253 | 211663 | 1188.28 | 747 | 730 | 177.5 |
| D | 2 | 120 | 178886 | 1003.63 | 747 | 730 | 177.5 |
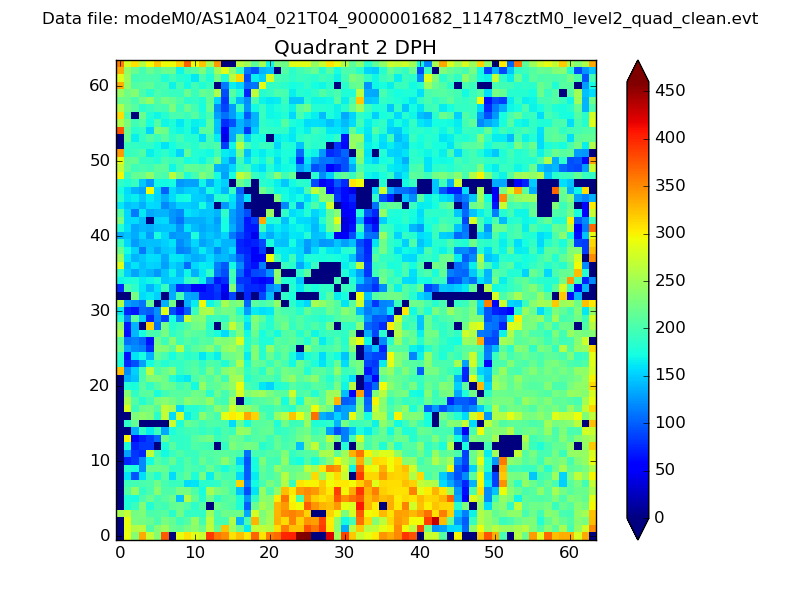
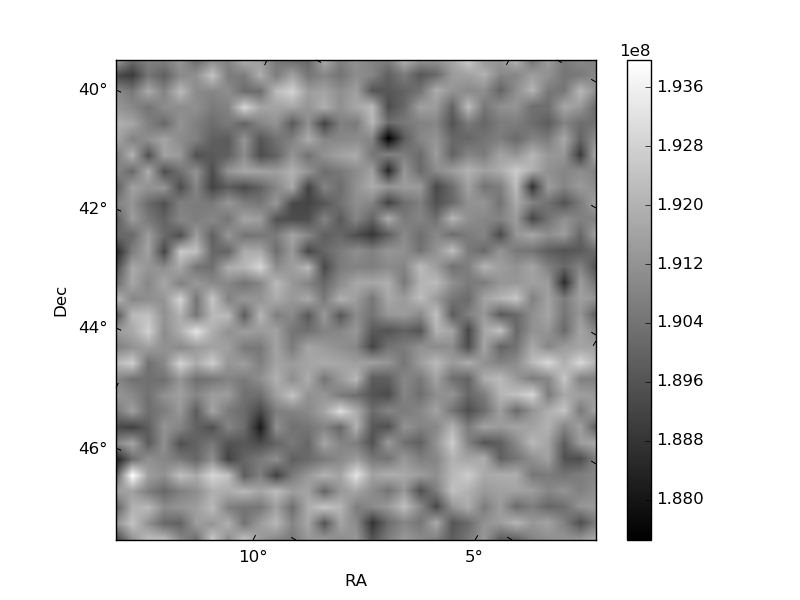
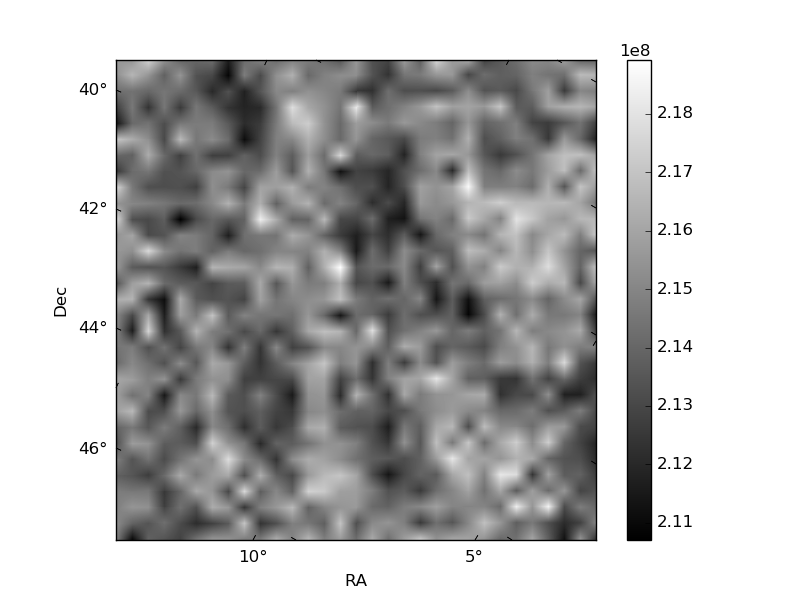
Histogram calculated using DETX and DETY for each event in the final _common_clean file
| Quadrant A | 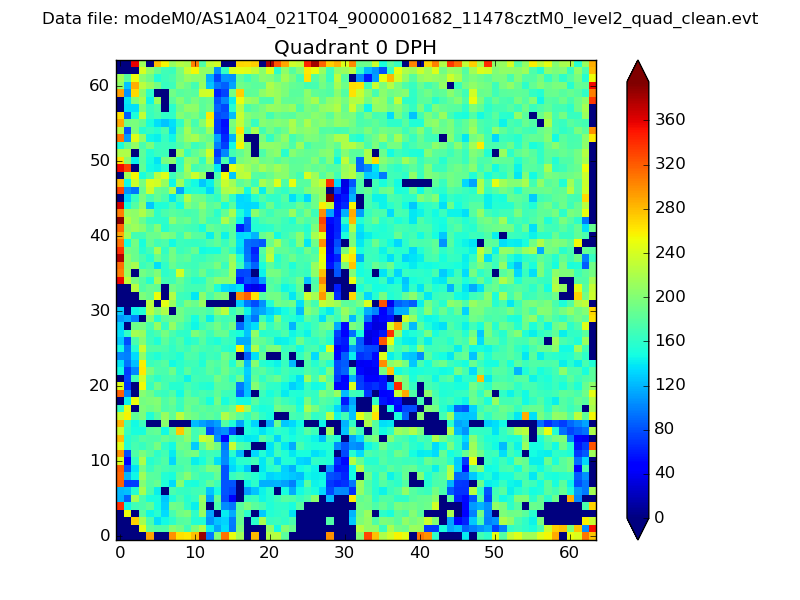 |
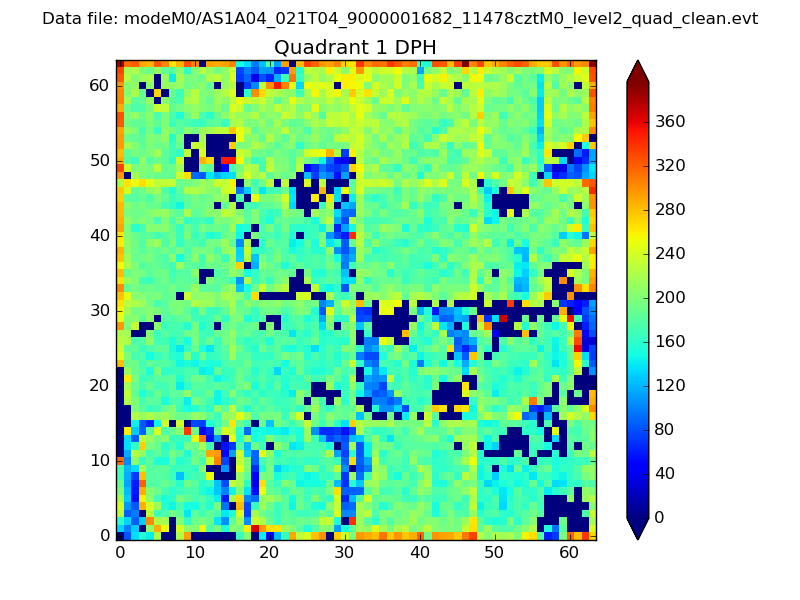 |
Quadrant B |
|---|---|---|---|
| Quadrant D | 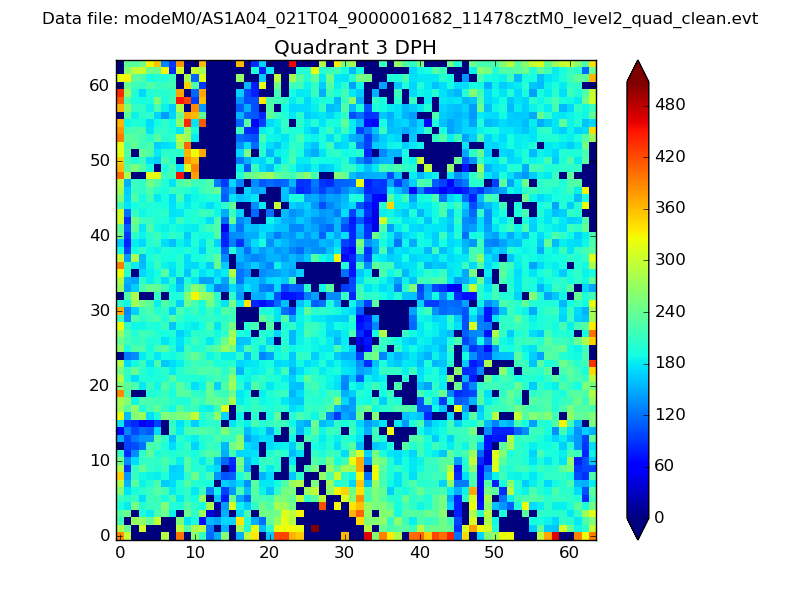 |
 |
Quadrant C |
| Plot type | Count rate plots | Images |
|---|---|---|
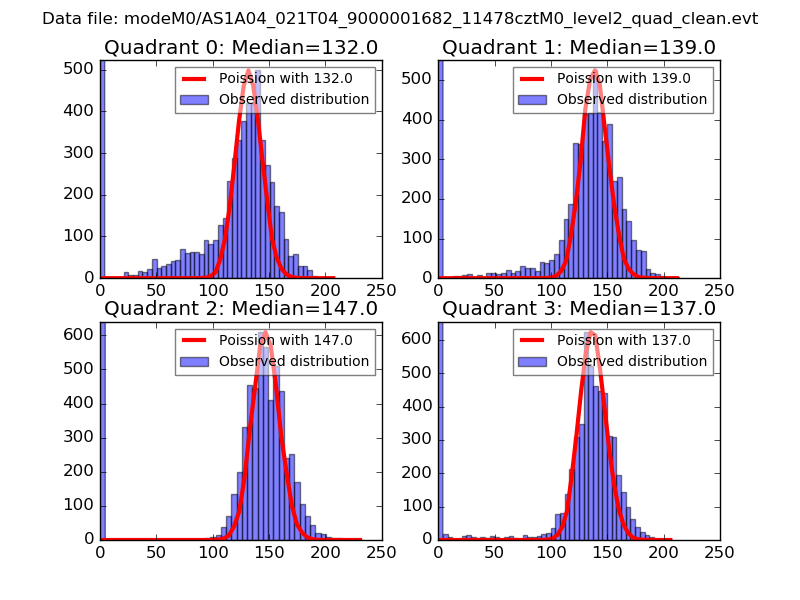
| Comparison with Poisson distribution Blue bars denote a histogram of data divided into 1 sec bins. Red curve is a Poisson curve with rate = median count rate of data. |
 |
 |
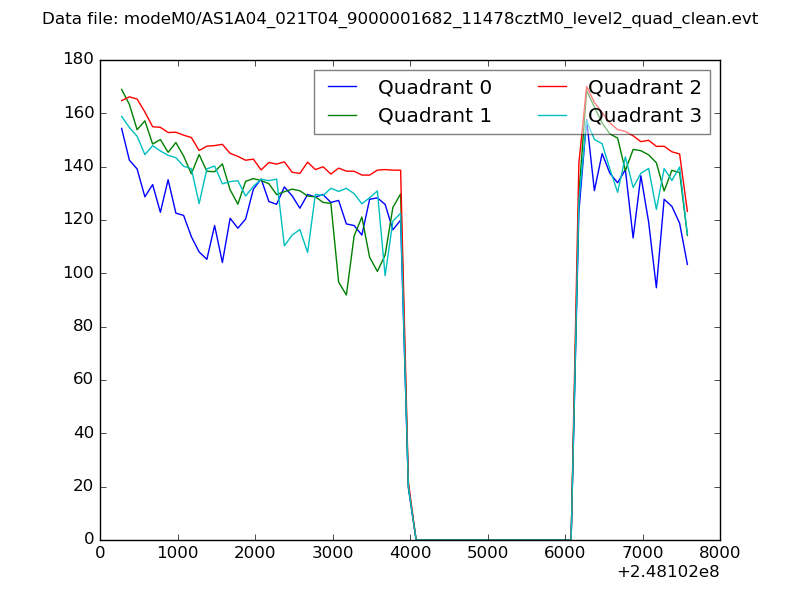
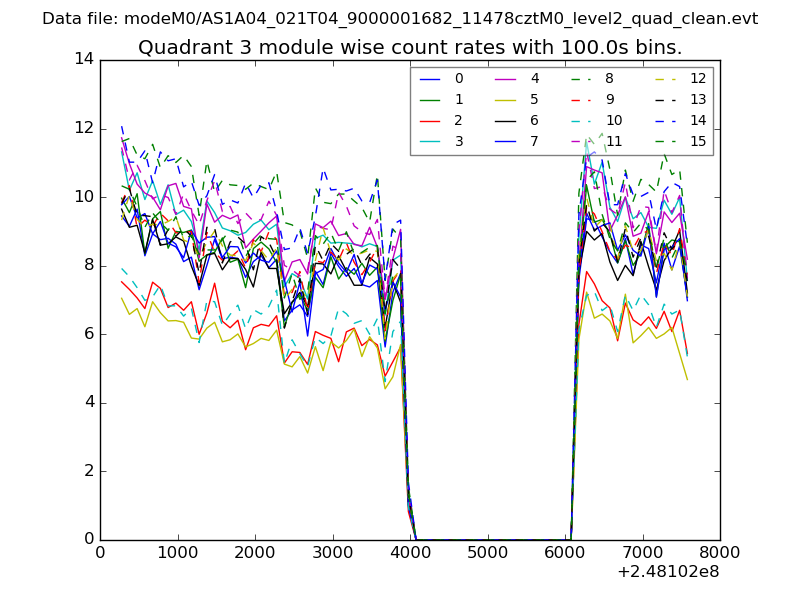
| Quadrant-wise count rates Data is divided into 100 sec bins |
 |
|
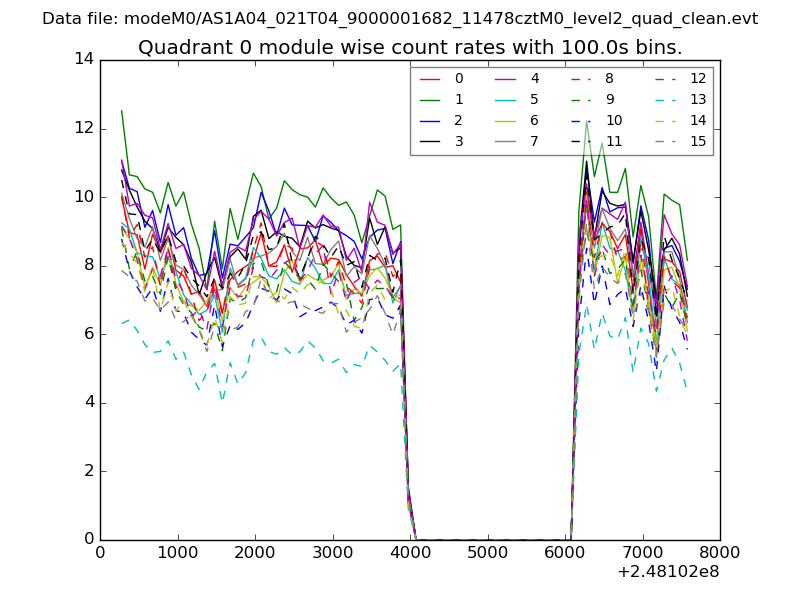
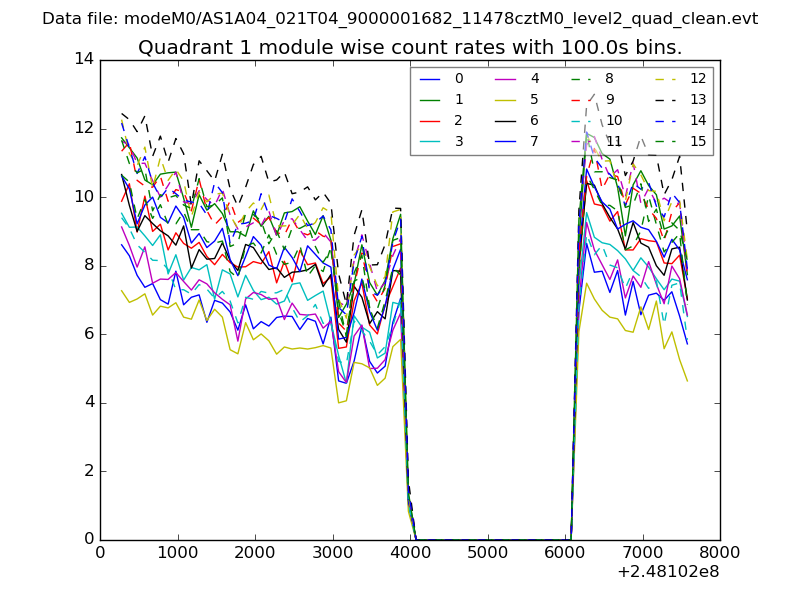
| Module-wise count rates for Quadrant A Data is divided into 100 sec bins |
 |
 |
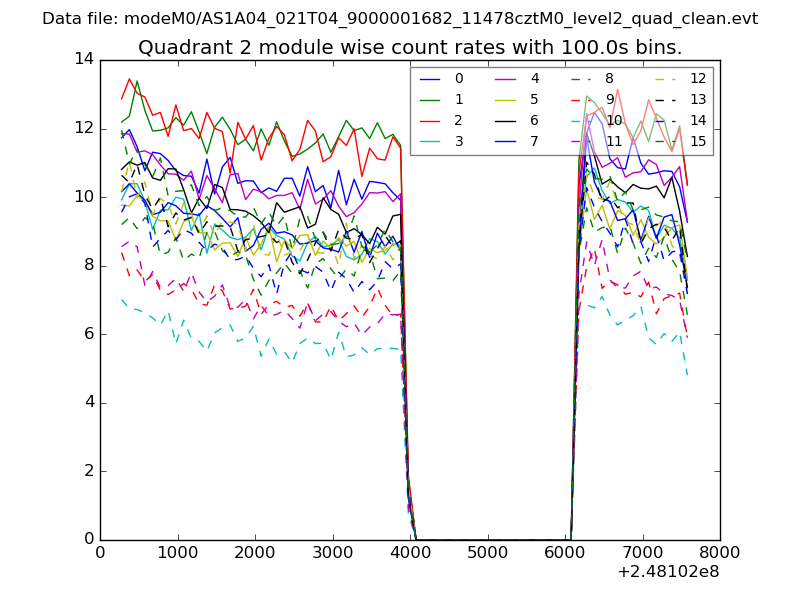
| Module-wise count rates for Quadrant B Data is divided into 100 sec bins |
 |
 |
| Module-wise count rates for Quadrant C Data is divided into 100 sec bins |
 |
 |
| Module-wise count rates for Quadrant D Data is divided into 100 sec bins |
 |
 |
| Parameter | Plot |
|---|---|
| CZT HV Monitor | 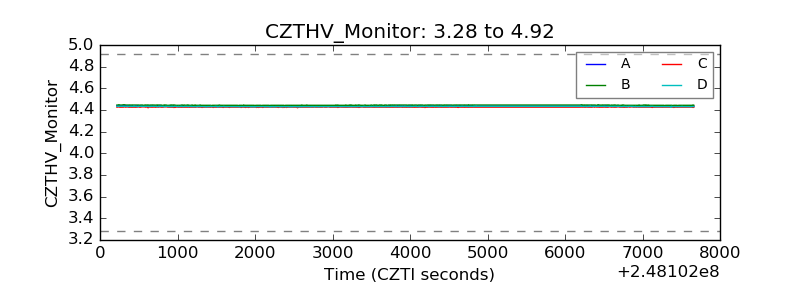 |
| D_VDD | 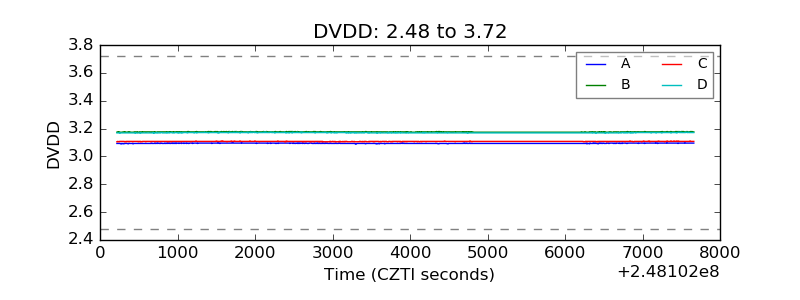 |
| Temperature 1 |  |
| Veto HV Monitor | 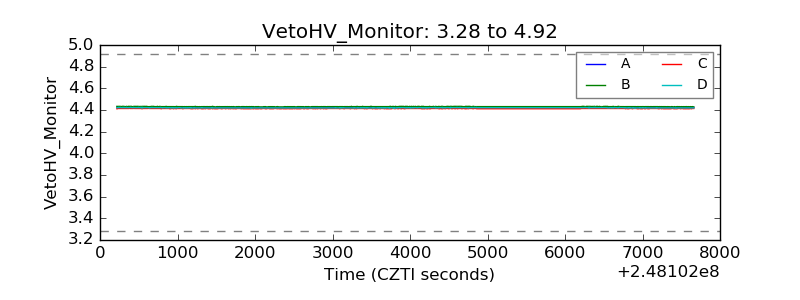 |
| Veto LLD | 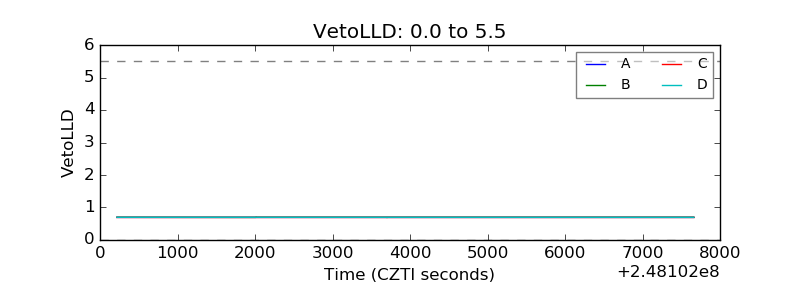 |
| Alpha Counter | 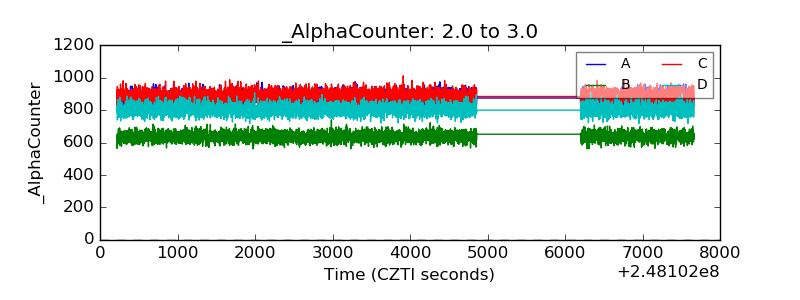 |
| _CPM_Rate | 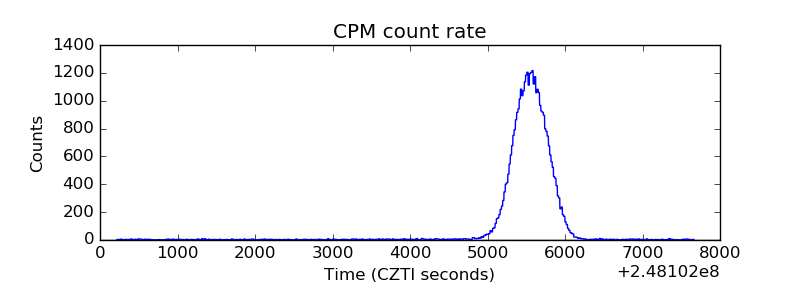 |
| CZT Counter | 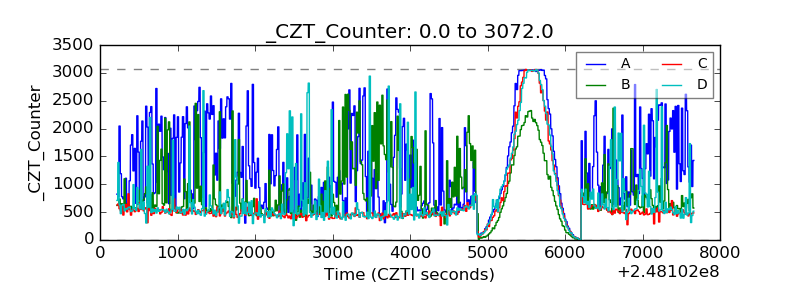 |
| +2.5 Volts monitor |  |
| +5 Volts monitor |  |
| _ROLL_ROT | 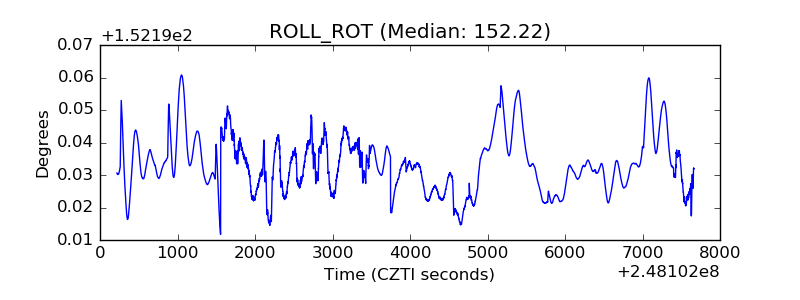 |
| _Roll_DEC | 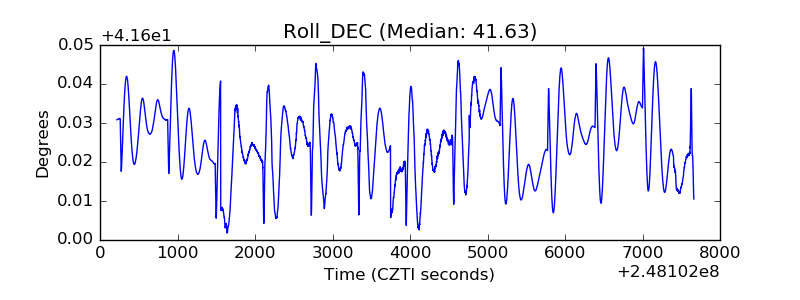 |
| _Roll_RA | 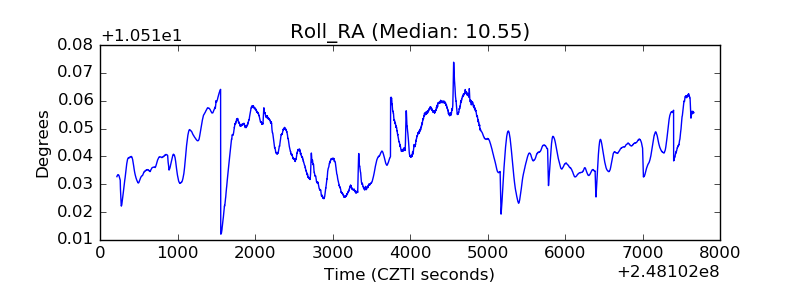 |
| Veto Counter | 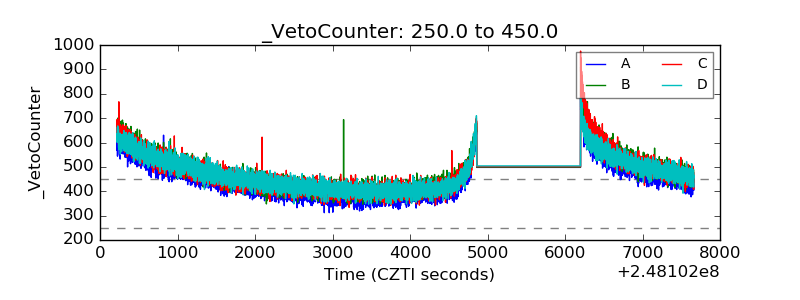 |