| Param | Original file | Final file |
|---|---|---|
| Filename | modeM0/AS1A04_021T04_9000001682_11479cztM0_level2.evt | modeM0/AS1A04_021T04_9000001682_11479cztM0_level2_quad_clean.evt |
| Size (bytes) | 704,488,320 | 100,471,680 |
| Size | 671.9 MB | 95.8 MB |
| Events in quadrant A | 6,902,964 | 615,626 |
| Events in quadrant B | 6,688,251 | 614,518 |
| Events in quadrant C | 3,063,502 | 709,402 |
| Events in quadrant D | 4,249,196 | 656,802 |
| Mode M0 | |||
|---|---|---|---|
| Quadrant | BADHDUFLAG | Total packets | Discarded packets |
| A | 0 | 24963 | 2 |
| B | 0 | 24388 | 1 |
| C | 0 | 13166 | 1 |
| D | 0 | 16912 | 1 |
| Mode SS | |||
|---|---|---|---|
| Quadrant | BADHDUFLAG | Total packets | Discarded packets |
| A | 0 | 130 | 0 |
| B | 0 | 130 | 0 |
| C | 0 | 130 | 0 |
| D | 0 | 130 | 0 |
| Mode M9 | |||
|---|---|---|---|
| Quadrant | BADHDUFLAG | Total packets | Discarded packets |
| A | 0 | 12 | 0 |
| B | 0 | 12 | 0 |
| C | 0 | 12 | 0 |
| D | 0 | 12 | 0 |
| Quadrant | Total seconds | Saturated seconds | Saturation percentage |
|---|---|---|---|
| A | 6386 | 1059 | 16.583151% |
| B | 6386 | 1194 | 18.697150% |
| C | 6386 | 95 | 1.487629% |
| D | 6386 | 337 | 5.277169% |
Noise dominated data is calculated using 1-second bins in cleaned event files. If a bin has >2000 counts, and if more than 50% of those come from <1% of pixels, then it is considered to be noise-dominated and hence unusable.
| Quadrant | # 1 sec bins | Bins with >0 counts | Bins with >2000 counts | High rate bins dominated by noise | Noise dominated (total time) | Noise dominated (detector-on time) | Marked lightcurve |
|---|---|---|---|---|---|---|---|
| A | 7572 | 6388 | 635 | 635 | 8.39% | 9.94% | 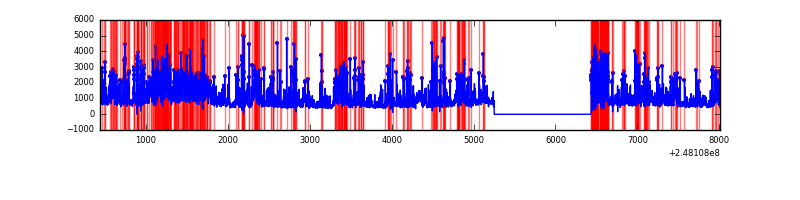 |
| B | 7572 | 6388 | 802 | 802 | 10.59% | 12.55% | 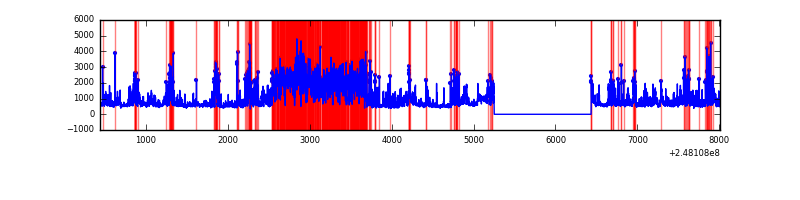 |
| C | 7572 | 6388 | 0 | 0 | 0.00% | 0.00% |  |
| D | 7572 | 6388 | 202 | 202 | 2.67% | 3.16% | 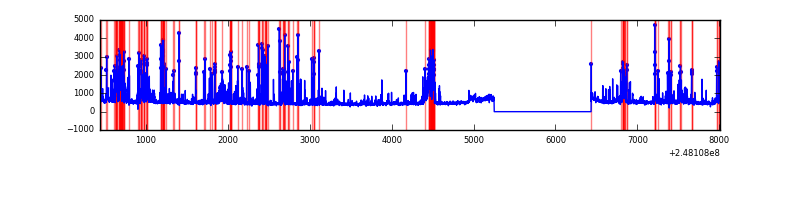 |
Top three noisy pixels from each quadrant. If the there are fewer than three noisy pixels in the level2.evt file, extra rows are filled as -1
| Pixel properties | Quadrant properties | ||||||
|---|---|---|---|---|---|---|---|
| Quadrant | DetID | PixID | Counts | Sigma | Mean | Median | Sigma |
| A | 8 | 5 | 3949860 | 26421.97 | 741 | 725 | 149.5 |
| A | 1 | 162 | 18779 | 120.79 | 741 | 725 | 149.5 |
| A | 9 | 143 | 18490 | 118.86 | 741 | 725 | 149.5 |
| B | 4 | 81 | 2426623 | 17447.34 | 737 | 722 | 139.0 |
| B | 4 | 239 | 649078 | 4663.05 | 737 | 722 | 139.0 |
| B | 3 | 64 | 324263 | 2326.94 | 737 | 722 | 139.0 |
| C | 13 | 61 | 5676 | 26.98 | 784 | 788 | 181.2 |
| C | 0 | 207 | 5289 | 24.84 | 784 | 788 | 181.2 |
| C | 3 | 202 | 1960 | 6.47 | 784 | 788 | 181.2 |
| D | 1 | 52 | 589191 | 3220.51 | 773 | 753 | 182.7 |
| D | 13 | 104 | 331951 | 1812.64 | 773 | 753 | 182.7 |
| D | 2 | 120 | 210950 | 1150.41 | 773 | 753 | 182.7 |
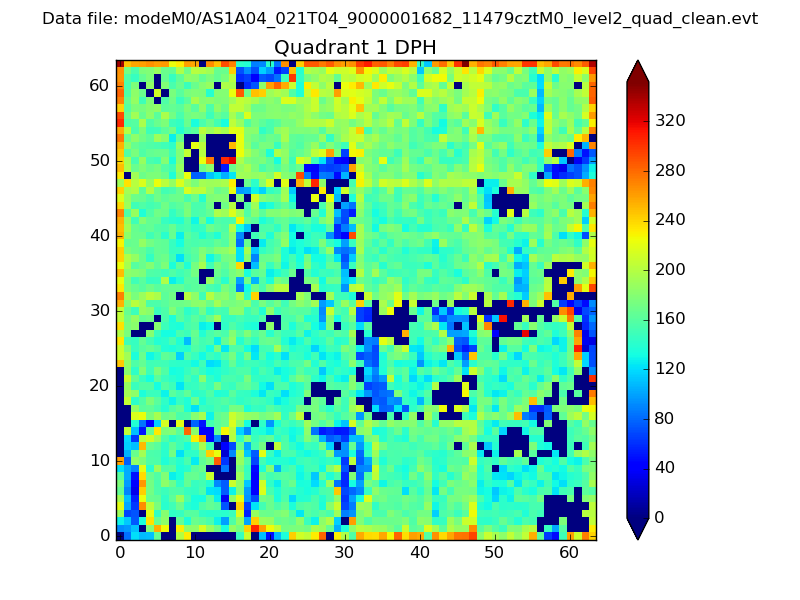
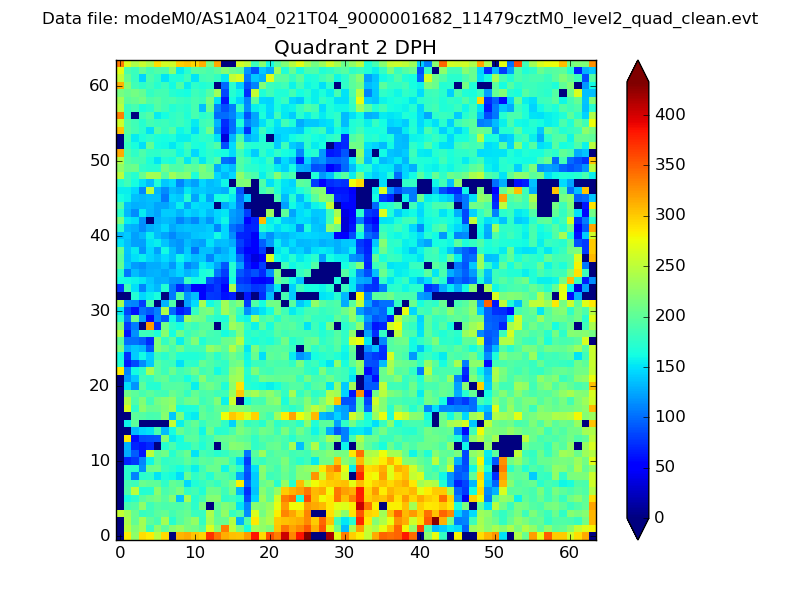
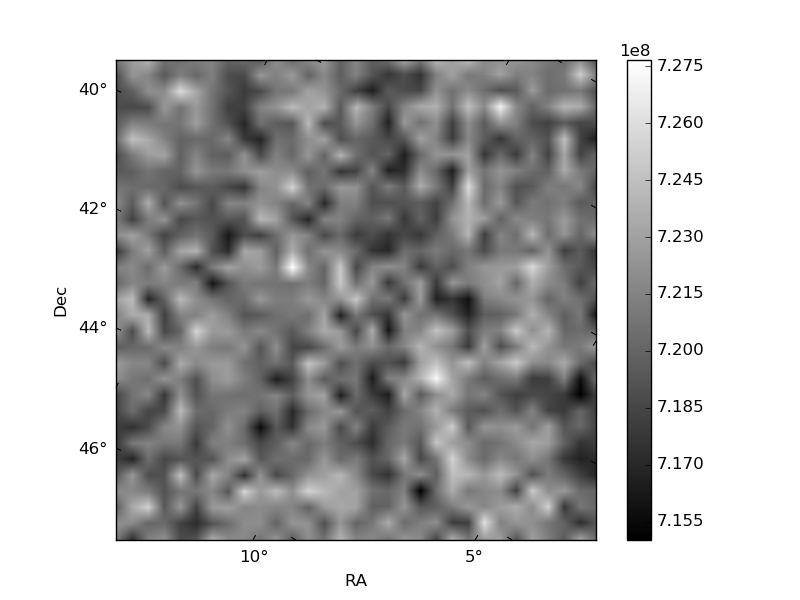
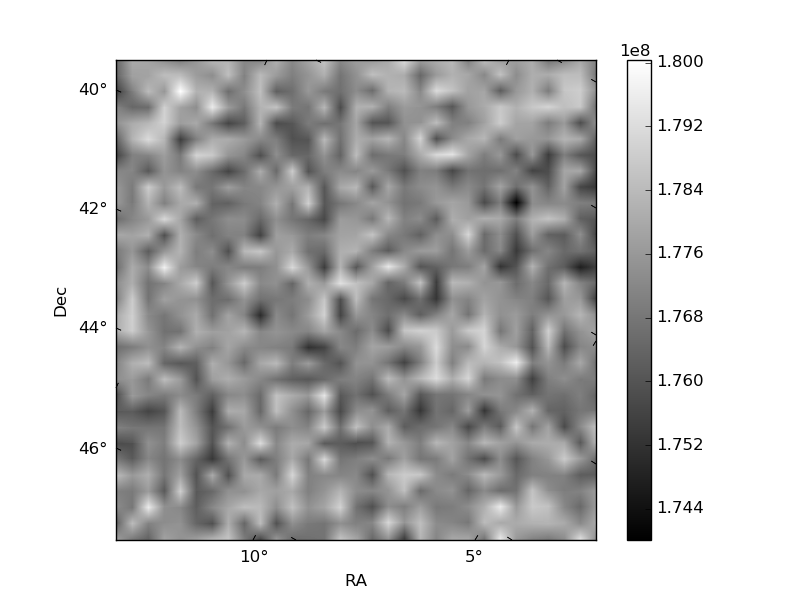
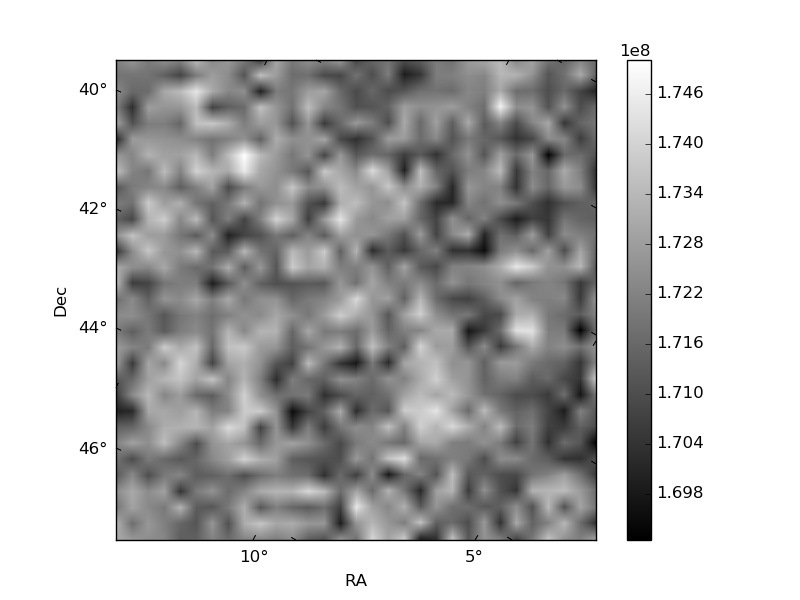
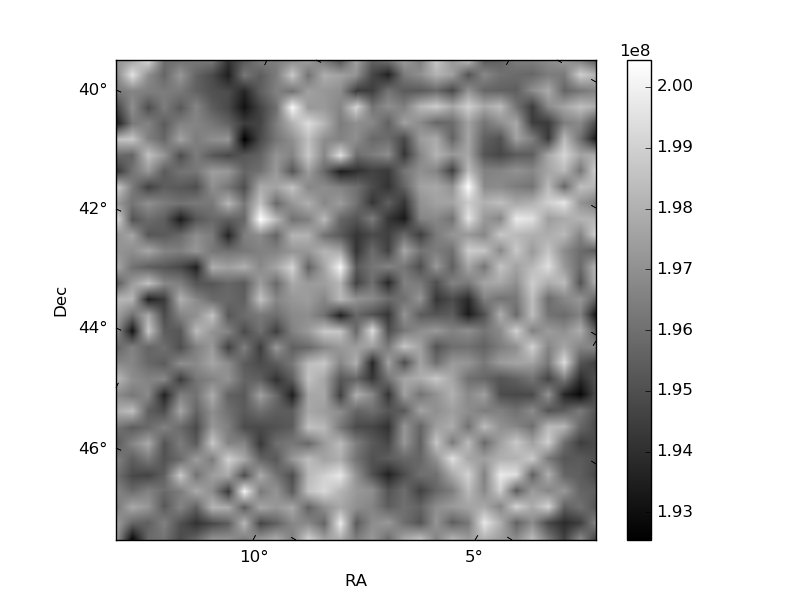
Histogram calculated using DETX and DETY for each event in the final _common_clean file
| Quadrant A | 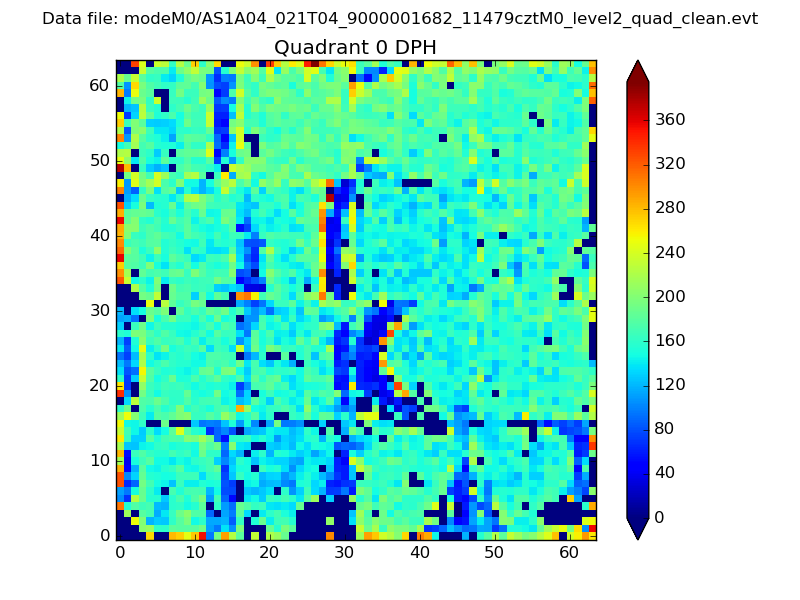 |
 |
Quadrant B |
|---|---|---|---|
| Quadrant D | 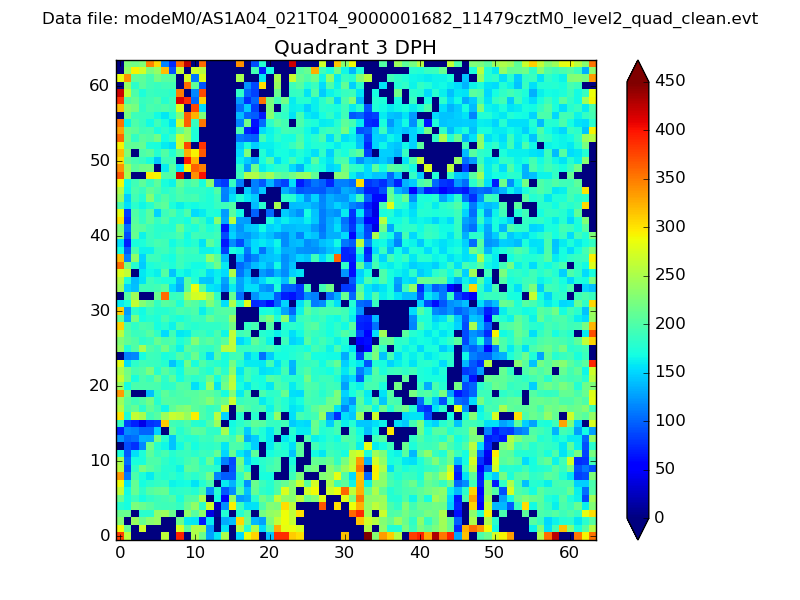 |
 |
Quadrant C |
| Plot type | Count rate plots | Images |
|---|---|---|
| Comparison with Poisson distribution Blue bars denote a histogram of data divided into 1 sec bins. Red curve is a Poisson curve with rate = median count rate of data. |
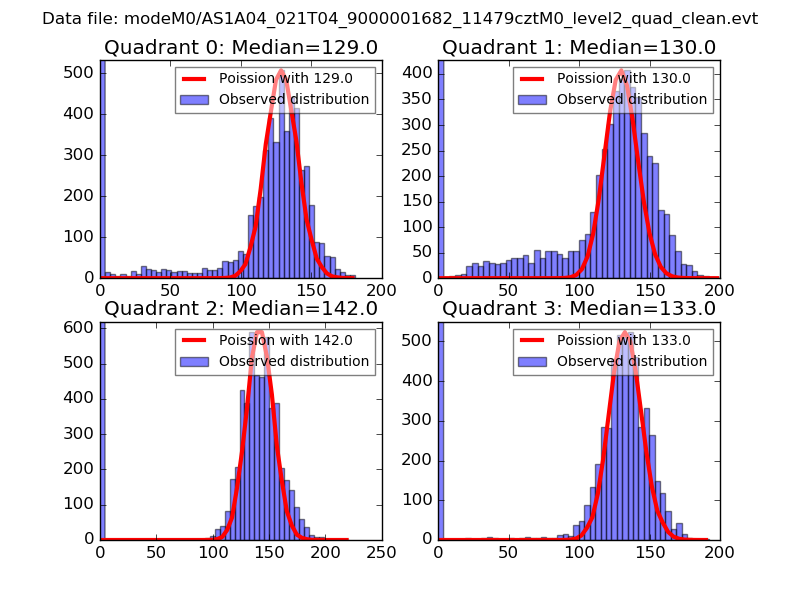 |
 |
| Quadrant-wise count rates Data is divided into 100 sec bins |
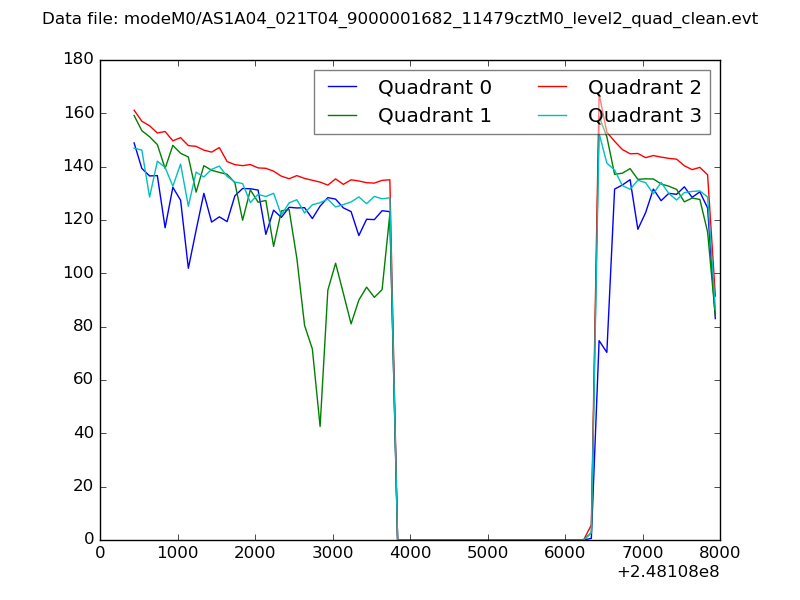 |
|
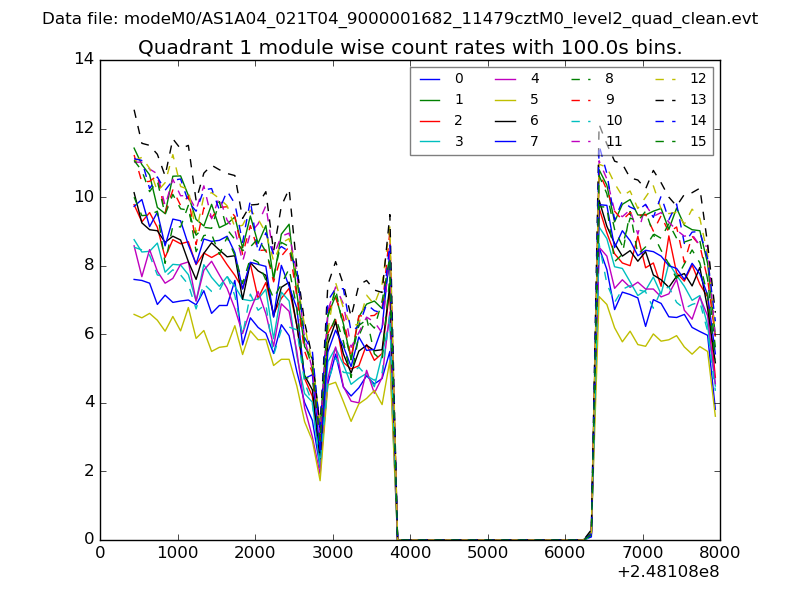
| Module-wise count rates for Quadrant A Data is divided into 100 sec bins |
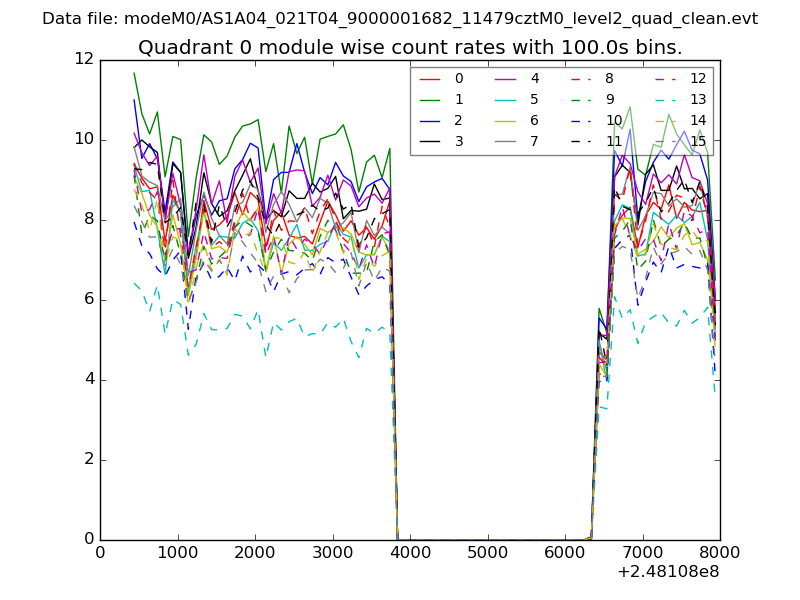 |
 |
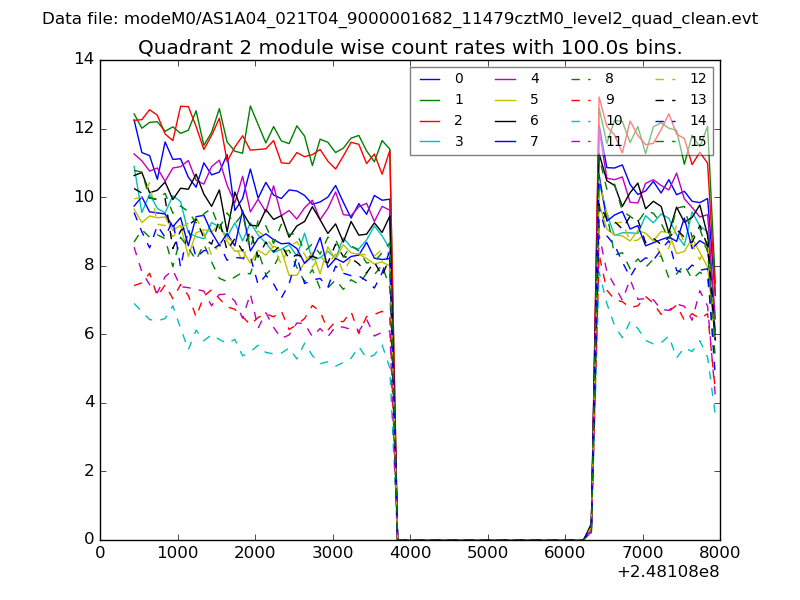
| Module-wise count rates for Quadrant B Data is divided into 100 sec bins |
 |
 |
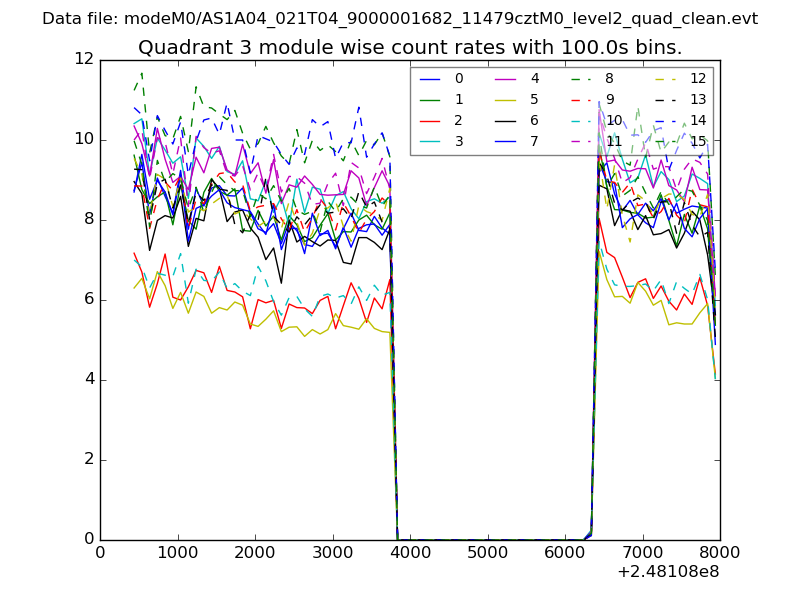
| Module-wise count rates for Quadrant C Data is divided into 100 sec bins |
 |
 |
| Module-wise count rates for Quadrant D Data is divided into 100 sec bins |
 |
 |
| Parameter | Plot |
|---|---|
| CZT HV Monitor | 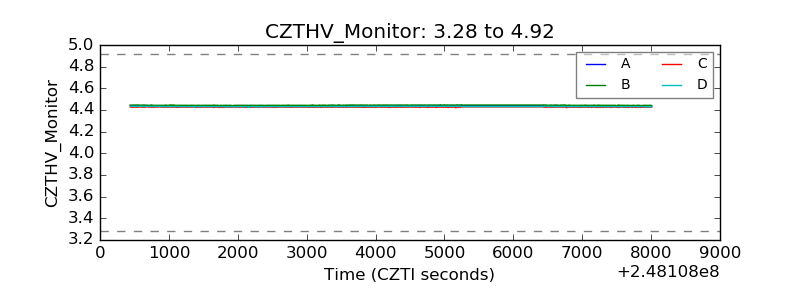 |
| D_VDD | 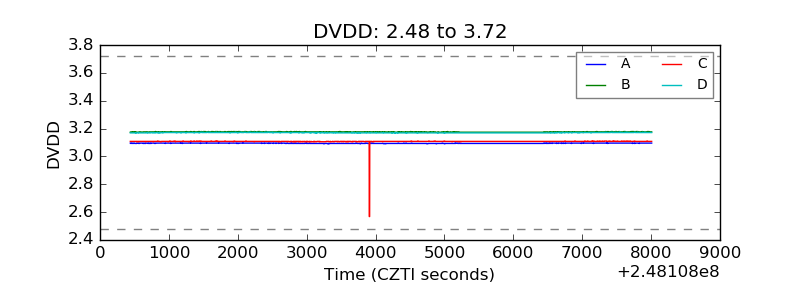 |
| Temperature 1 | 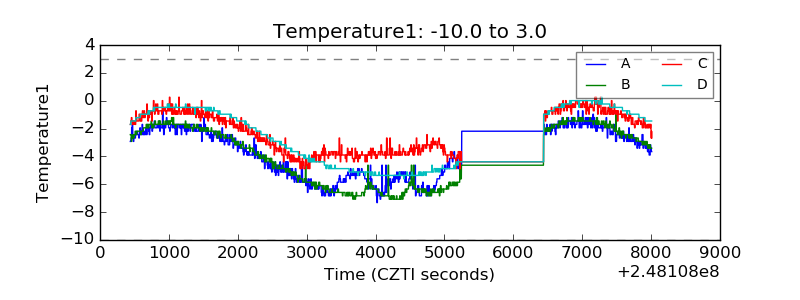 |
| Veto HV Monitor | 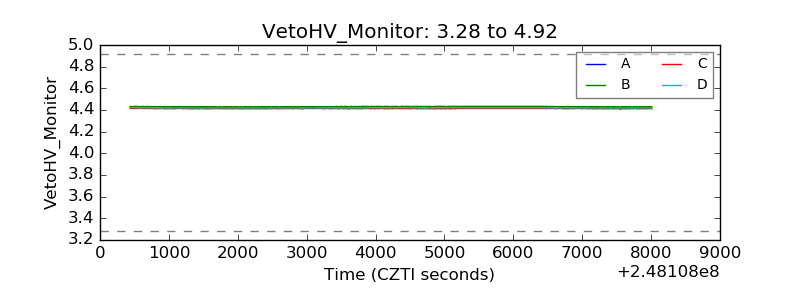 |
| Veto LLD | 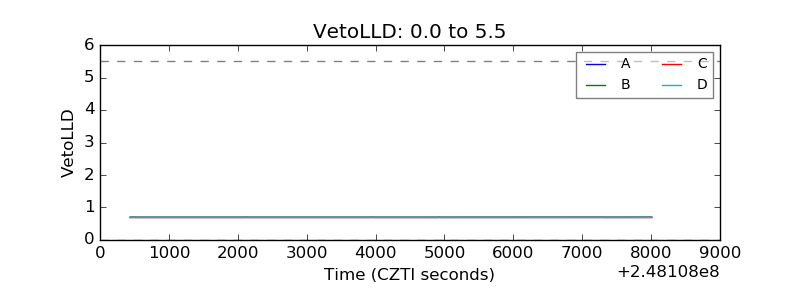 |
| Alpha Counter | 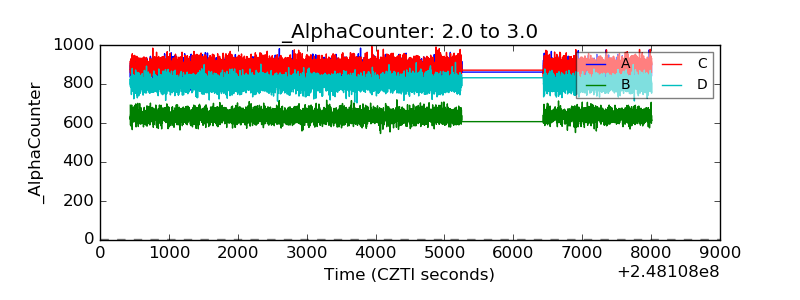 |
| _CPM_Rate | 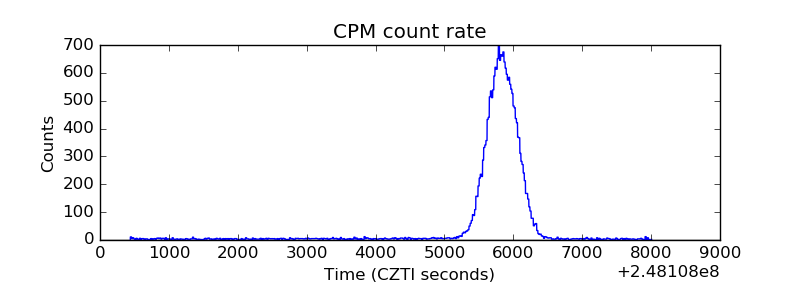 |
| CZT Counter | 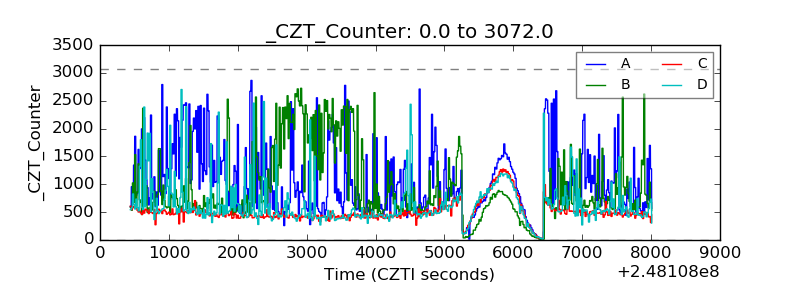 |
| +2.5 Volts monitor |  |
| +5 Volts monitor |  |
| _ROLL_ROT | 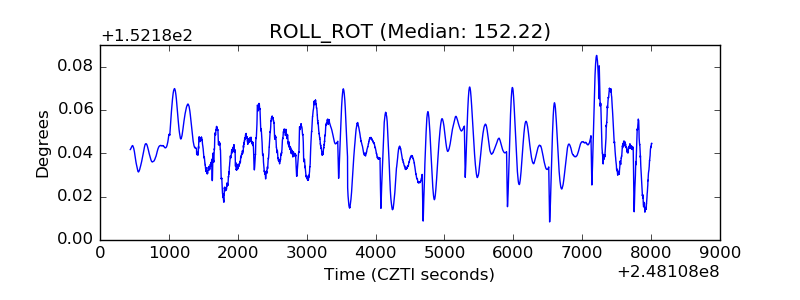 |
| _Roll_DEC | 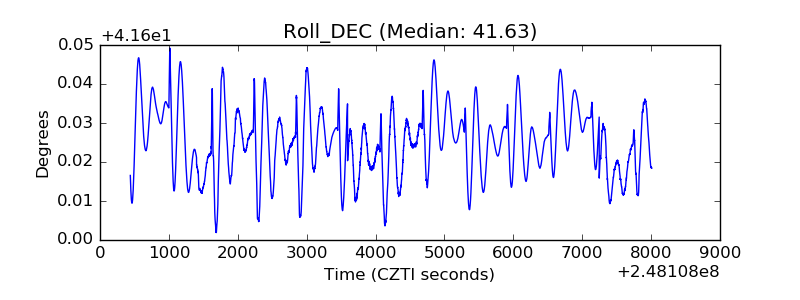 |
| _Roll_RA | 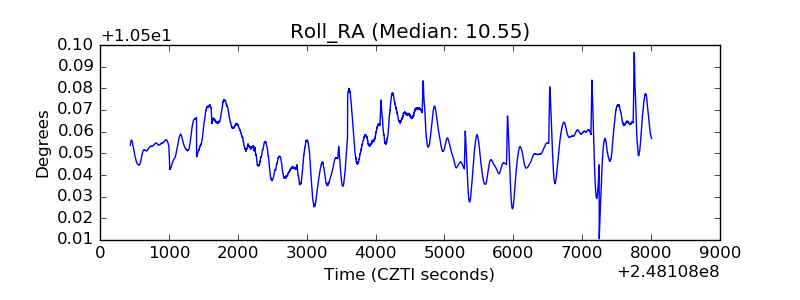 |
| Veto Counter | 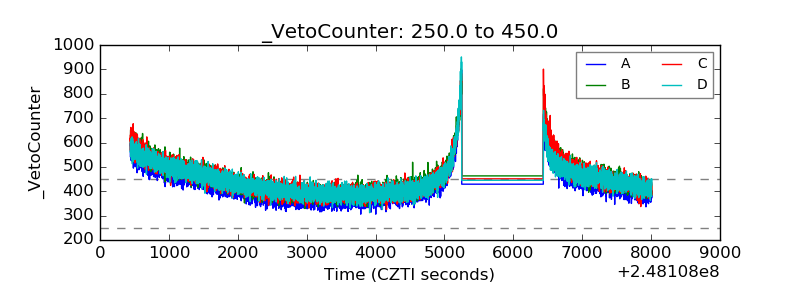 |