| Param | Original file | Final file |
|---|---|---|
| Filename | modeM0/AS1A04_021T04_9000001682_11481cztM0_level2.evt | modeM0/AS1A04_021T04_9000001682_11481cztM0_level2_quad_clean.evt |
| Size (bytes) | 201,807,360 | 37,402,560 |
| Size | 192.5 MB | 35.7 MB |
| Events in quadrant A | 2,177,137 | 235,207 |
| Events in quadrant B | 1,423,946 | 242,274 |
| Events in quadrant C | 943,844 | 265,961 |
| Events in quadrant D | 1,430,205 | 244,432 |
| Mode M0 | |||
|---|---|---|---|
| Quadrant | BADHDUFLAG | Total packets | Discarded packets |
| A | 0 | 7875 | 1 |
| B | 0 | 5572 | 1 |
| C | 0 | 4100 | 1 |
| D | 0 | 5567 | 1 |
| Mode SS | |||
|---|---|---|---|
| Quadrant | BADHDUFLAG | Total packets | Discarded packets |
| A | 0 | 40 | 0 |
| B | 0 | 40 | 0 |
| C | 0 | 40 | 0 |
| D | 0 | 40 | 0 |
| Mode M9 | |||
|---|---|---|---|
| Quadrant | BADHDUFLAG | Total packets | Discarded packets |
| A | 0 | 6 | 0 |
| B | 0 | 6 | 0 |
| C | 0 | 6 | 0 |
| D | 0 | 7 | 0 |
| Quadrant | Total seconds | Saturated seconds | Saturation percentage |
|---|---|---|---|
| A | 1982 | 270 | 13.622603% |
| B | 1982 | 117 | 5.903128% |
| C | 1982 | 3 | 0.151362% |
| D | 1982 | 91 | 4.591322% |
Noise dominated data is calculated using 1-second bins in cleaned event files. If a bin has >2000 counts, and if more than 50% of those come from <1% of pixels, then it is considered to be noise-dominated and hence unusable.
| Quadrant | # 1 sec bins | Bins with >0 counts | Bins with >2000 counts | High rate bins dominated by noise | Noise dominated (total time) | Noise dominated (detector-on time) | Marked lightcurve |
|---|---|---|---|---|---|---|---|
| A | 1983 | 1983 | 159 | 159 | 8.02% | 8.02% | 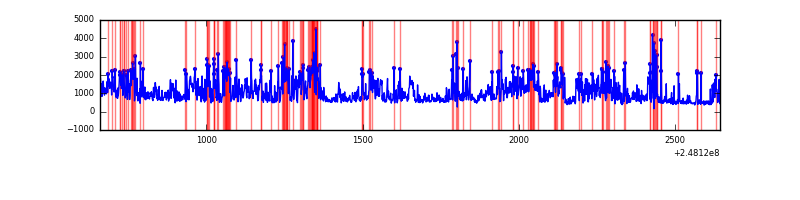 |
| B | 1983 | 1983 | 75 | 75 | 3.78% | 3.78% | 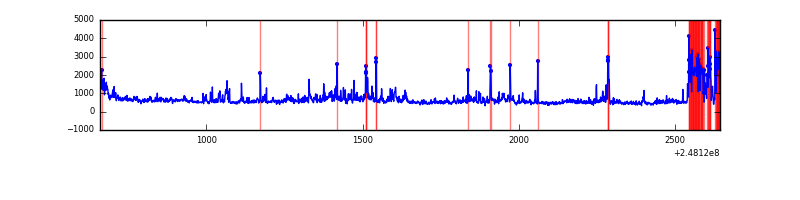 |
| C | 1983 | 1983 | 2 | 2 | 0.10% | 0.10% | 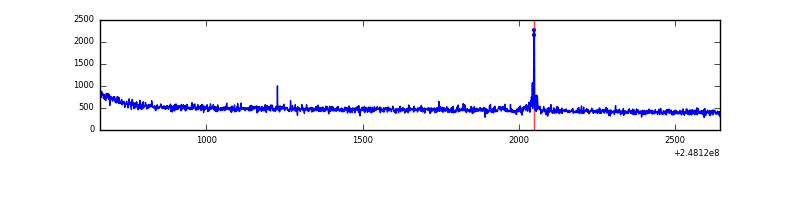 |
| D | 1983 | 1983 | 58 | 58 | 2.92% | 2.92% | 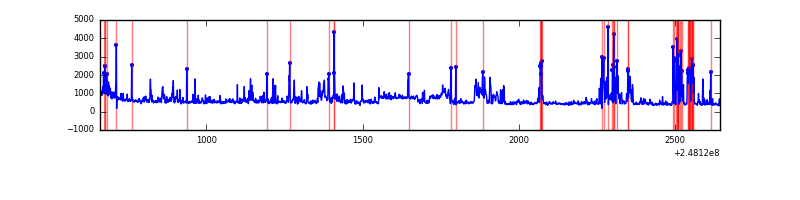 |
Top three noisy pixels from each quadrant. If the there are fewer than three noisy pixels in the level2.evt file, extra rows are filled as -1
| Pixel properties | Quadrant properties | ||||||
|---|---|---|---|---|---|---|---|
| Quadrant | DetID | PixID | Counts | Sigma | Mean | Median | Sigma |
| A | 8 | 5 | 1266713 | 26257.84 | 226 | 221 | 48.2 |
| A | 9 | 143 | 12842 | 261.67 | 226 | 221 | 48.2 |
| A | 1 | 162 | 5897 | 117.68 | 226 | 221 | 48.2 |
| B | 4 | 81 | 183951 | 4110.23 | 228 | 223 | 44.7 |
| B | 15 | 204 | 116718 | 2606.14 | 228 | 223 | 44.7 |
| B | 4 | 239 | 113515 | 2534.49 | 228 | 223 | 44.7 |
| C | 3 | 9 | 11392 | 194.45 | 237 | 239 | 57.4 |
| C | 8 | 128 | 3757 | 61.34 | 237 | 239 | 57.4 |
| C | 8 | 112 | 2293 | 35.81 | 237 | 239 | 57.4 |
| D | 1 | 52 | 351683 | 6099.93 | 233 | 227 | 57.6 |
| D | 13 | 172 | 49886 | 861.89 | 233 | 227 | 57.6 |
| D | 2 | 120 | 43502 | 751.09 | 233 | 227 | 57.6 |
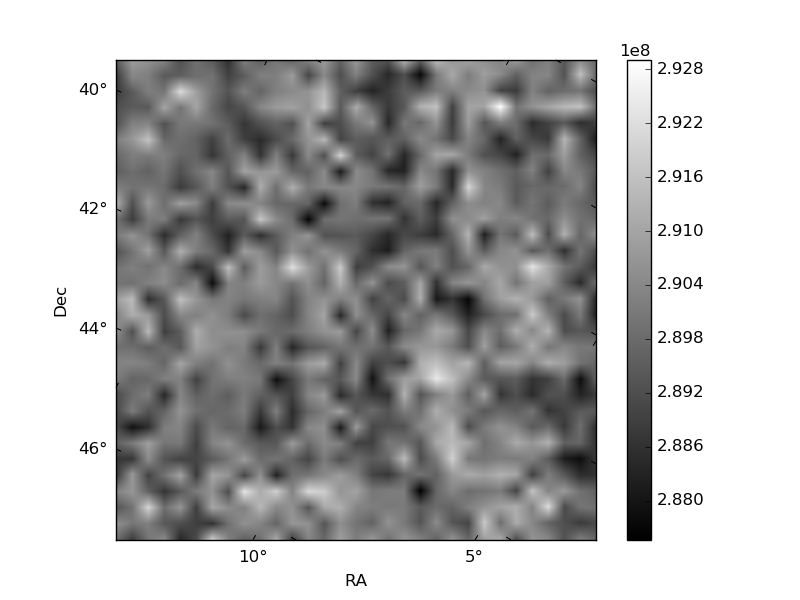
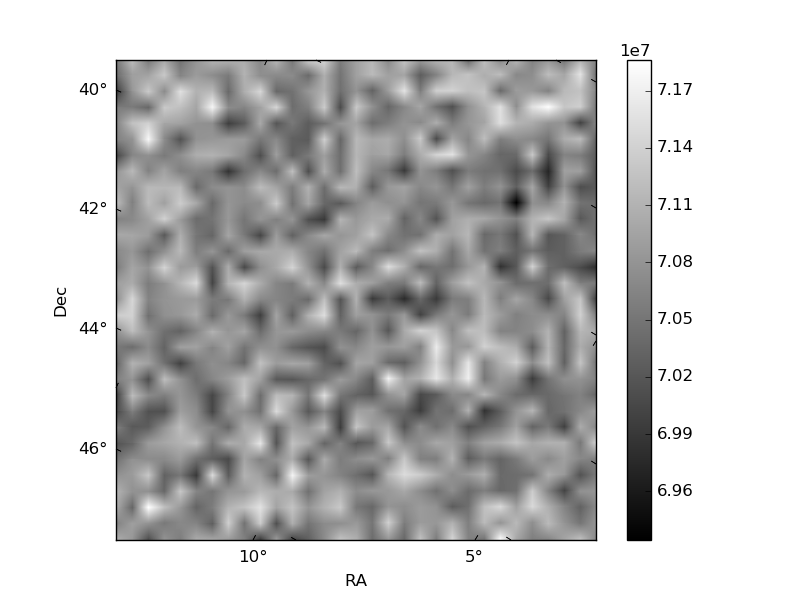
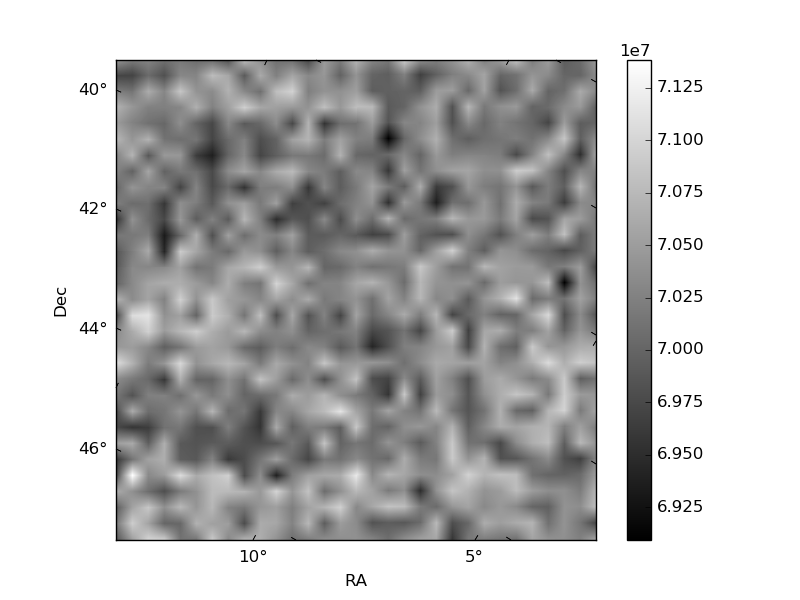
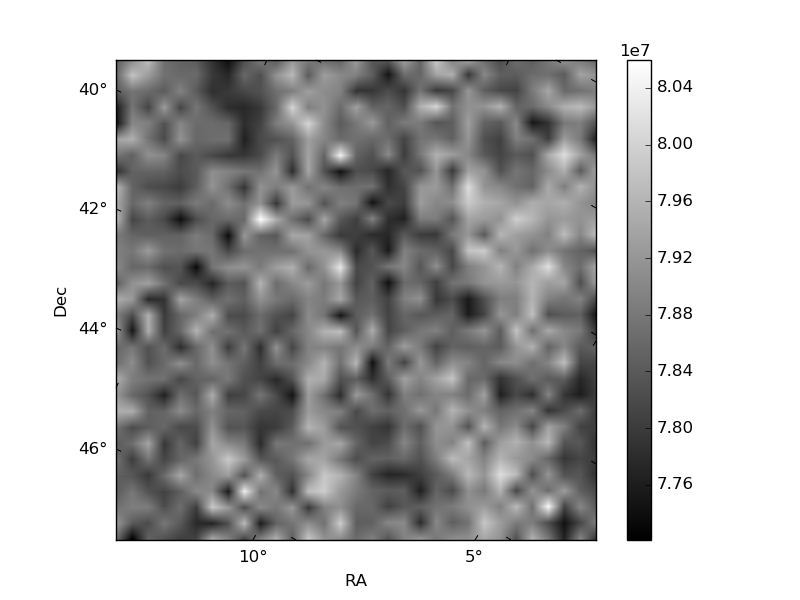
Histogram calculated using DETX and DETY for each event in the final _common_clean file
| Quadrant A | 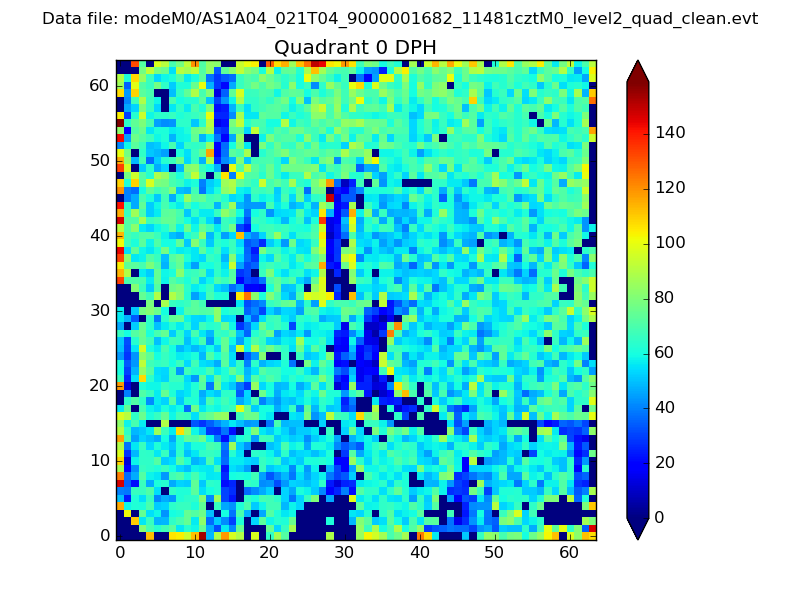 |
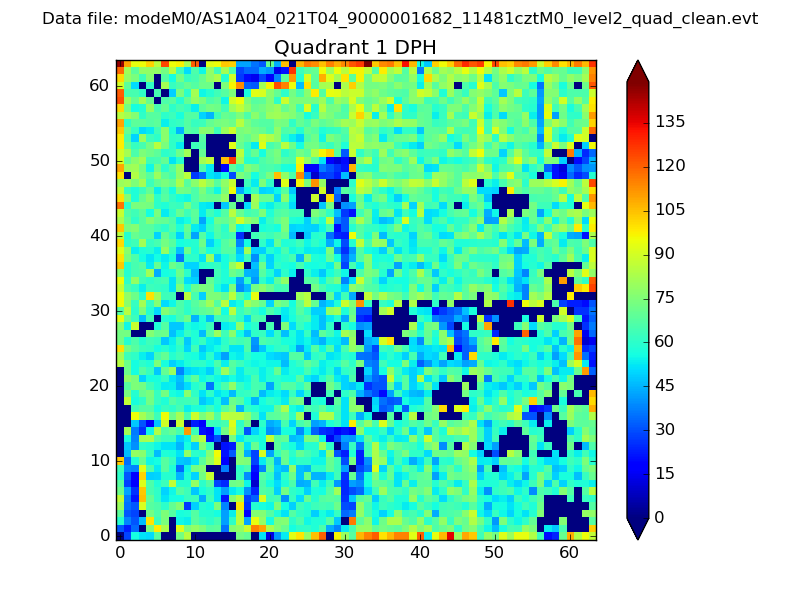 |
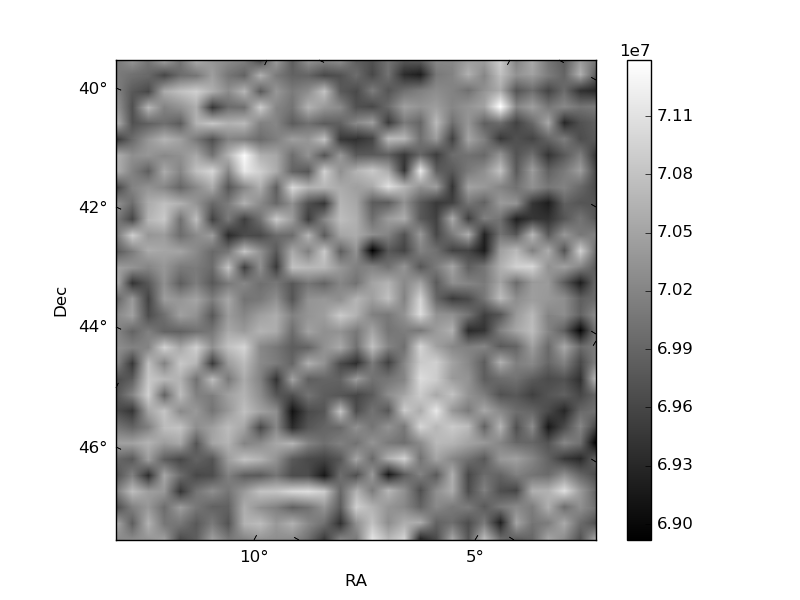
Quadrant B |
|---|---|---|---|
| Quadrant D | 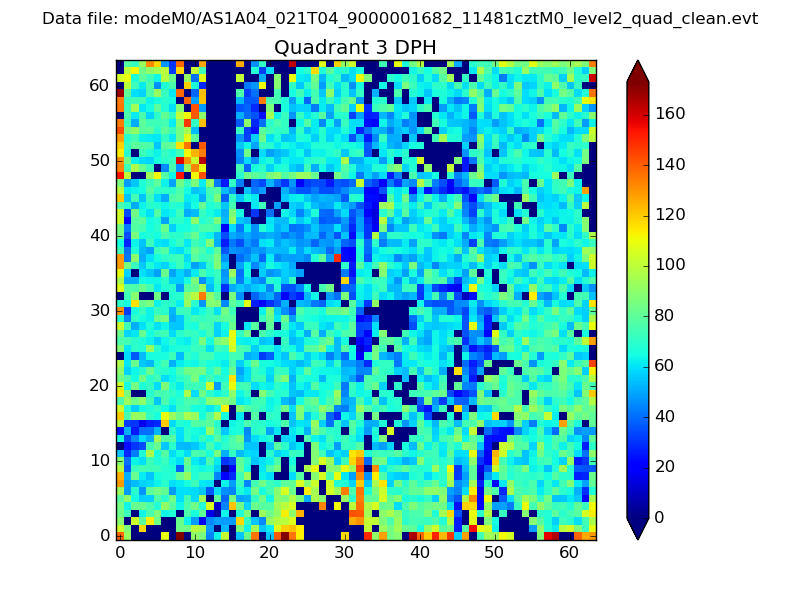 |
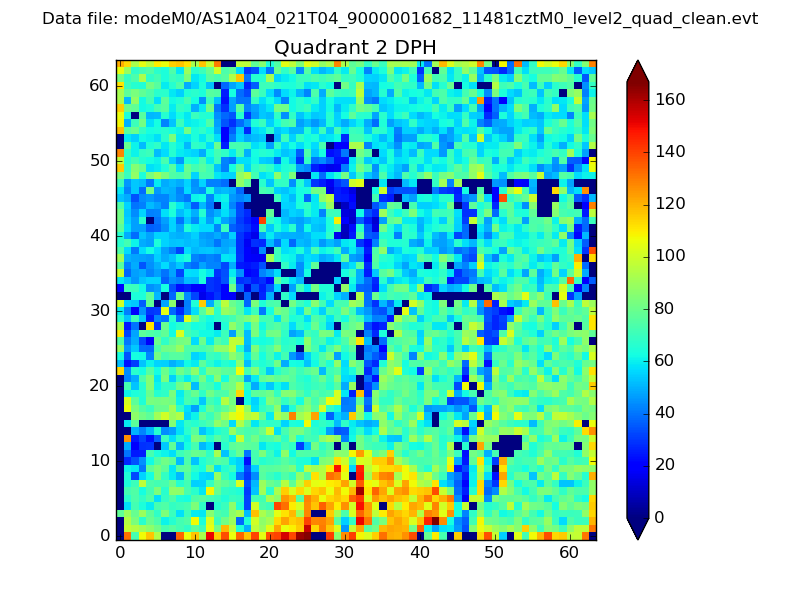 |
Quadrant C |
| Plot type | Count rate plots | Images |
|---|---|---|
| Comparison with Poisson distribution Blue bars denote a histogram of data divided into 1 sec bins. Red curve is a Poisson curve with rate = median count rate of data. |
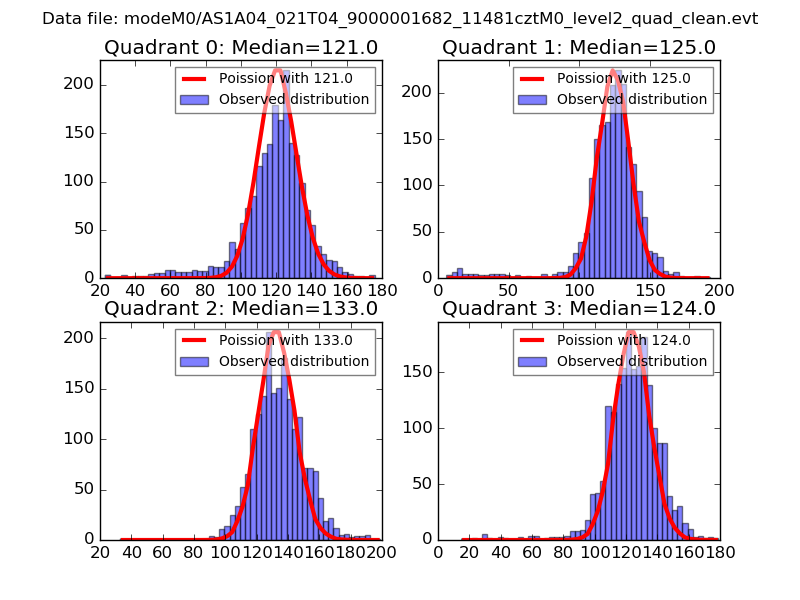 |
 |
| Quadrant-wise count rates Data is divided into 100 sec bins |
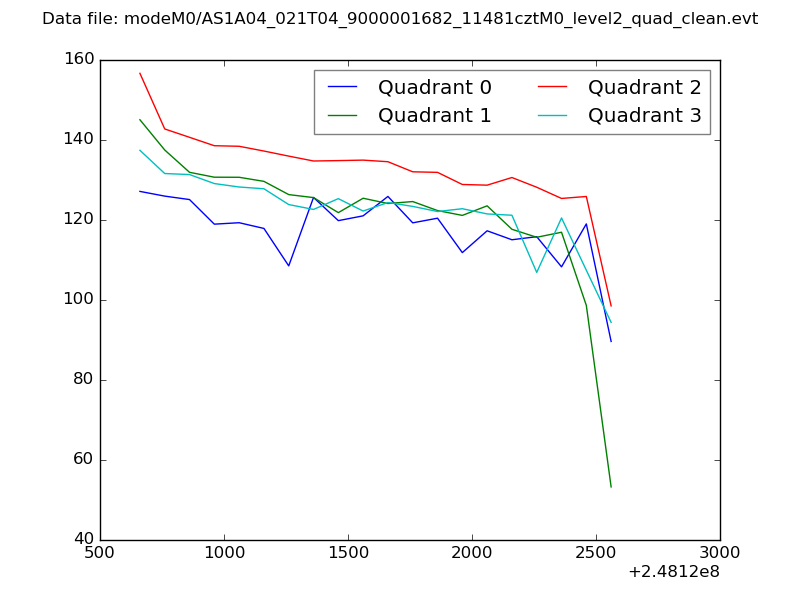 |
|
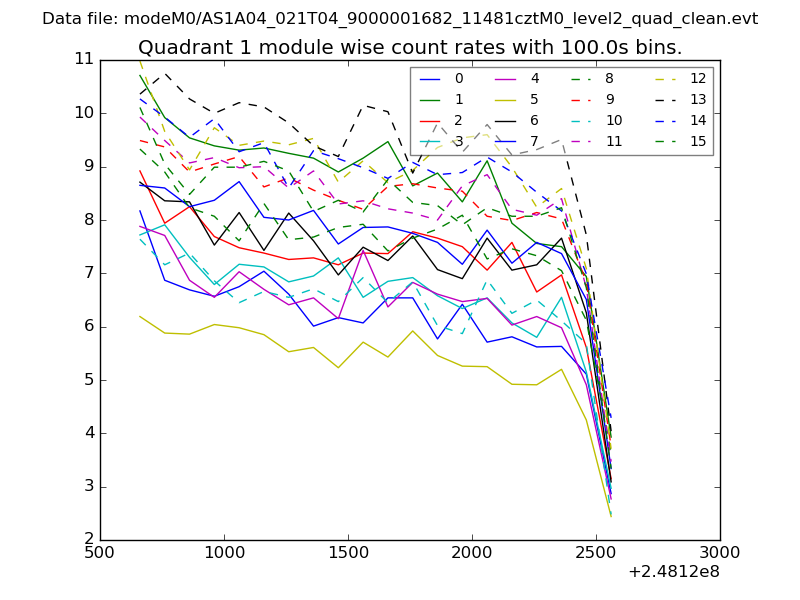
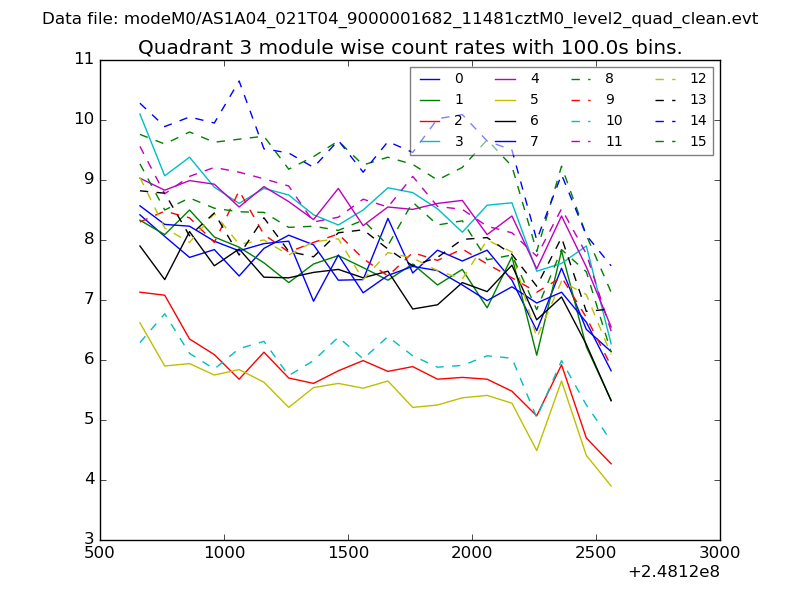
| Module-wise count rates for Quadrant A Data is divided into 100 sec bins |
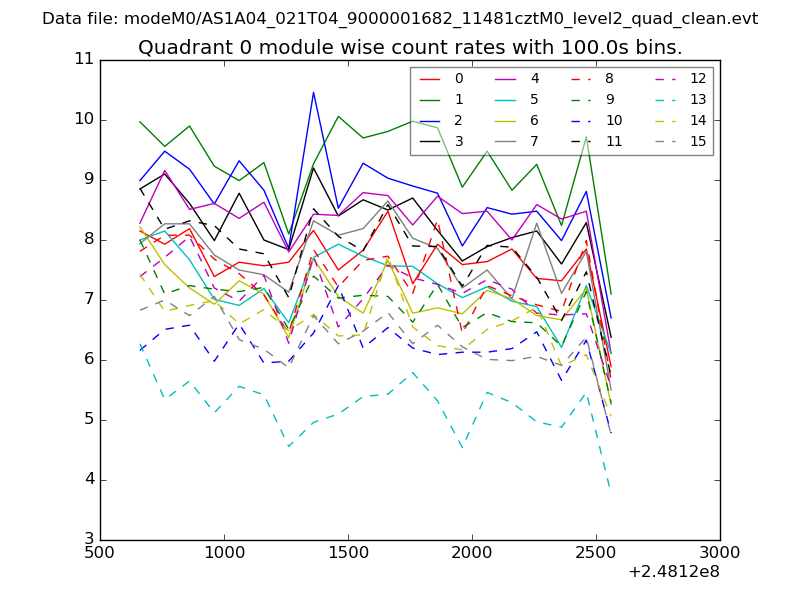 |
 |
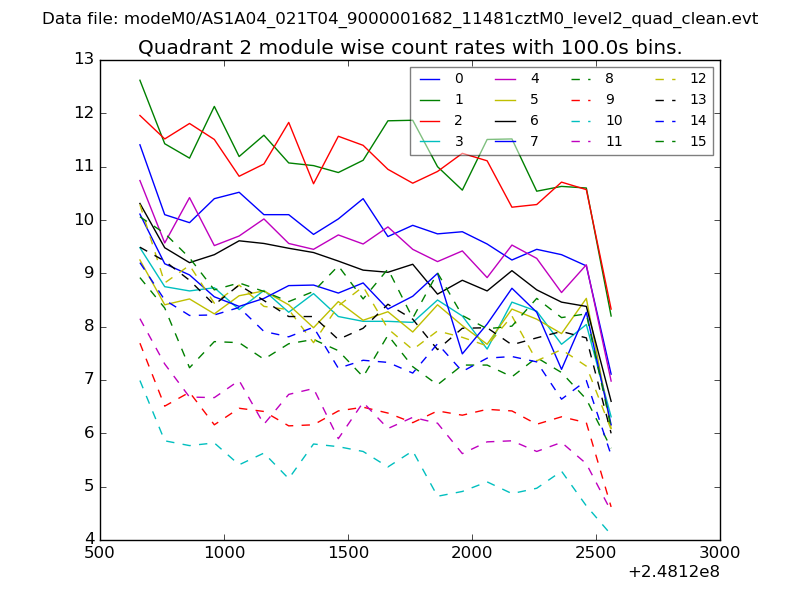
| Module-wise count rates for Quadrant B Data is divided into 100 sec bins |
 |
 |
| Module-wise count rates for Quadrant C Data is divided into 100 sec bins |
 |
 |
| Module-wise count rates for Quadrant D Data is divided into 100 sec bins |
 |
 |
| Parameter | Plot |
|---|---|
| CZT HV Monitor | 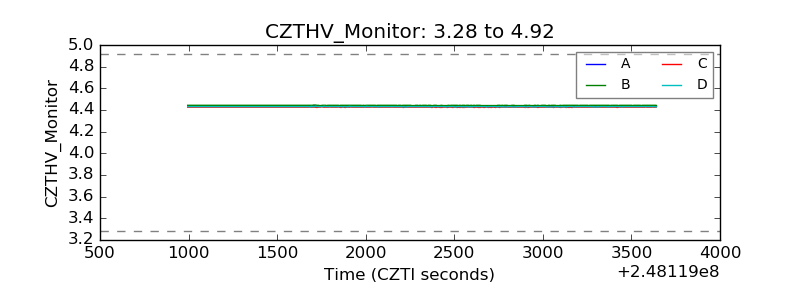 |
| D_VDD | 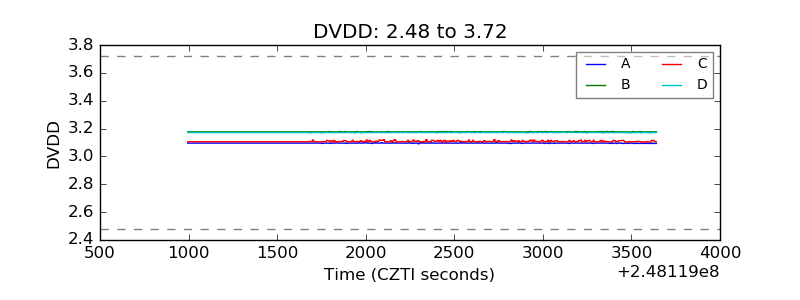 |
| Temperature 1 | 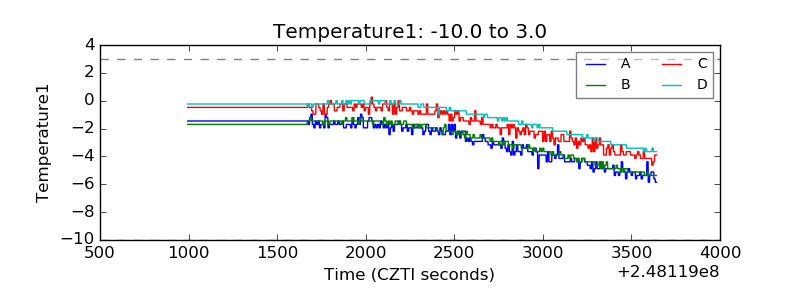 |
| Veto HV Monitor | 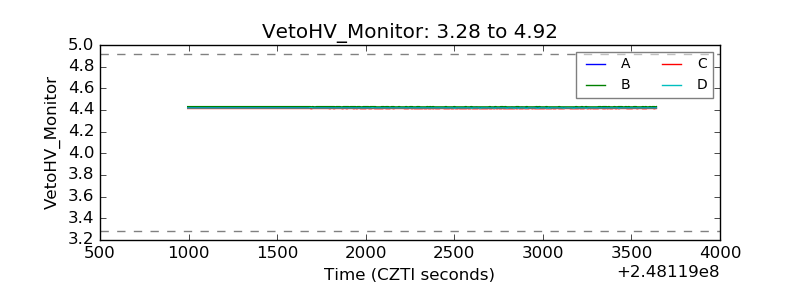 |
| Veto LLD | 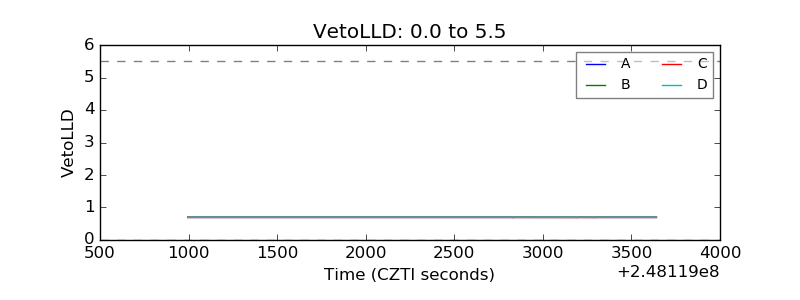 |
| Alpha Counter | 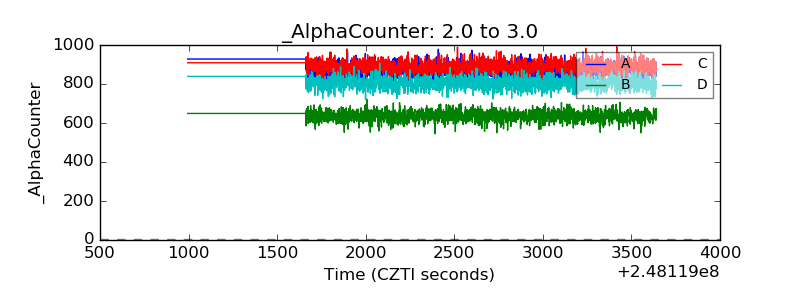 |
| _CPM_Rate | 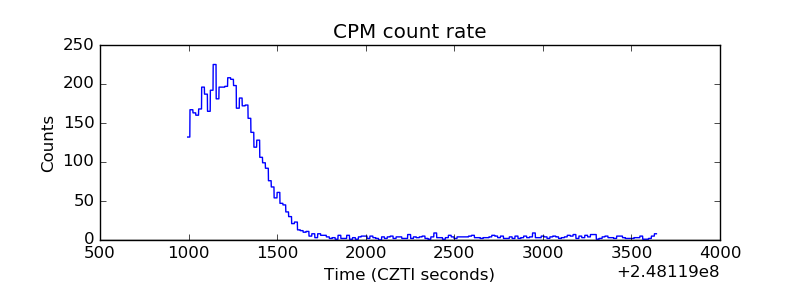 |
| CZT Counter | 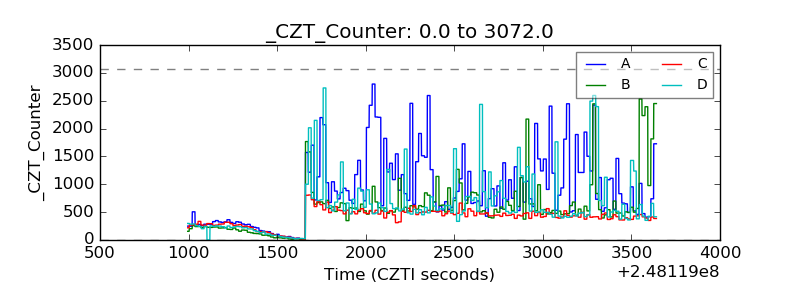 |
| +2.5 Volts monitor |  |
| +5 Volts monitor |  |
| _ROLL_ROT | 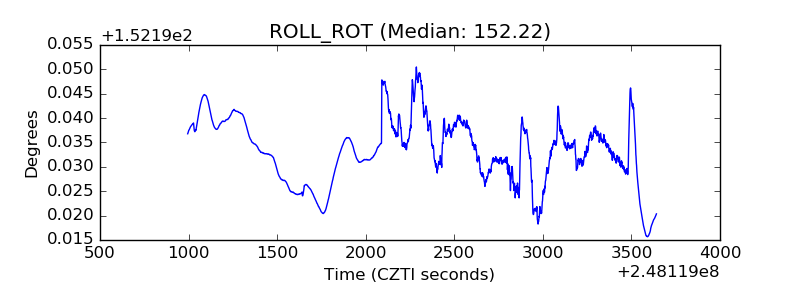 |
| _Roll_DEC | 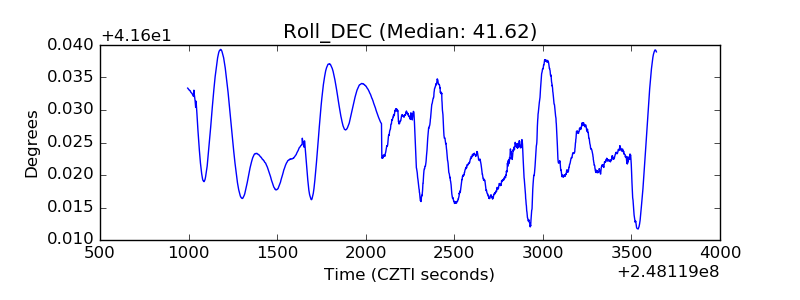 |
| _Roll_RA | 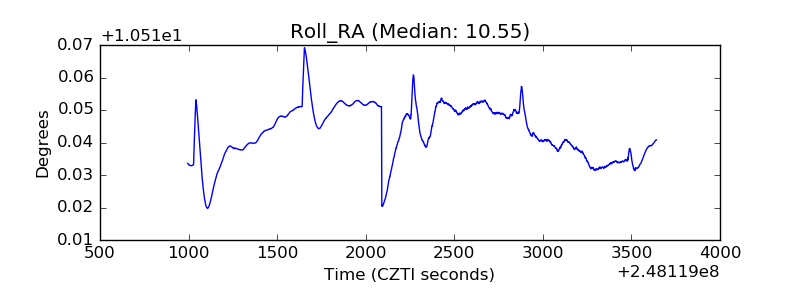 |
| Veto Counter | 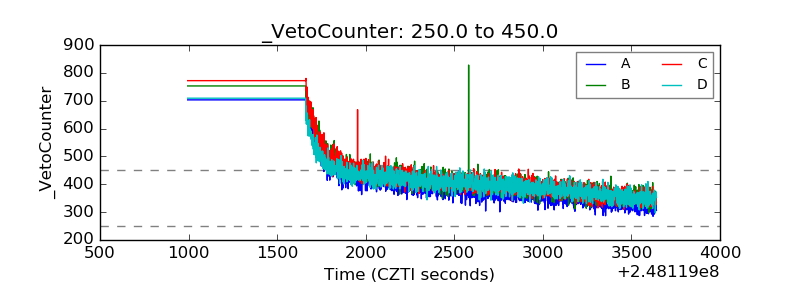 |