| Param | Original file | Final file |
|---|---|---|
| Filename | modeM0/AS1A04_107T01_9000001684cztM0_level2.fits | modeM0/AS1A04_107T01_9000001684cztM0_level2_quad_clean.evt |
| Size (bytes) | 681,238,080 | 680,788,800 |
| Size | 649.7 MB | 649.3 MB |
| Events in quadrant A | 3,827,276 | 3,657,749 |
| Events in quadrant B | 3,920,224 | 3,950,682 |
| Events in quadrant C | 4,155,102 | 4,097,695 |
| Events in quadrant D | 3,583,790 | 3,774,549 |
| Mode M9 | |||
|---|---|---|---|
| Quadrant | BADHDUFLAG | Total packets | Discarded packets |
| A | 0 | 116 | 0 |
| B | 0 | 116 | 0 |
| C | 0 | 116 | 0 |
| D | 0 | 116 | 0 |
| Mode SS | |||
|---|---|---|---|
| Quadrant | BADHDUFLAG | Total packets | Discarded packets |
| A | 0 | 1528 | 0 |
| B | 0 | 1528 | 0 |
| C | 0 | 1528 | 0 |
| D | 0 | 1528 | 0 |
| Mode M0 | |||
|---|---|---|---|
| Quadrant | BADHDUFLAG | Total packets | Discarded packets |
| A | 0 | 292799 | 0 |
| B | 0 | 217701 | 0 |
| C | 0 | 153348 | 0 |
| D | 0 | 183042 | 0 |
| Quadrant | Total seconds | Saturated seconds | Saturation percentage |
|---|---|---|---|
| A | 74886 | 13831 | 18.469407% |
| B | 74886 | 6589 | 8.798707% |
| C | 74886 | 414 | 0.552840% |
| D | 74886 | 1796 | 2.398312% |
Noise dominated data is calculated using 1-second bins in cleaned event files. If a bin has >2000 counts, and if more than 50% of those come from <1% of pixels, then it is considered to be noise-dominated and hence unusable.
| Quadrant | # 1 sec bins | Bins with >0 counts | Bins with >2000 counts | High rate bins dominated by noise | Noise dominated (total time) | Noise dominated (detector-on time) | Marked lightcurve |
|---|---|---|---|---|---|---|---|
| A | 86546 | 74733 | 0 | 0 | 0.00% | 0.00% |  |
| B | 86546 | 74851 | 0 | 0 | 0.00% | 0.00% |  |
| C | 86546 | 74885 | 0 | 0 | 0.00% | 0.00% |  |
| D | 86546 | 74853 | 0 | 0 | 0.00% | 0.00% |  |
Top three noisy pixels from each quadrant. If the there are fewer than three noisy pixels in the level2.evt file, extra rows are filled as -1
| Pixel properties | Quadrant properties | ||||||
|---|---|---|---|---|---|---|---|
| Quadrant | DetID | PixID | Counts | Sigma | Mean | Median | Sigma |
| A | 0 | 29 | 3655 | 11.03 | 995 | 931 | 247.0 |
| A | 7 | 110 | 3084 | 8.72 | 995 | 931 | 247.0 |
| A | 0 | 30 | 2874 | 7.87 | 995 | 931 | 247.0 |
| B | 2 | 9 | 3430 | 11.91 | 1034 | 984 | 205.4 |
| B | 3 | 17 | 2623 | 7.98 | 1034 | 984 | 205.4 |
| B | 14 | 254 | 2619 | 7.96 | 1034 | 984 | 205.4 |
| C | 1 | 81 | 3093 | 7.3 | 1096 | 1019 | 284.0 |
| C | 1 | 80 | 3062 | 7.19 | 1096 | 1019 | 284.0 |
| C | 12 | 241 | 2880 | 6.55 | 1096 | 1019 | 284.0 |
| D | 6 | 231 | 2613 | 6.11 | 1023 | 928 | 275.6 |
| D | 3 | 14 | 2611 | 6.11 | 1023 | 928 | 275.6 |
| D | 7 | 3 | 2542 | 5.86 | 1023 | 928 | 275.6 |
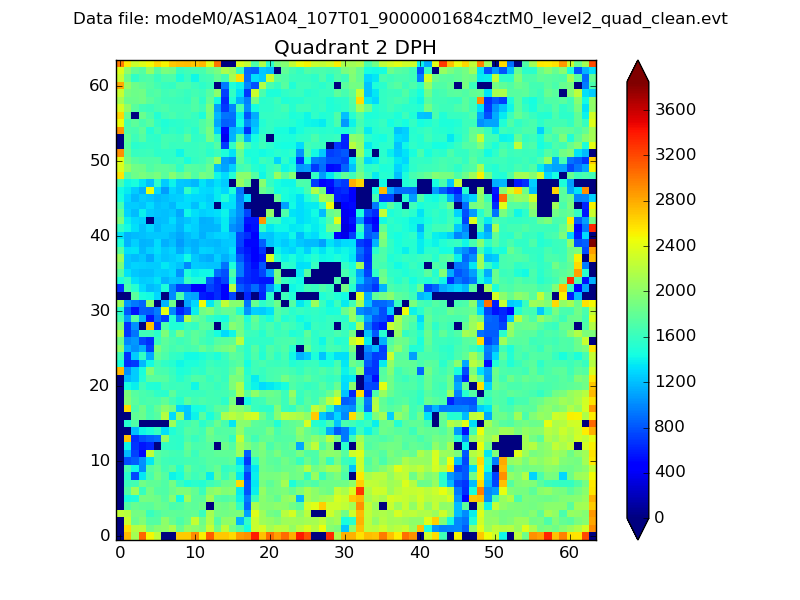
Histogram calculated using DETX and DETY for each event in the final _common_clean file
| Quadrant A | 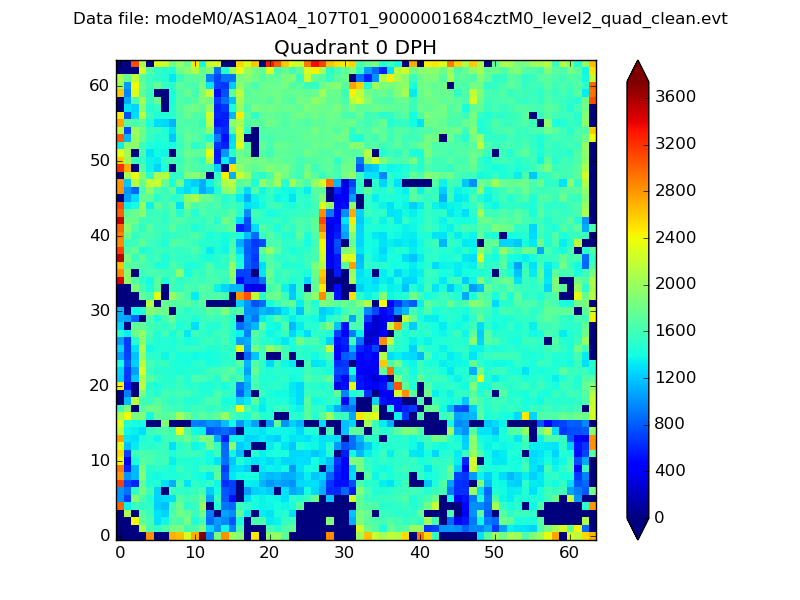 |
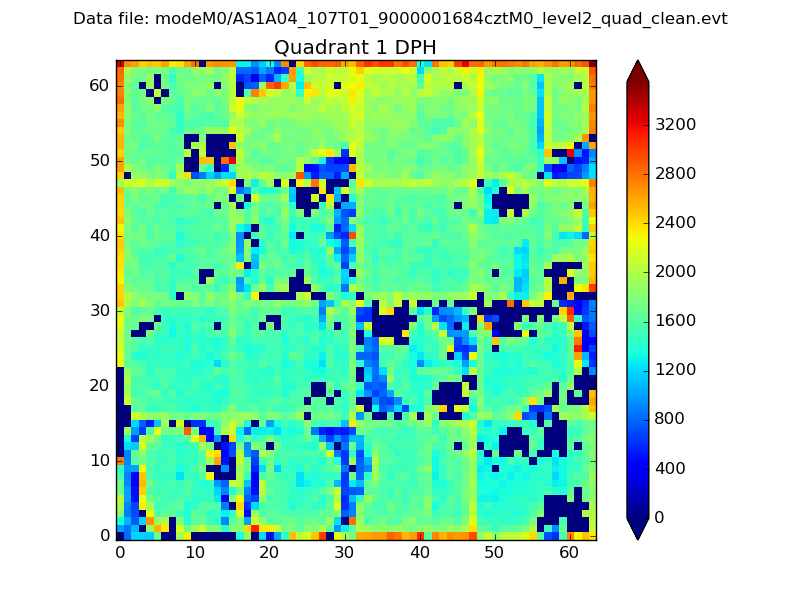 |
Quadrant B |
|---|---|---|---|
| Quadrant D | 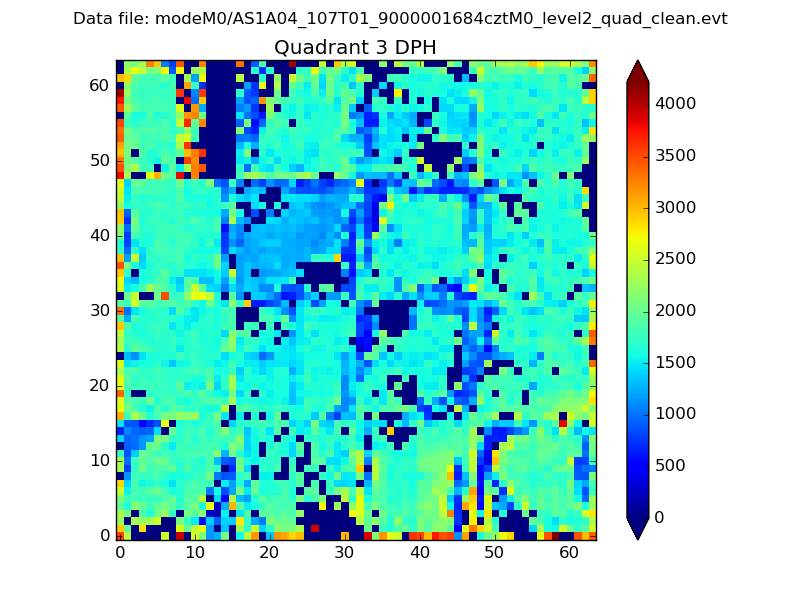 |
 |
Quadrant C |
| Plot type | Count rate plots | Images |
|---|---|---|
| Comparison with Poisson distribution Blue bars denote a histogram of data divided into 1 sec bins. Red curve is a Poisson curve with rate = median count rate of data. |
 |
 |
| Quadrant-wise count rates Data is divided into 100 sec bins |
 |
|
| Module-wise count rates for Quadrant A Data is divided into 100 sec bins |
 |
 |
| Module-wise count rates for Quadrant B Data is divided into 100 sec bins |
 |
 |
| Module-wise count rates for Quadrant C Data is divided into 100 sec bins |
 |
 |
| Module-wise count rates for Quadrant D Data is divided into 100 sec bins |
 |
 |
| Parameter | Plot |
|---|---|
| CZT HV Monitor |  |
| D_VDD |  |
| Temperature 1 |  |
| Veto HV Monitor |  |
| Veto LLD |  |
| Alpha Counter |  |
| _CPM_Rate |  |
| CZT Counter |  |
| +2.5 Volts monitor |  |
| +5 Volts monitor |  |
| _ROLL_ROT |  |
| _Roll_DEC |  |
| _Roll_RA | 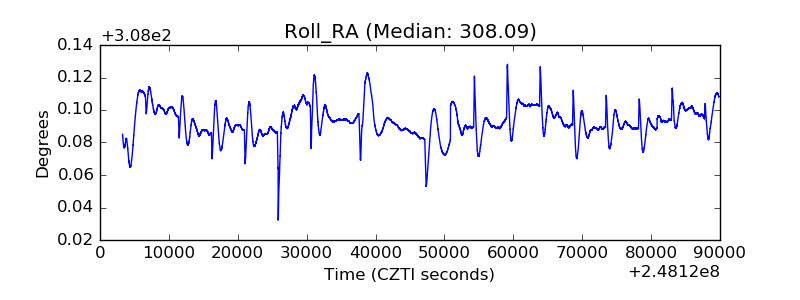 |
| Veto Counter |  |