| Param | Original file | Final file |
|---|---|---|
| Filename | modeM0/AS1A04_107T01_9000001684_11481cztM0_level2.evt | modeM0/AS1A04_107T01_9000001684_11481cztM0_level2_quad_clean.evt |
| Size (bytes) | 528,935,040 | 58,331,520 |
| Size | 504.4 MB | 55.6 MB |
| Events in quadrant A | 6,195,986 | 332,197 |
| Events in quadrant B | 4,823,628 | 356,147 |
| Events in quadrant C | 2,059,908 | 392,388 |
| Events in quadrant D | 2,637,071 | 371,091 |
| Mode M9 | |||
|---|---|---|---|
| Quadrant | BADHDUFLAG | Total packets | Discarded packets |
| A | 0 | 5 | 0 |
| B | 0 | 5 | 0 |
| C | 0 | 5 | 0 |
| D | 0 | 5 | 0 |
| Mode SS | |||
|---|---|---|---|
| Quadrant | BADHDUFLAG | Total packets | Discarded packets |
| A | 0 | 92 | 0 |
| B | 0 | 92 | 0 |
| C | 0 | 92 | 0 |
| D | 0 | 92 | 0 |
| Mode M0 | |||
|---|---|---|---|
| Quadrant | BADHDUFLAG | Total packets | Discarded packets |
| A | 0 | 21543 | 2 |
| B | 0 | 17358 | 1 |
| C | 0 | 9200 | 1 |
| D | 0 | 10859 | 1 |
| Quadrant | Total seconds | Saturated seconds | Saturation percentage |
|---|---|---|---|
| A | 4453 | 1228 | 27.576914% |
| B | 4453 | 1153 | 25.892657% |
| C | 4453 | 13 | 0.291938% |
| D | 4453 | 170 | 3.817651% |
Noise dominated data is calculated using 1-second bins in cleaned event files. If a bin has >2000 counts, and if more than 50% of those come from <1% of pixels, then it is considered to be noise-dominated and hence unusable.
| Quadrant | # 1 sec bins | Bins with >0 counts | Bins with >2000 counts | High rate bins dominated by noise | Noise dominated (total time) | Noise dominated (detector-on time) | Marked lightcurve |
|---|---|---|---|---|---|---|---|
| A | 5009 | 4455 | 849 | 849 | 16.95% | 19.06% | 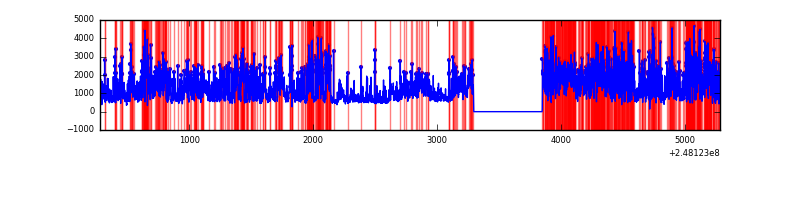 |
| B | 5009 | 4455 | 719 | 719 | 14.35% | 16.14% | 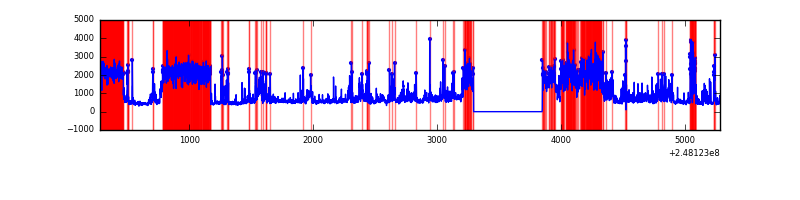 |
| C | 5009 | 4455 | 1 | 1 | 0.02% | 0.02% | 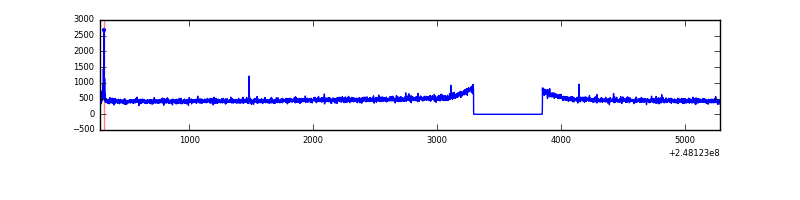 |
| D | 5009 | 4455 | 65 | 65 | 1.30% | 1.46% |  |
Top three noisy pixels from each quadrant. If the there are fewer than three noisy pixels in the level2.evt file, extra rows are filled as -1
| Pixel properties | Quadrant properties | ||||||
|---|---|---|---|---|---|---|---|
| Quadrant | DetID | PixID | Counts | Sigma | Mean | Median | Sigma |
| A | 8 | 5 | 4185638 | 41829.72 | 484 | 473 | 100.1 |
| A | 9 | 143 | 53077 | 525.76 | 484 | 473 | 100.1 |
| A | 1 | 162 | 28455 | 279.67 | 484 | 473 | 100.1 |
| B | 4 | 239 | 1298035 | 14012.49 | 482 | 469 | 92.6 |
| B | 4 | 81 | 1123920 | 12132.21 | 482 | 469 | 92.6 |
| B | 15 | 204 | 193158 | 2080.86 | 482 | 469 | 92.6 |
| C | 12 | 4 | 12729 | 99.31 | 524 | 524 | 122.9 |
| C | 13 | 61 | 3899 | 27.46 | 524 | 524 | 122.9 |
| C | 14 | 234 | 2398 | 15.25 | 524 | 524 | 122.9 |
| D | 1 | 52 | 250470 | 1987.57 | 517 | 502 | 125.8 |
| D | 5 | 222 | 122300 | 968.45 | 517 | 502 | 125.8 |
| D | 2 | 120 | 79939 | 631.63 | 517 | 502 | 125.8 |
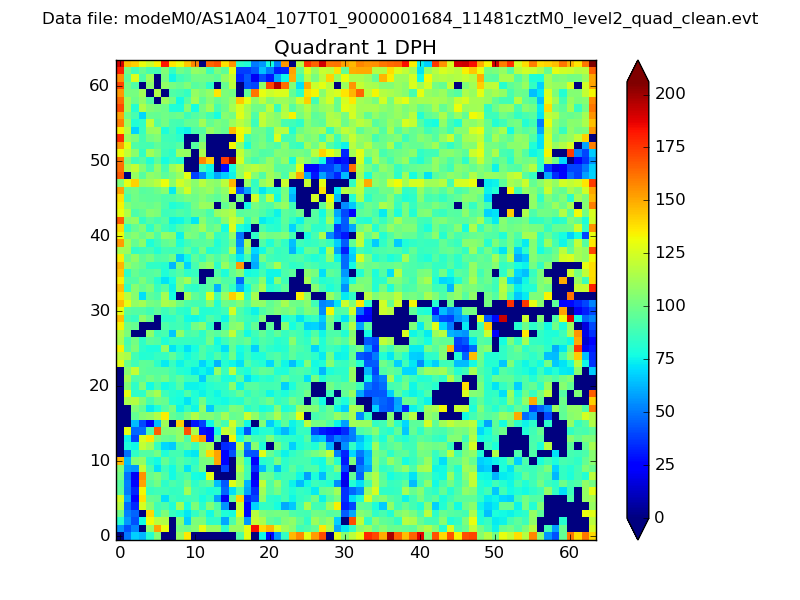
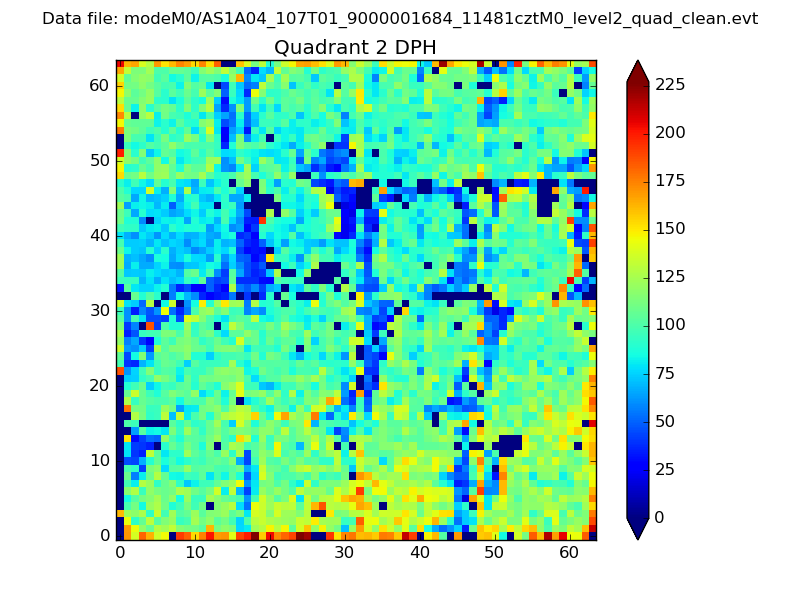
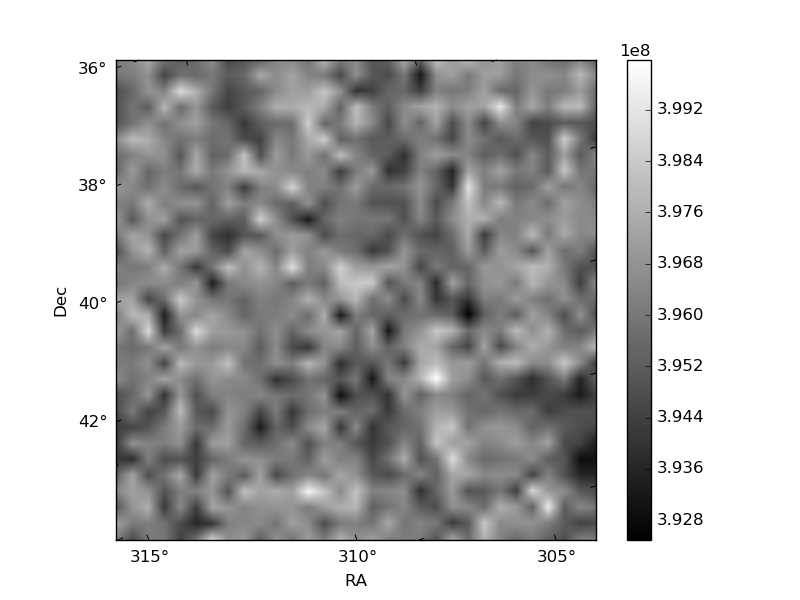
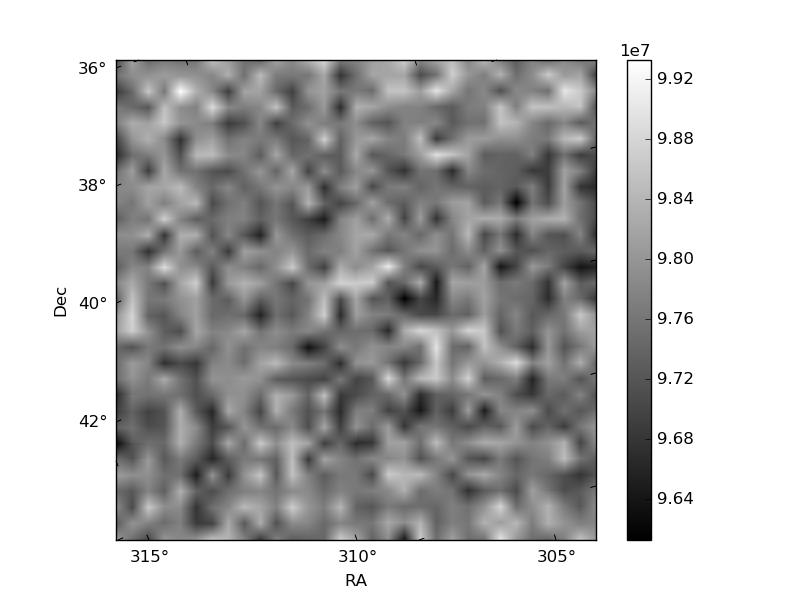
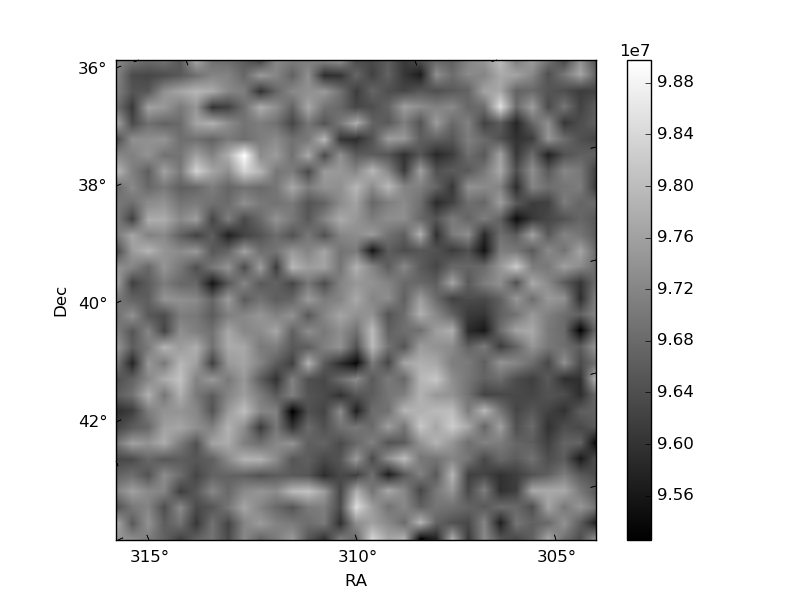
Histogram calculated using DETX and DETY for each event in the final _common_clean file
| Quadrant A | 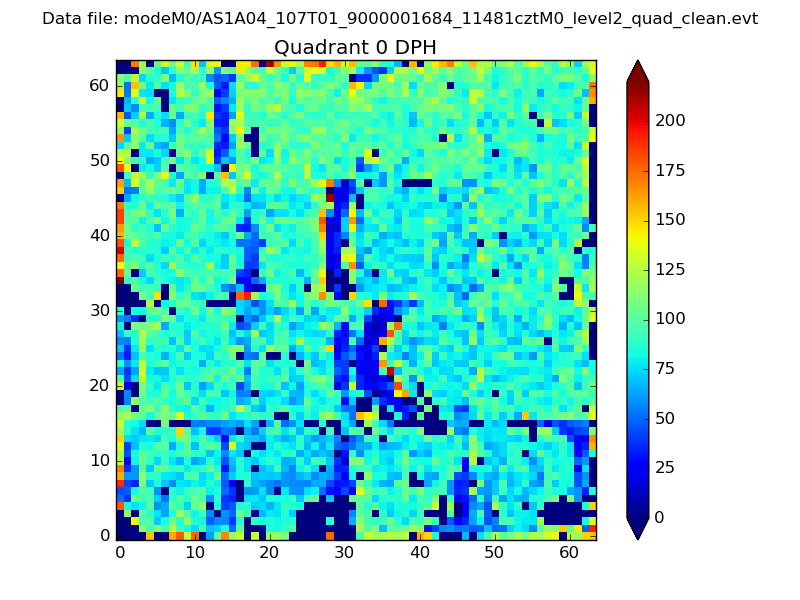 |
 |
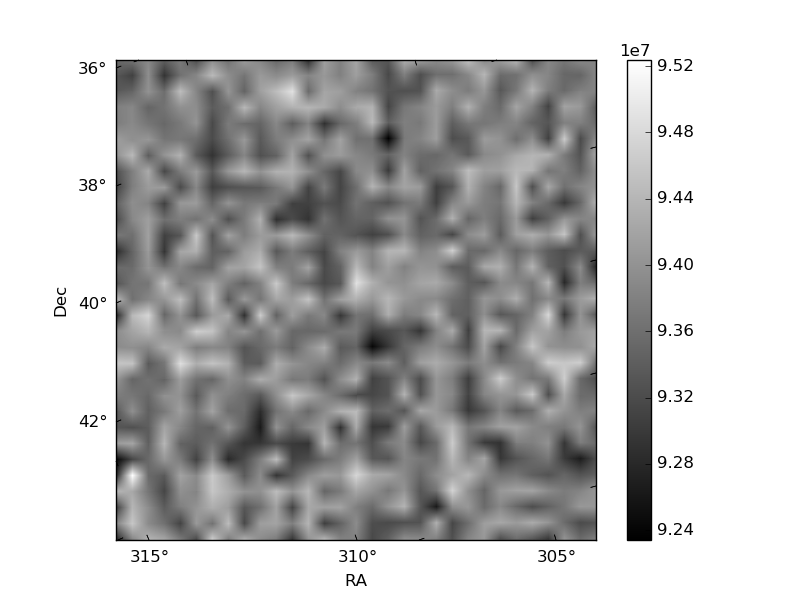
Quadrant B |
|---|---|---|---|
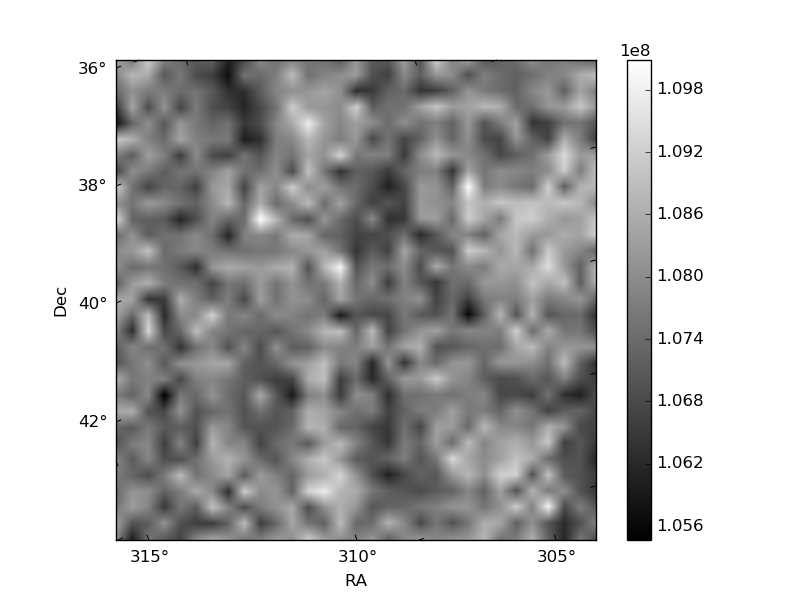
| Quadrant D | 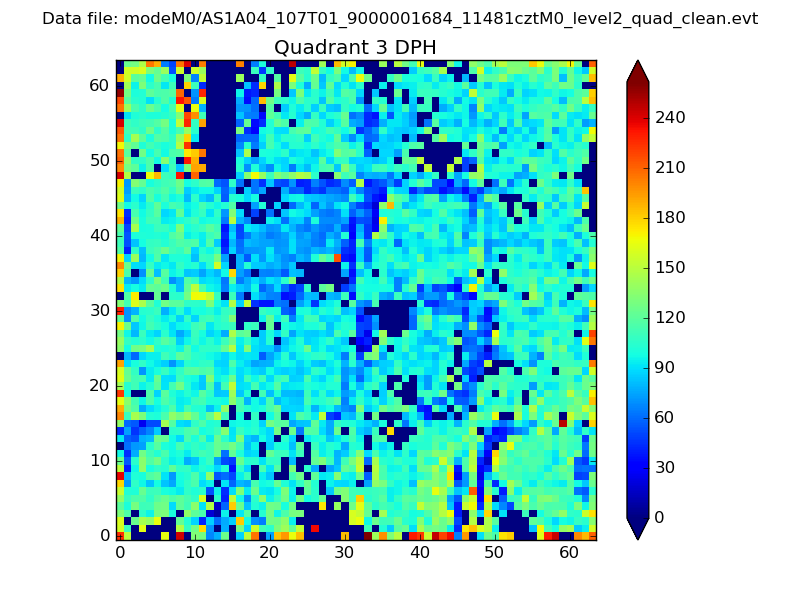 |
 |
Quadrant C |
| Plot type | Count rate plots | Images |
|---|---|---|
| Comparison with Poisson distribution Blue bars denote a histogram of data divided into 1 sec bins. Red curve is a Poisson curve with rate = median count rate of data. |
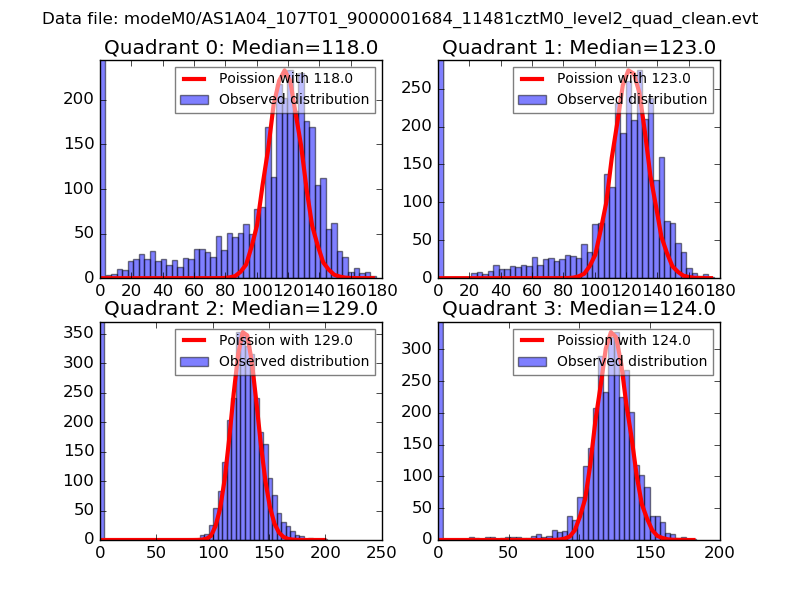 |
 |
| Quadrant-wise count rates Data is divided into 100 sec bins |
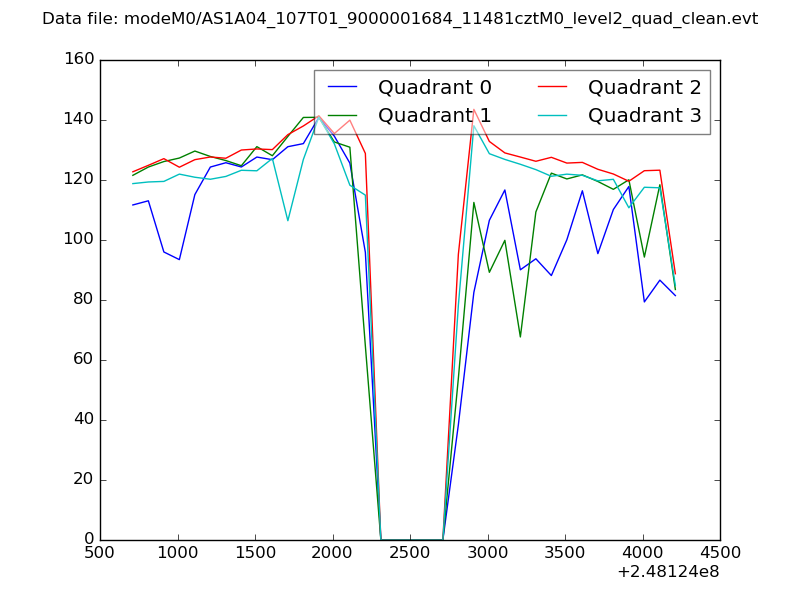 |
|
| Module-wise count rates for Quadrant A Data is divided into 100 sec bins |
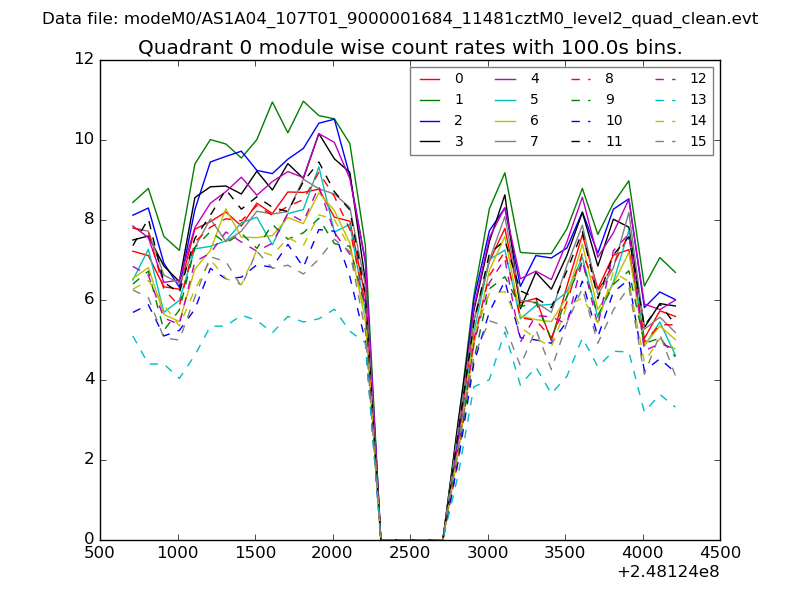 |
 |
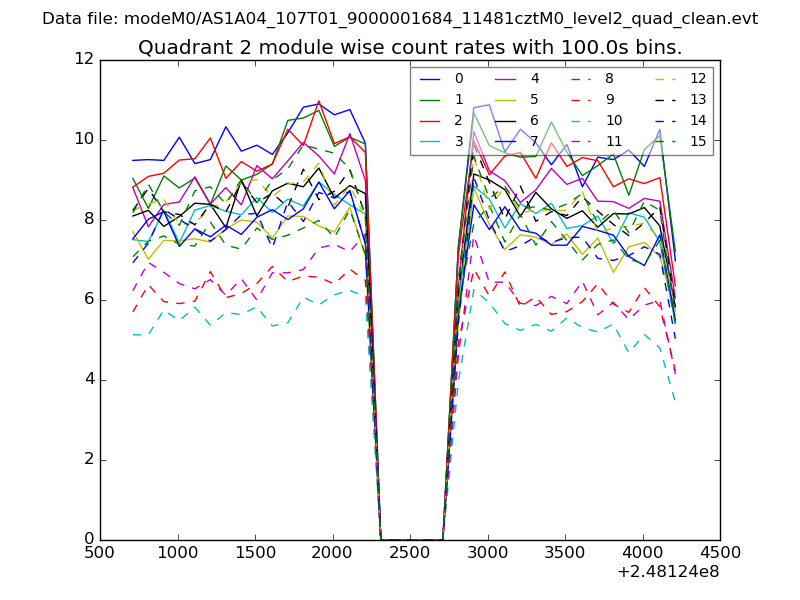
| Module-wise count rates for Quadrant B Data is divided into 100 sec bins |
 |
 |
| Module-wise count rates for Quadrant C Data is divided into 100 sec bins |
 |
 |
| Module-wise count rates for Quadrant D Data is divided into 100 sec bins |
 |
 |
| Parameter | Plot |
|---|---|
| CZT HV Monitor | 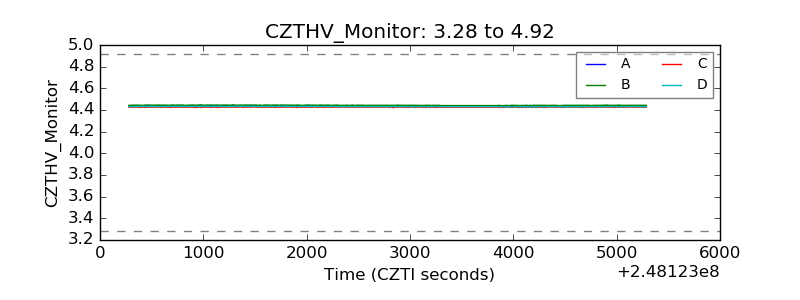 |
| D_VDD | 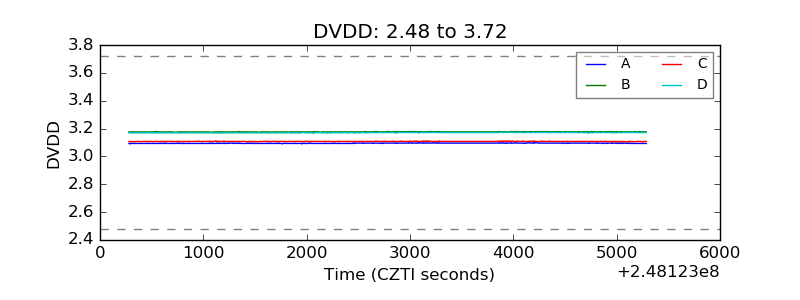 |
| Temperature 1 | 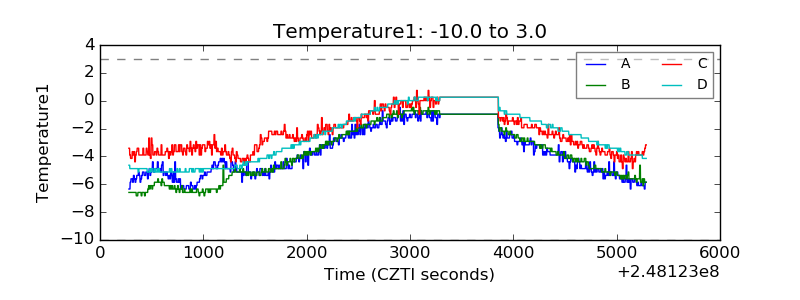 |
| Veto HV Monitor | 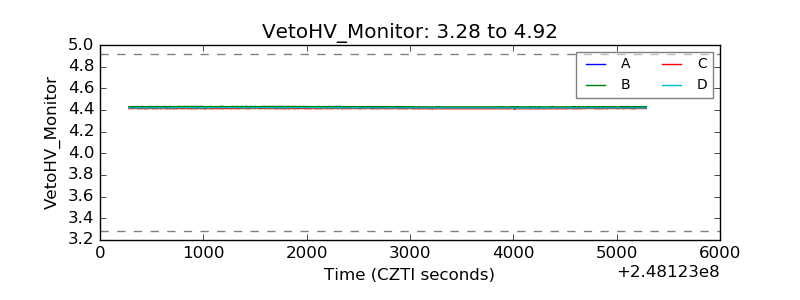 |
| Veto LLD |  |
| Alpha Counter | 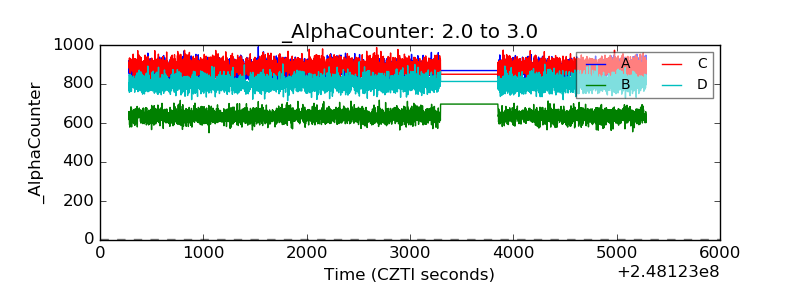 |
| _CPM_Rate | 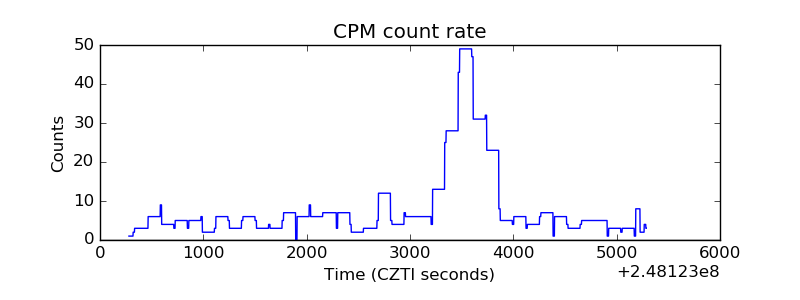 |
| CZT Counter | 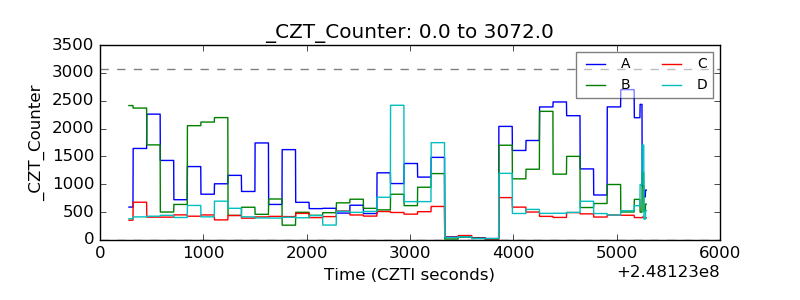 |
| +2.5 Volts monitor |  |
| +5 Volts monitor |  |
| _ROLL_ROT | 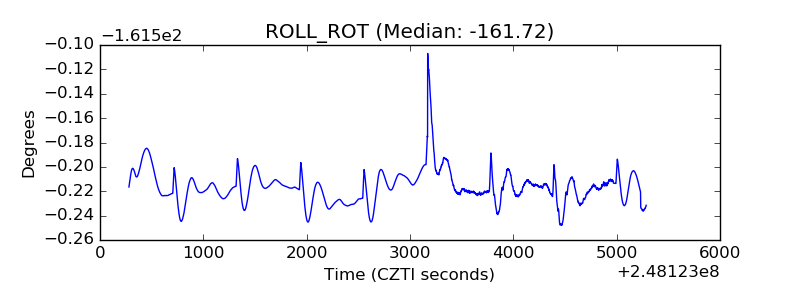 |
| _Roll_DEC | 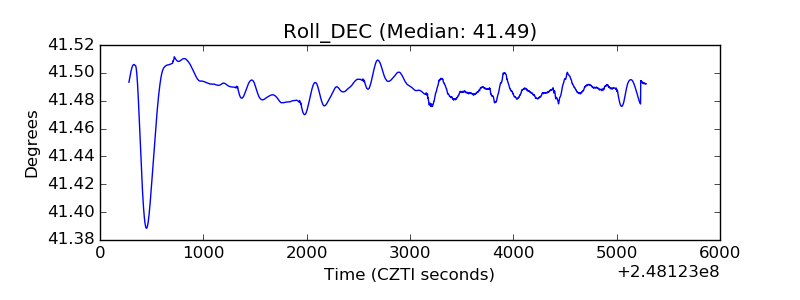 |
| _Roll_RA | 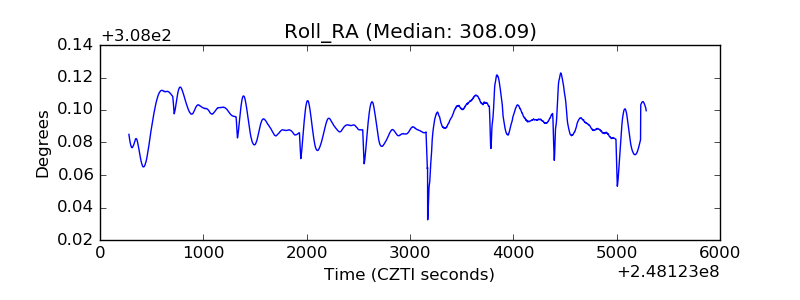 |
| Veto Counter |  |