| Param | Original file | Final file |
|---|---|---|
| Filename | modeM0/AS1A04_107T01_9000001684_11486cztM0_level2.evt | modeM0/AS1A04_107T01_9000001684_11486cztM0_level2_quad_clean.evt |
| Size (bytes) | 1,770,759,360 | 215,691,840 |
| Size | 1.6 GB | 205.7 MB |
| Events in quadrant A | 18,740,222 | 1,258,392 |
| Events in quadrant B | 15,615,547 | 1,284,670 |
| Events in quadrant C | 8,303,903 | 1,377,649 |
| Events in quadrant D | 9,709,802 | 1,323,669 |
| Mode M9 | |||
|---|---|---|---|
| Quadrant | BADHDUFLAG | Total packets | Discarded packets |
| A | 0 | 18 | 0 |
| B | 0 | 18 | 0 |
| C | 0 | 18 | 0 |
| D | 0 | 18 | 0 |
| Mode SS | |||
|---|---|---|---|
| Quadrant | BADHDUFLAG | Total packets | Discarded packets |
| A | 0 | 380 | 0 |
| B | 0 | 380 | 0 |
| C | 0 | 380 | 0 |
| D | 0 | 380 | 0 |
| Mode M0 | |||
|---|---|---|---|
| Quadrant | BADHDUFLAG | Total packets | Discarded packets |
| A | 0 | 68448 | 5 |
| B | 0 | 58836 | 4 |
| C | 0 | 37922 | 4 |
| D | 0 | 41205 | 4 |
| Quadrant | Total seconds | Saturated seconds | Saturation percentage |
|---|---|---|---|
| A | 18670 | 2993 | 16.031066% |
| B | 18670 | 2342 | 12.544189% |
| C | 18670 | 73 | 0.391002% |
| D | 18670 | 219 | 1.173005% |
Noise dominated data is calculated using 1-second bins in cleaned event files. If a bin has >2000 counts, and if more than 50% of those come from <1% of pixels, then it is considered to be noise-dominated and hence unusable.
| Quadrant | # 1 sec bins | Bins with >0 counts | Bins with >2000 counts | High rate bins dominated by noise | Noise dominated (total time) | Noise dominated (detector-on time) | Marked lightcurve |
|---|---|---|---|---|---|---|---|
| A | 20461 | 18673 | 1840 | 1840 | 8.99% | 9.85% | 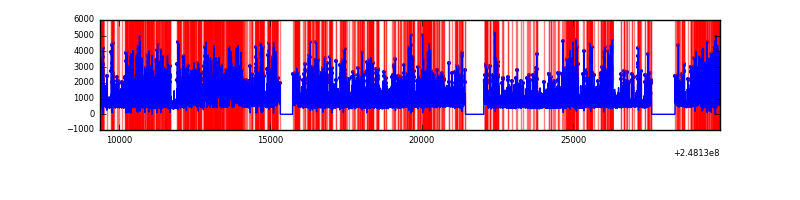 |
| B | 20461 | 18674 | 1478 | 1478 | 7.22% | 7.91% | 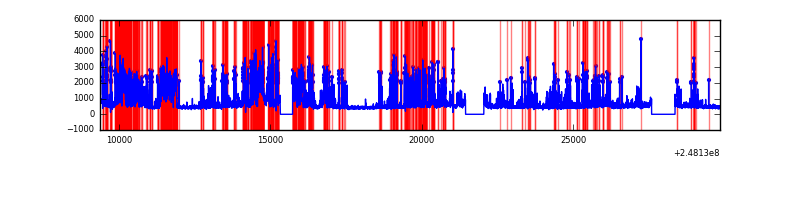 |
| C | 20461 | 18674 | 0 | 0 | 0.00% | 0.00% | 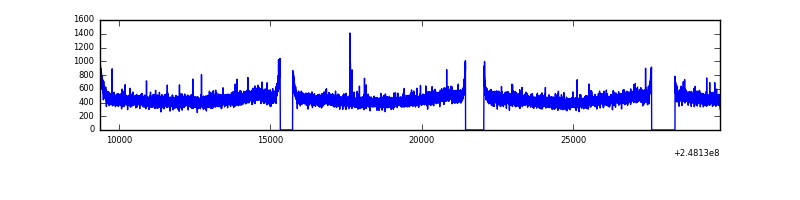 |
| D | 20461 | 18674 | 104 | 104 | 0.51% | 0.56% | 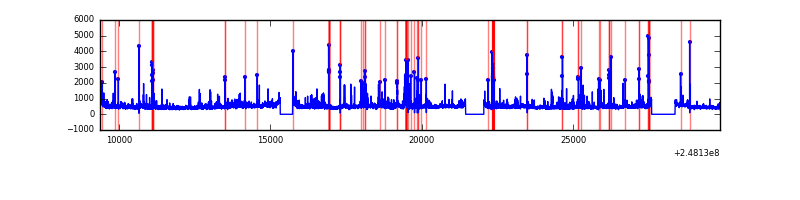 |
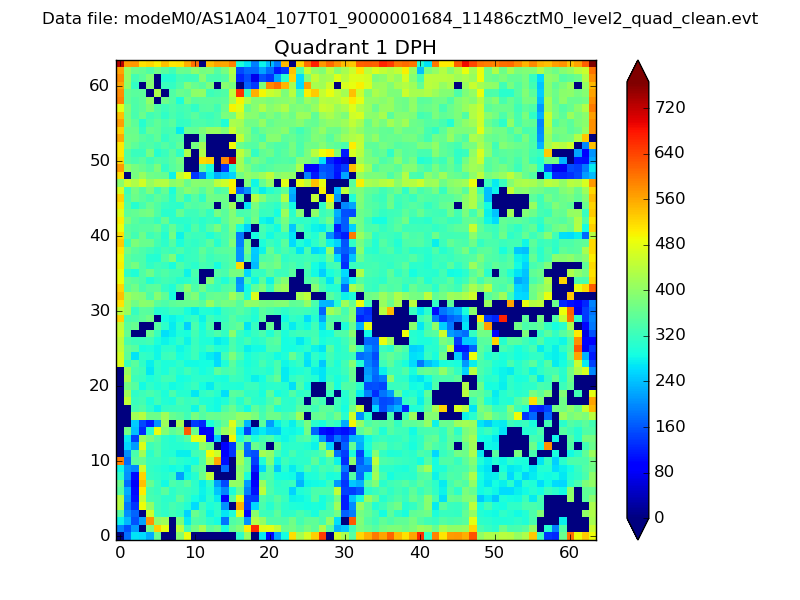
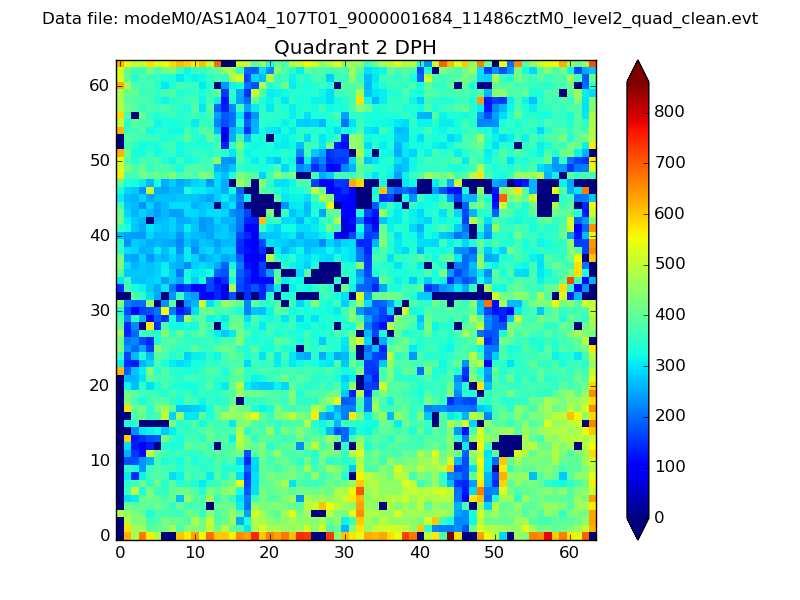
Top three noisy pixels from each quadrant. If the there are fewer than three noisy pixels in the level2.evt file, extra rows are filled as -1
| Pixel properties | Quadrant properties | ||||||
|---|---|---|---|---|---|---|---|
| Quadrant | DetID | PixID | Counts | Sigma | Mean | Median | Sigma |
| A | 8 | 5 | 10127934 | 24413.81 | 2040 | 1996 | 414.8 |
| A | 15 | 223 | 287643 | 688.7 | 2040 | 1996 | 414.8 |
| A | 15 | 239 | 136984 | 325.46 | 2040 | 1996 | 414.8 |
| B | 4 | 81 | 2725046 | 6961.57 | 2077 | 2026 | 391.2 |
| B | 4 | 239 | 2121703 | 5419.08 | 2077 | 2026 | 391.2 |
| B | 3 | 64 | 2003158 | 5116.02 | 2077 | 2026 | 391.2 |
| C | 13 | 61 | 15491 | 27.11 | 2127 | 2140 | 492.5 |
| C | 12 | 4 | 14303 | 24.7 | 2127 | 2140 | 492.5 |
| C | 3 | 202 | 5108 | 6.03 | 2127 | 2140 | 492.5 |
| D | 1 | 52 | 759518 | 1492.74 | 2114 | 2057 | 507.4 |
| D | 2 | 120 | 290566 | 568.57 | 2114 | 2057 | 507.4 |
| D | 2 | 14 | 137930 | 267.77 | 2114 | 2057 | 507.4 |
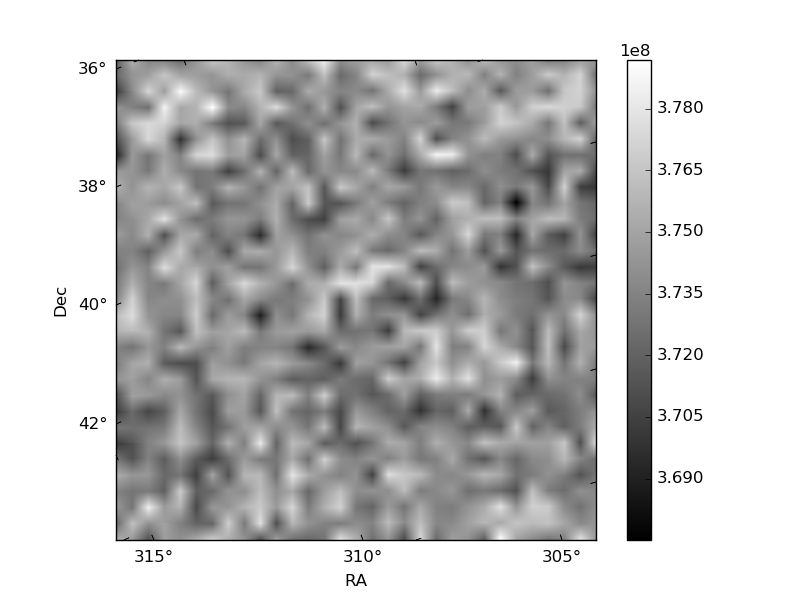
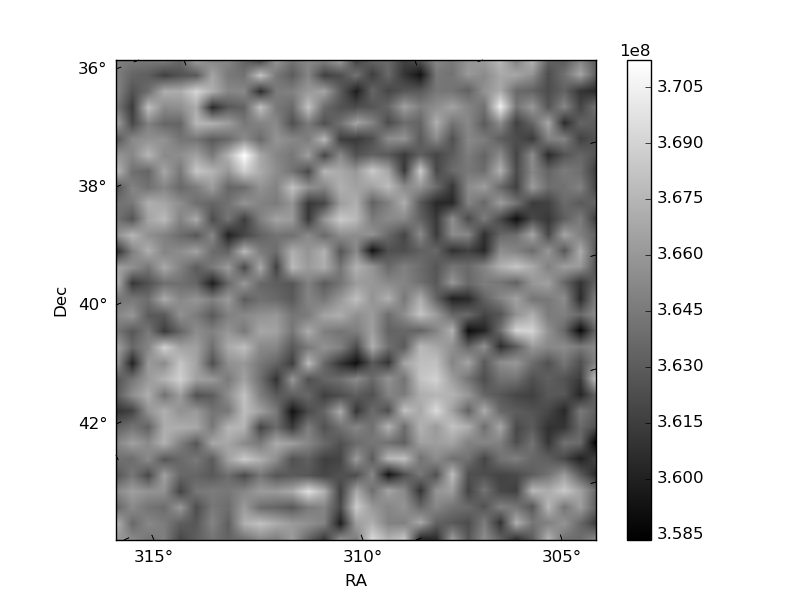
Histogram calculated using DETX and DETY for each event in the final _common_clean file
| Quadrant A | 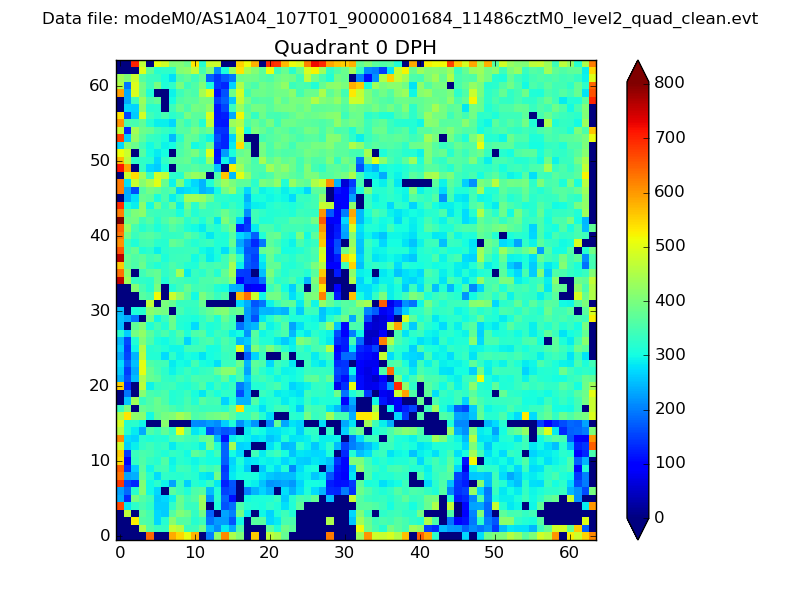 |
 |
Quadrant B |
|---|---|---|---|
| Quadrant D | 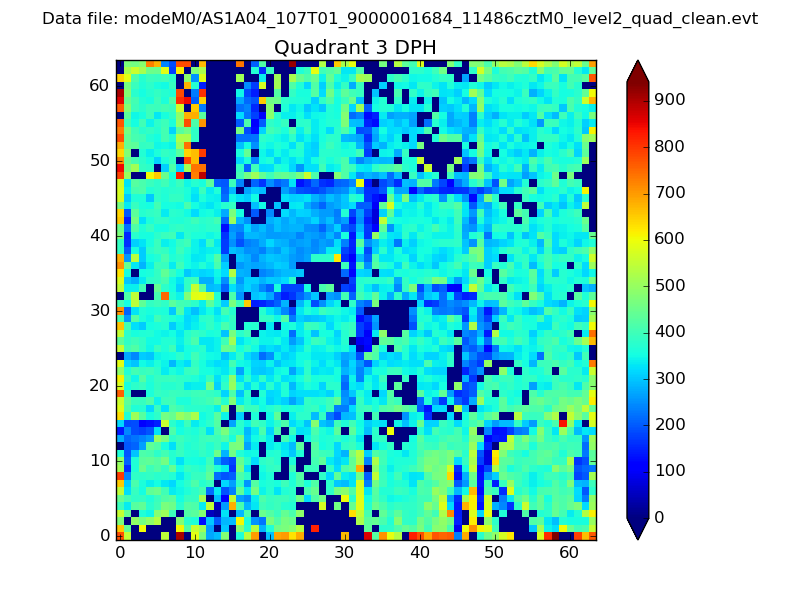 |
 |
Quadrant C |
| Plot type | Count rate plots | Images |
|---|---|---|
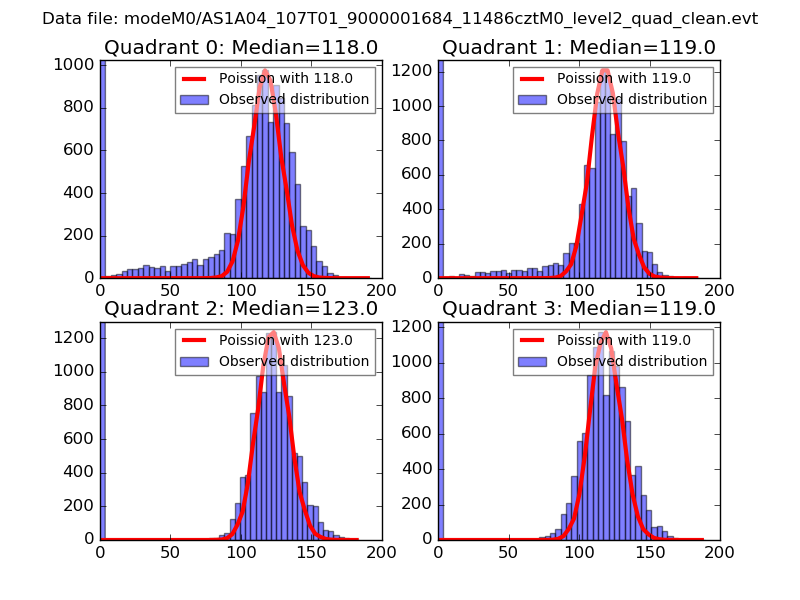
| Comparison with Poisson distribution Blue bars denote a histogram of data divided into 1 sec bins. Red curve is a Poisson curve with rate = median count rate of data. |
 |
 |
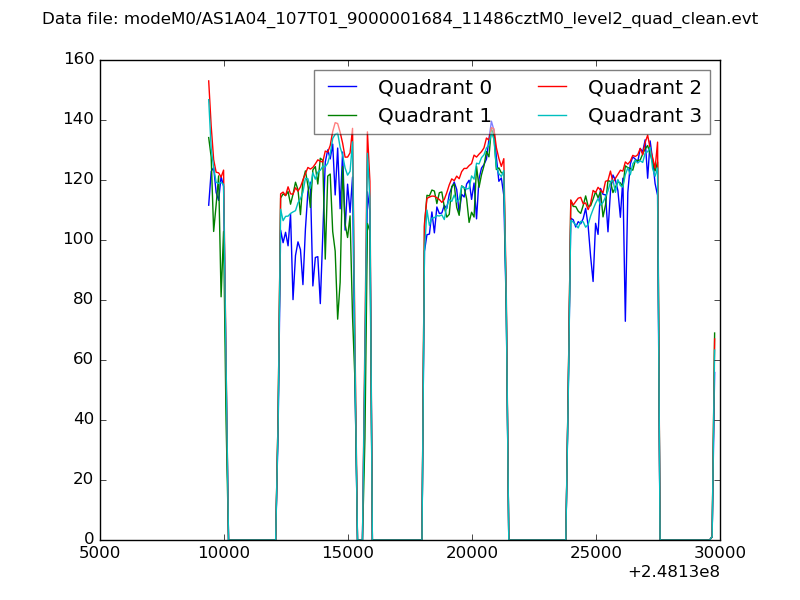
| Quadrant-wise count rates Data is divided into 100 sec bins |
 |
|
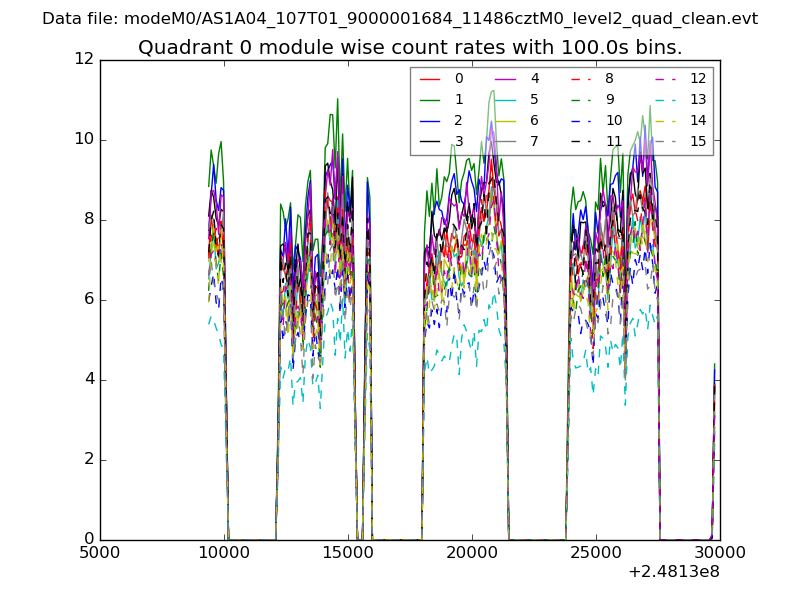
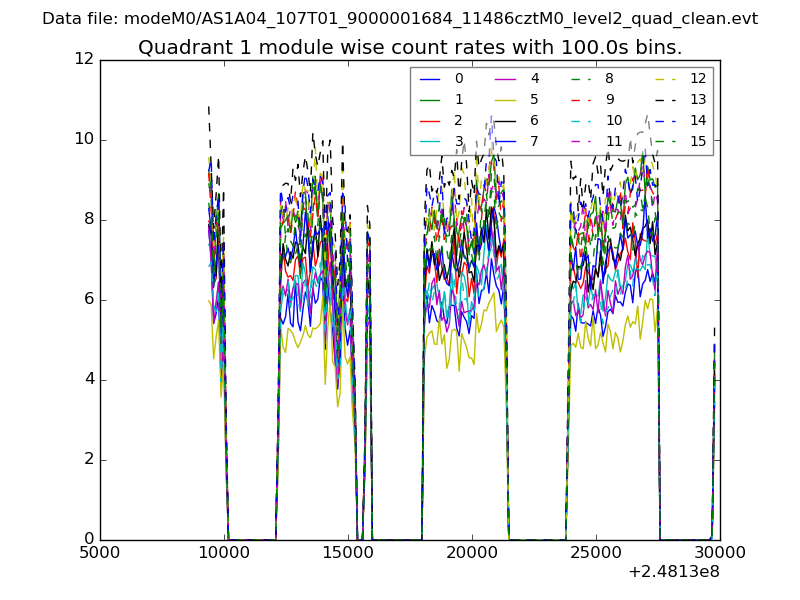
| Module-wise count rates for Quadrant A Data is divided into 100 sec bins |
 |
 |
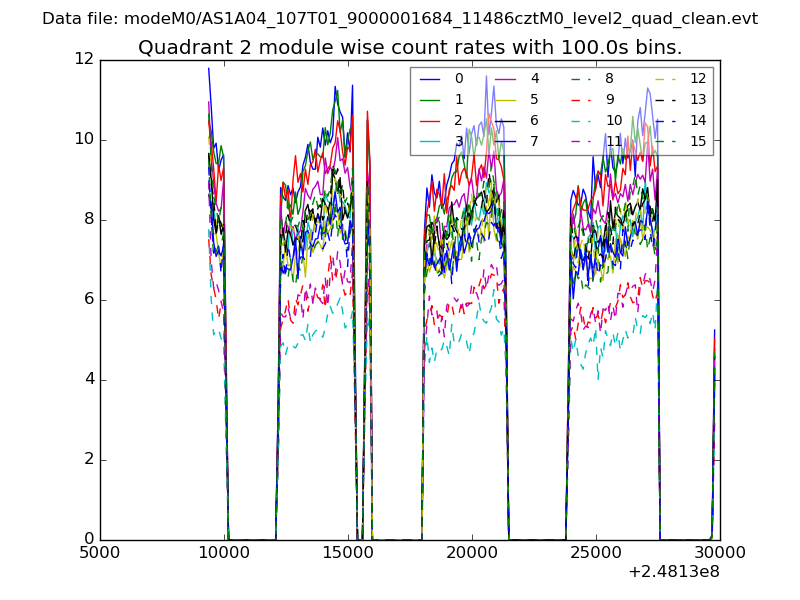
| Module-wise count rates for Quadrant B Data is divided into 100 sec bins |
 |
 |
| Module-wise count rates for Quadrant C Data is divided into 100 sec bins |
 |
 |
| Module-wise count rates for Quadrant D Data is divided into 100 sec bins |
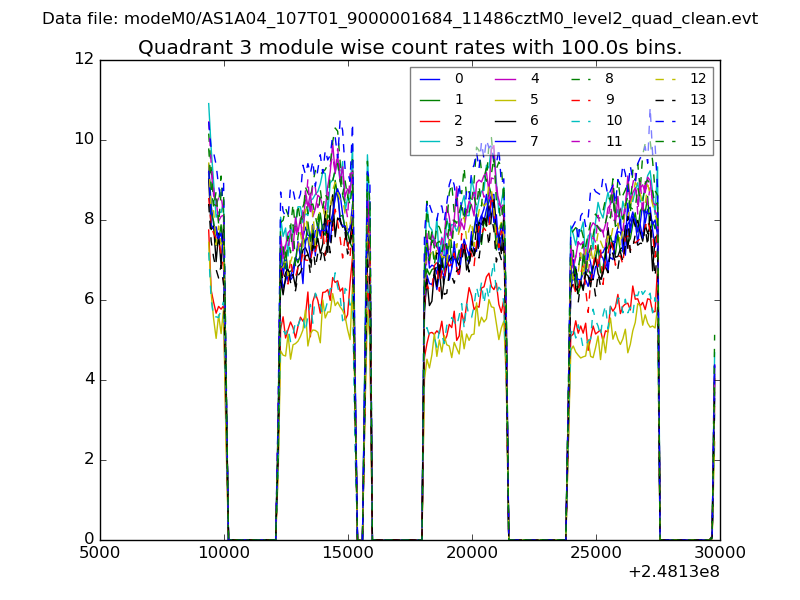 |
 |
| Parameter | Plot |
|---|---|
| CZT HV Monitor | 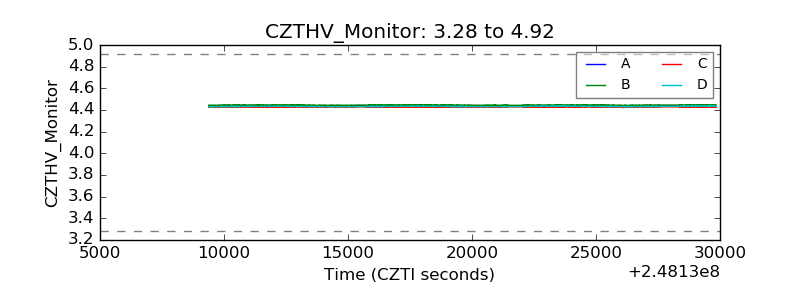 |
| D_VDD | 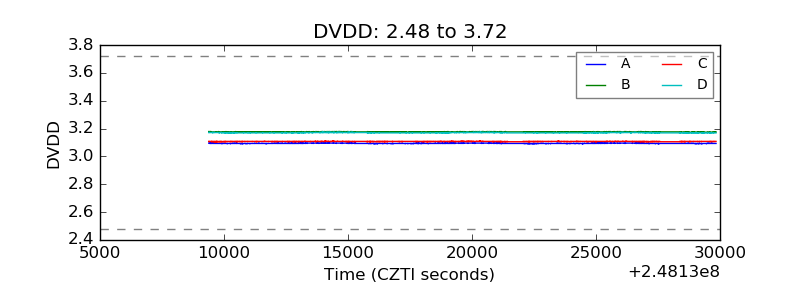 |
| Temperature 1 | 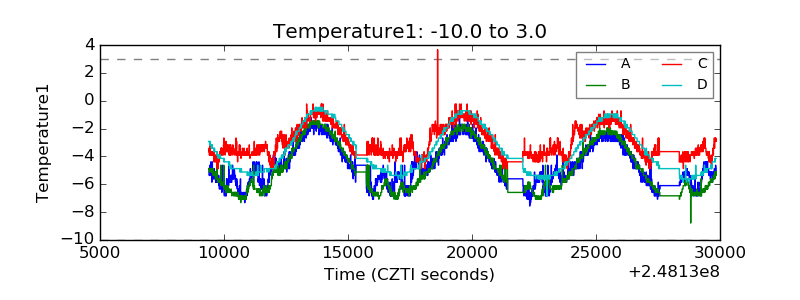 |
| Veto HV Monitor | 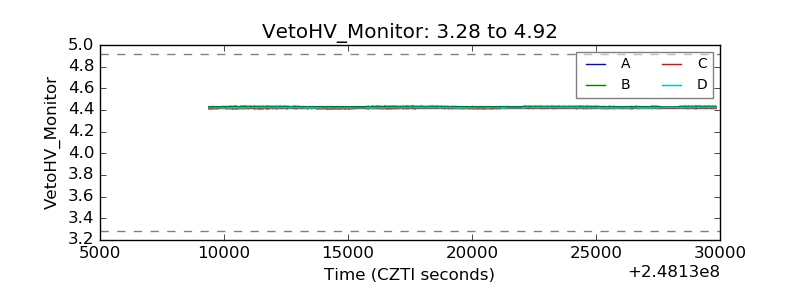 |
| Veto LLD | 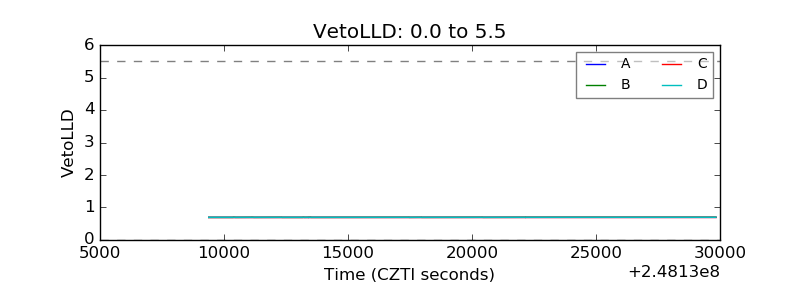 |
| Alpha Counter | 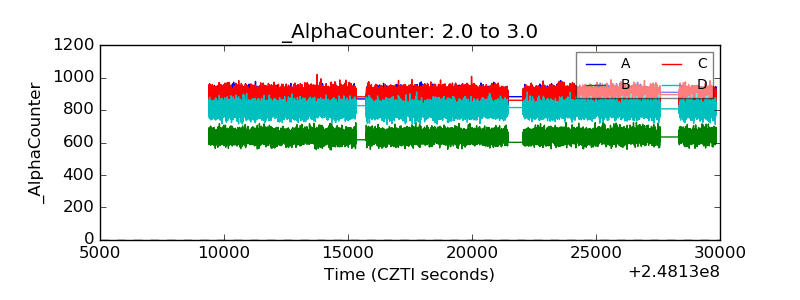 |
| _CPM_Rate | 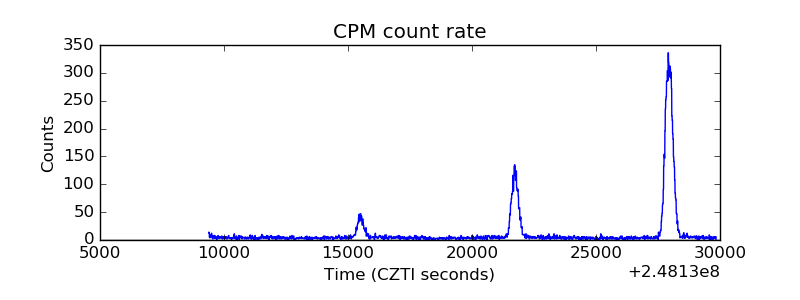 |
| CZT Counter | 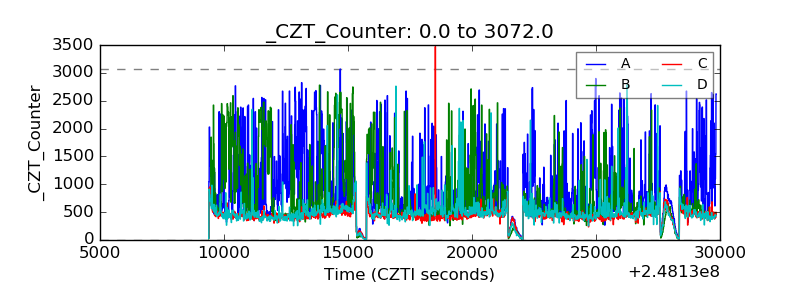 |
| +2.5 Volts monitor |  |
| +5 Volts monitor | 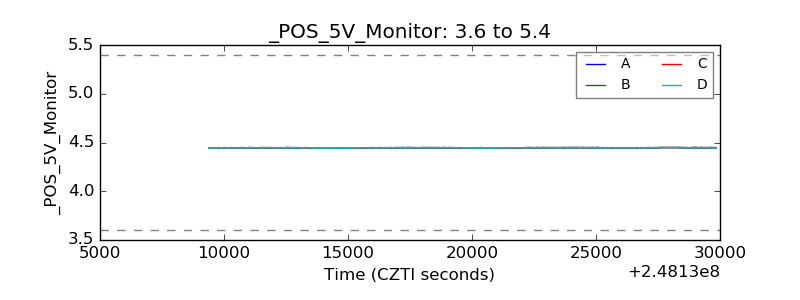 |
| _ROLL_ROT | 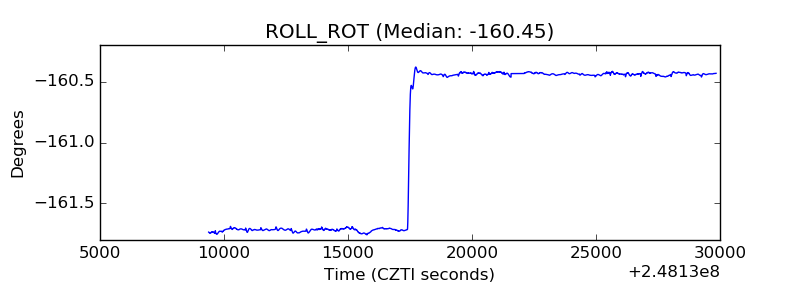 |
| _Roll_DEC | 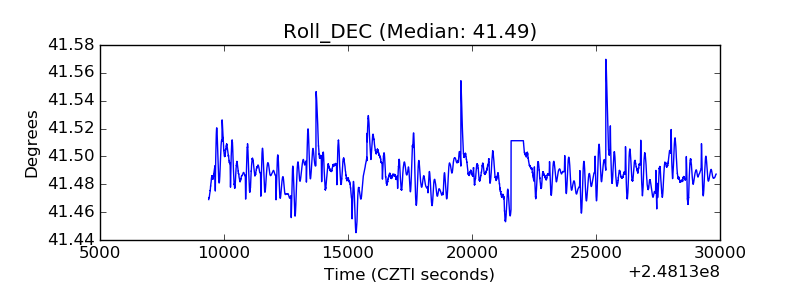 |
| _Roll_RA | 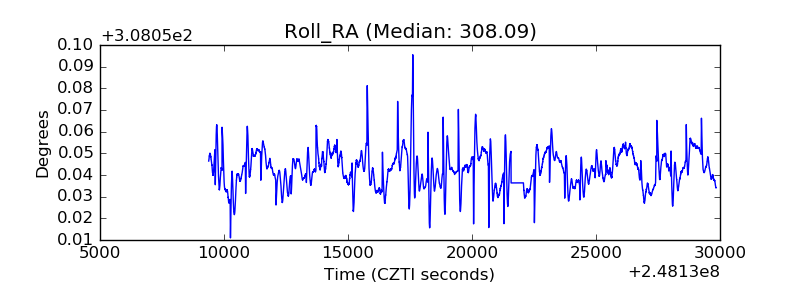 |
| Veto Counter | 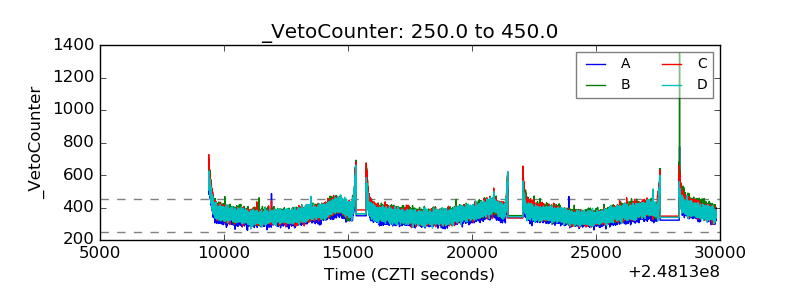 |