| Param | Original file | Final file |
|---|---|---|
| Filename | modeM0/AS1A04_107T01_9000001684_11487cztM0_level2.evt | modeM0/AS1A04_107T01_9000001684_11487cztM0_level2_quad_clean.evt |
| Size (bytes) | 678,902,400 | 85,052,160 |
| Size | 647.5 MB | 81.1 MB |
| Events in quadrant A | 8,523,955 | 474,192 |
| Events in quadrant B | 4,497,380 | 535,993 |
| Events in quadrant C | 3,252,860 | 545,359 |
| Events in quadrant D | 3,804,187 | 523,485 |
| Mode M9 | |||
|---|---|---|---|
| Quadrant | BADHDUFLAG | Total packets | Discarded packets |
| A | 0 | 17 | 0 |
| B | 0 | 17 | 0 |
| C | 0 | 17 | 0 |
| D | 0 | 17 | 0 |
| Mode SS | |||
|---|---|---|---|
| Quadrant | BADHDUFLAG | Total packets | Discarded packets |
| A | 0 | 146 | 0 |
| B | 0 | 146 | 0 |
| C | 0 | 146 | 0 |
| D | 0 | 146 | 0 |
| Mode M0 | |||
|---|---|---|---|
| Quadrant | BADHDUFLAG | Total packets | Discarded packets |
| A | 0 | 30226 | 3 |
| B | 0 | 17844 | 2 |
| C | 0 | 14534 | 2 |
| D | 0 | 16170 | 2 |
| Quadrant | Total seconds | Saturated seconds | Saturation percentage |
|---|---|---|---|
| A | 7123 | 1779 | 24.975432% |
| B | 7123 | 324 | 4.548645% |
| C | 7123 | 61 | 0.856381% |
| D | 7123 | 188 | 2.639337% |
Noise dominated data is calculated using 1-second bins in cleaned event files. If a bin has >2000 counts, and if more than 50% of those come from <1% of pixels, then it is considered to be noise-dominated and hence unusable.
| Quadrant | # 1 sec bins | Bins with >0 counts | Bins with >2000 counts | High rate bins dominated by noise | Noise dominated (total time) | Noise dominated (detector-on time) | Marked lightcurve |
|---|---|---|---|---|---|---|---|
| A | 8789 | 7126 | 1185 | 1185 | 13.48% | 16.63% | 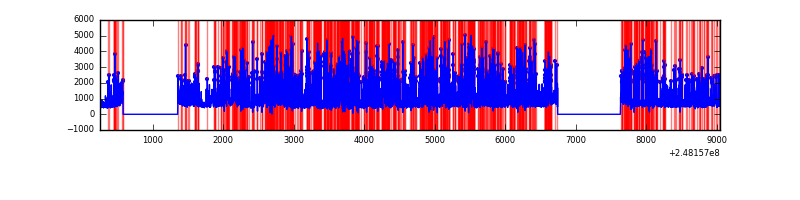 |
| B | 8789 | 7126 | 148 | 148 | 1.68% | 2.08% | 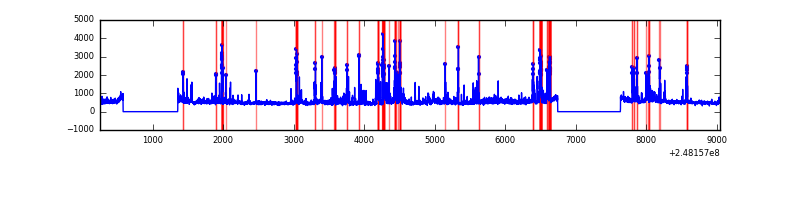 |
| C | 8789 | 7126 | 0 | 0 | 0.00% | 0.00% | 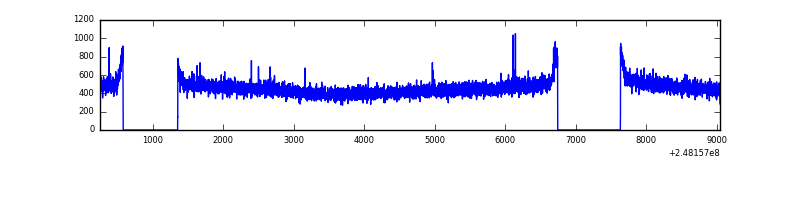 |
| D | 8789 | 7126 | 90 | 90 | 1.02% | 1.26% | 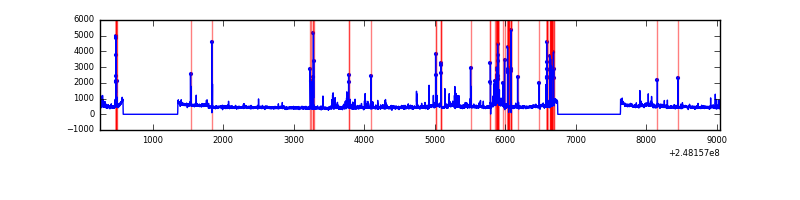 |
Top three noisy pixels from each quadrant. If the there are fewer than three noisy pixels in the level2.evt file, extra rows are filled as -1
| Pixel properties | Quadrant properties | ||||||
|---|---|---|---|---|---|---|---|
| Quadrant | DetID | PixID | Counts | Sigma | Mean | Median | Sigma |
| A | 8 | 5 | 5297837 | 33702.25 | 770 | 752 | 157.2 |
| A | 15 | 223 | 62496 | 392.84 | 770 | 752 | 157.2 |
| A | 1 | 162 | 43589 | 272.55 | 770 | 752 | 157.2 |
| B | 4 | 239 | 856885 | 5288.13 | 844 | 821 | 161.9 |
| B | 11 | 51 | 137738 | 845.77 | 844 | 821 | 161.9 |
| B | 15 | 204 | 99694 | 610.76 | 844 | 821 | 161.9 |
| C | 12 | 4 | 9233 | 43.61 | 830 | 834 | 192.6 |
| C | 14 | 67 | 6746 | 30.69 | 830 | 834 | 192.6 |
| C | 13 | 61 | 6018 | 26.91 | 830 | 834 | 192.6 |
| D | 1 | 52 | 470416 | 2367.06 | 822 | 798 | 198.4 |
| D | 2 | 120 | 67154 | 334.46 | 822 | 798 | 198.4 |
| D | 10 | 253 | 57170 | 284.14 | 822 | 798 | 198.4 |
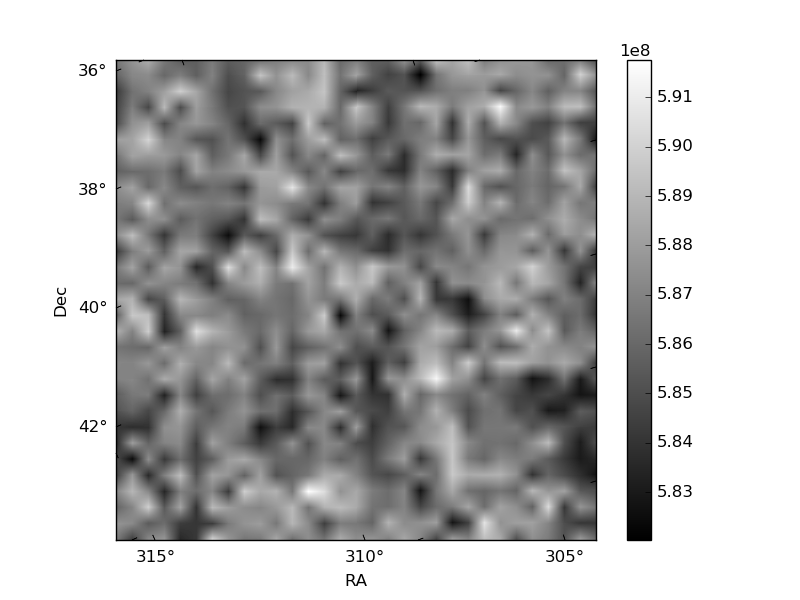
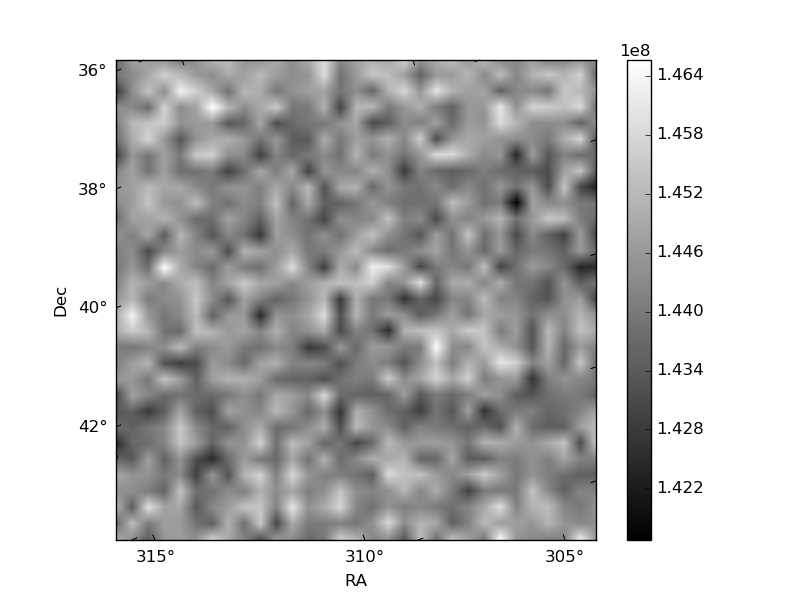
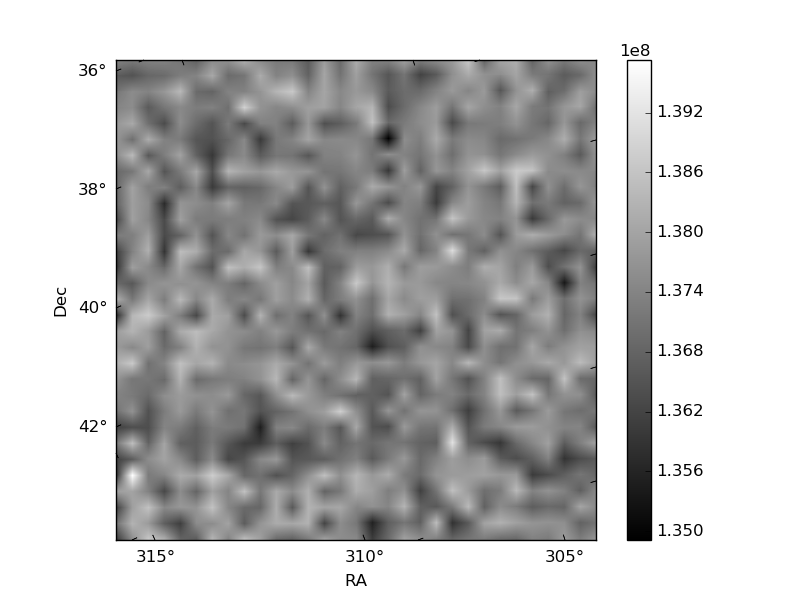
Histogram calculated using DETX and DETY for each event in the final _common_clean file
| Quadrant A | 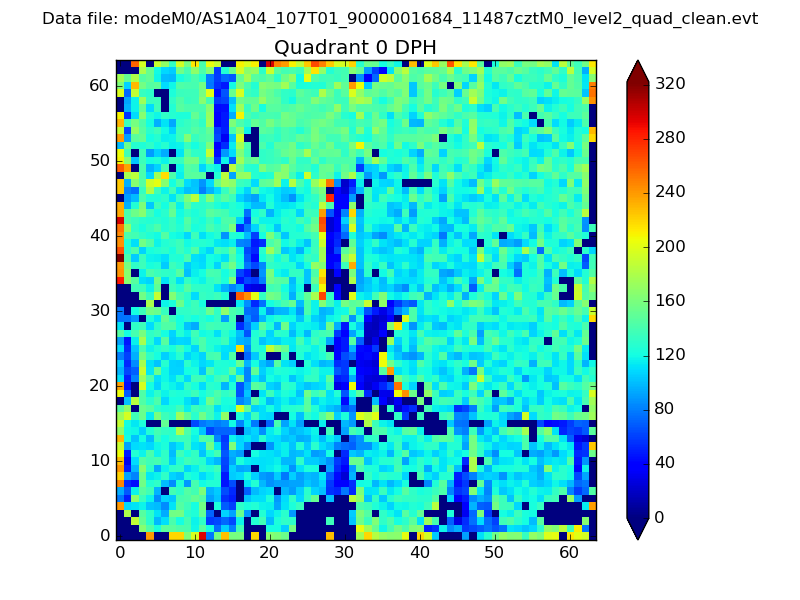 |
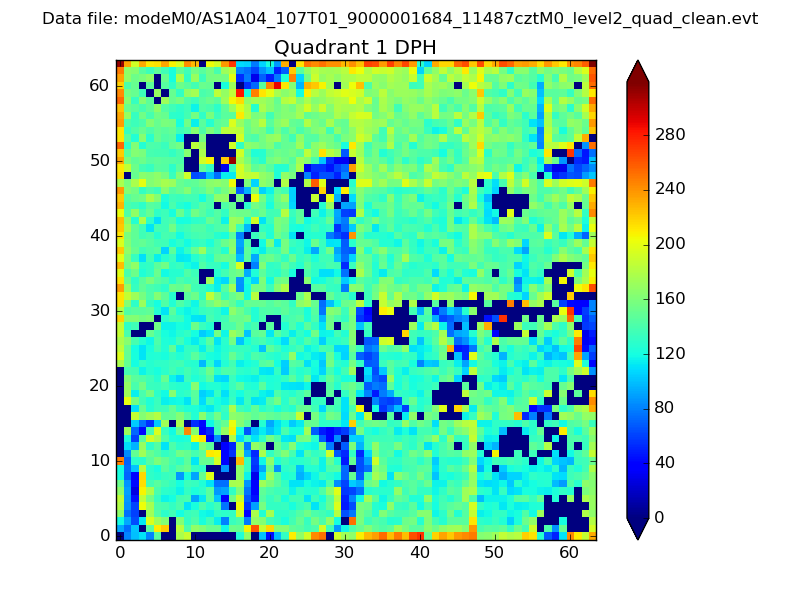 |
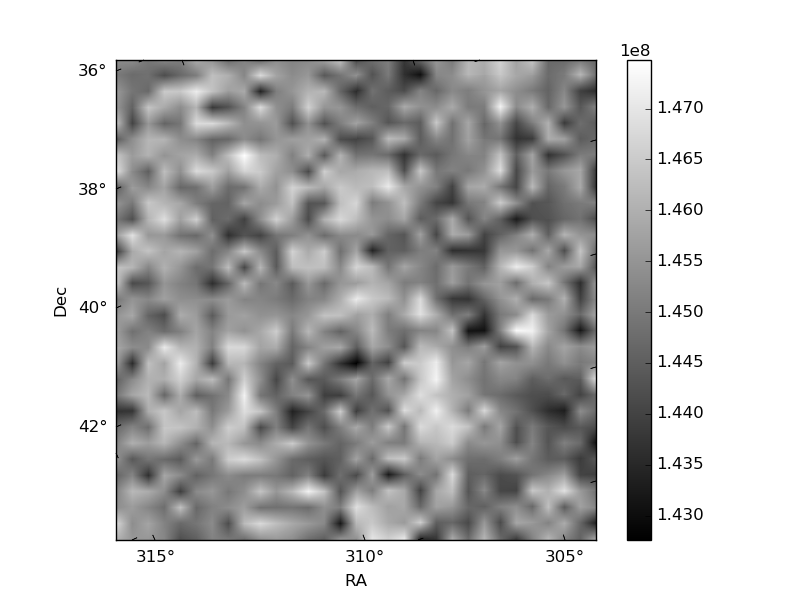
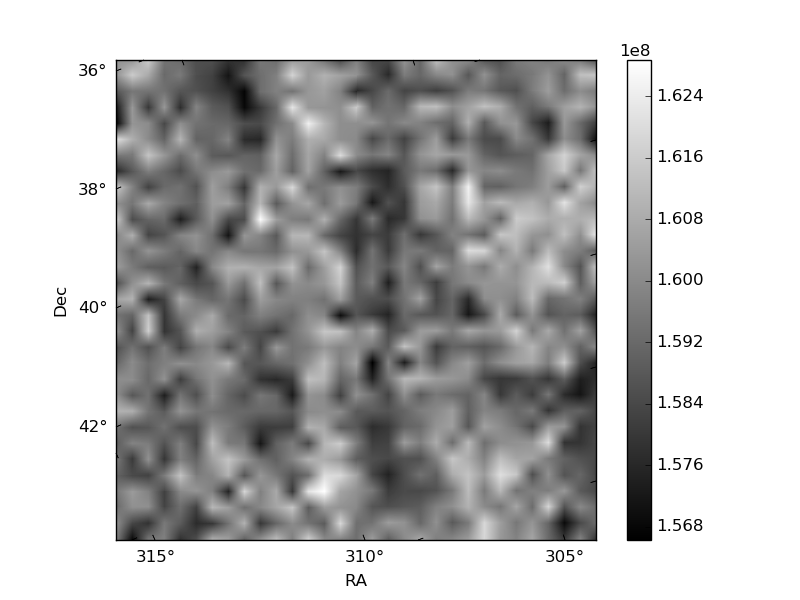
Quadrant B |
|---|---|---|---|
| Quadrant D | 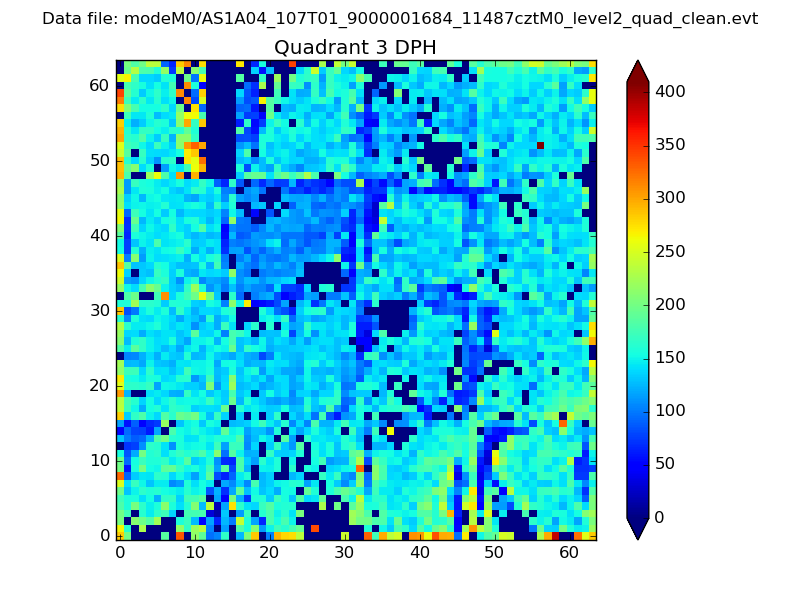 |
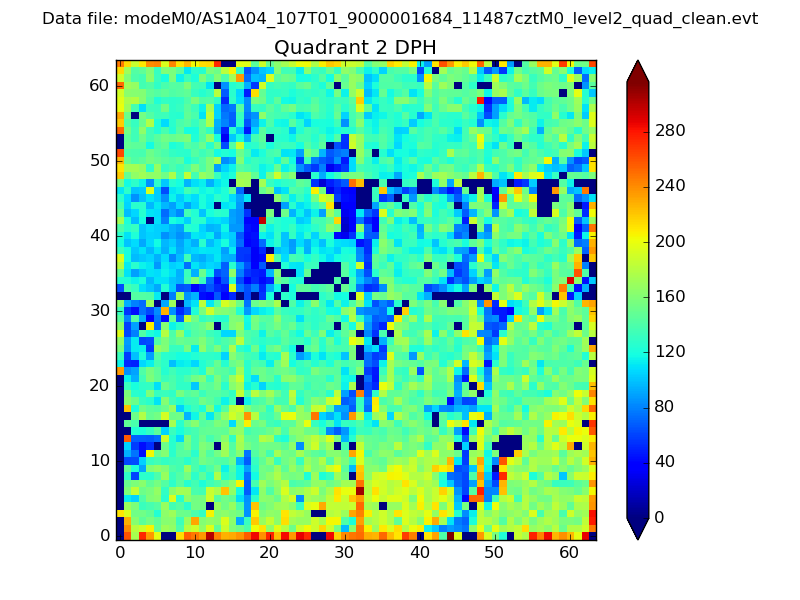 |
Quadrant C |
| Plot type | Count rate plots | Images |
|---|---|---|
| Comparison with Poisson distribution Blue bars denote a histogram of data divided into 1 sec bins. Red curve is a Poisson curve with rate = median count rate of data. |
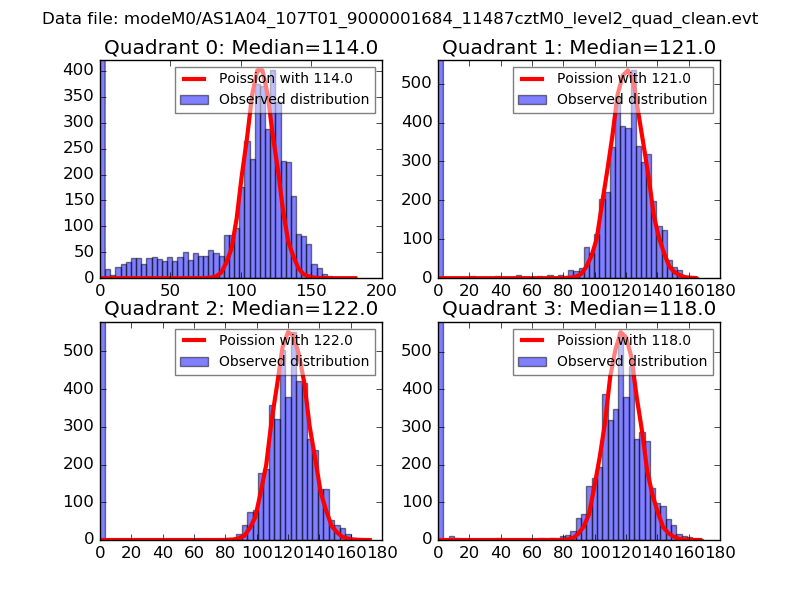 |
 |
| Quadrant-wise count rates Data is divided into 100 sec bins |
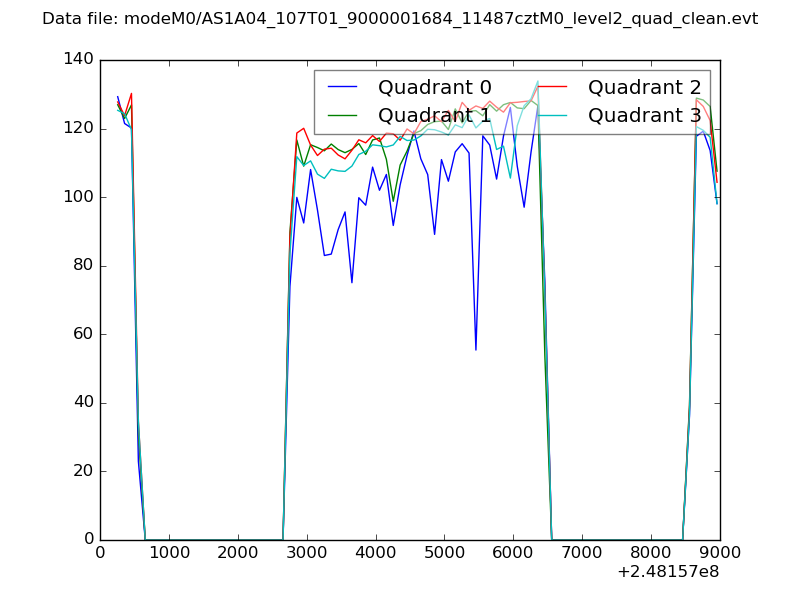 |
|
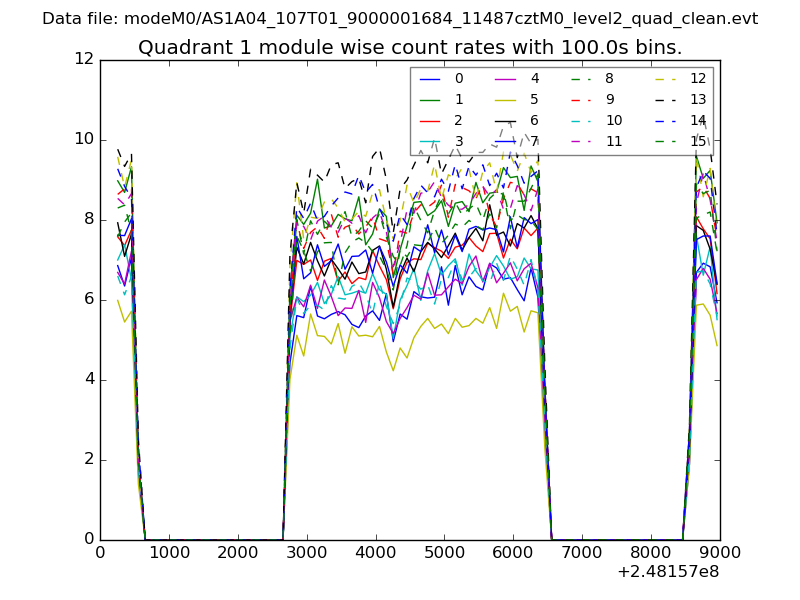
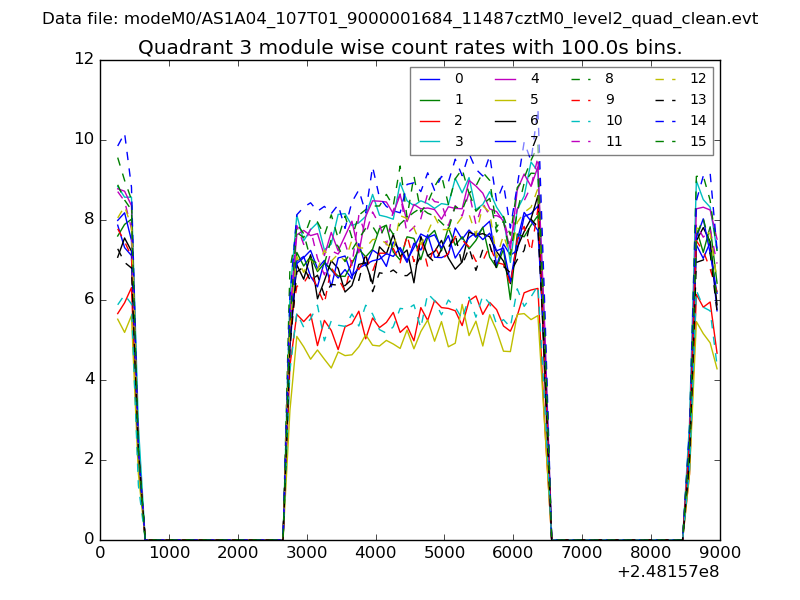
| Module-wise count rates for Quadrant A Data is divided into 100 sec bins |
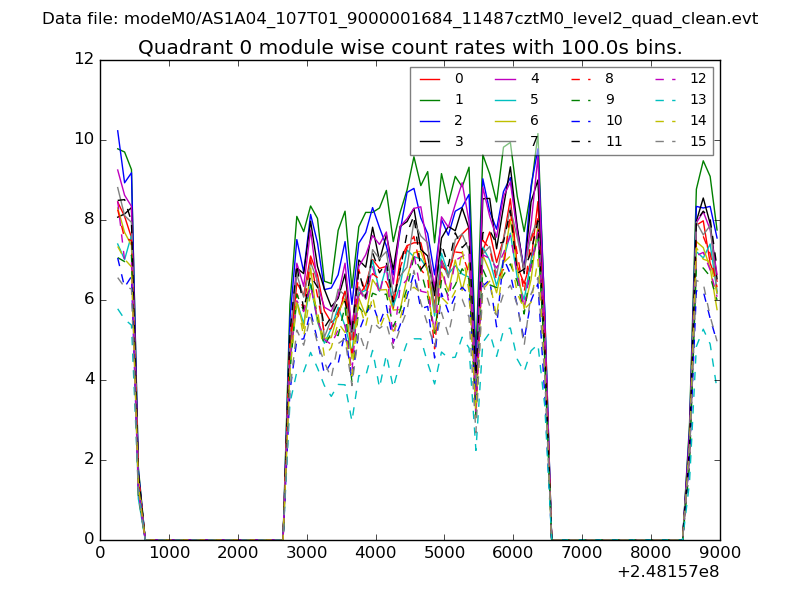 |
 |
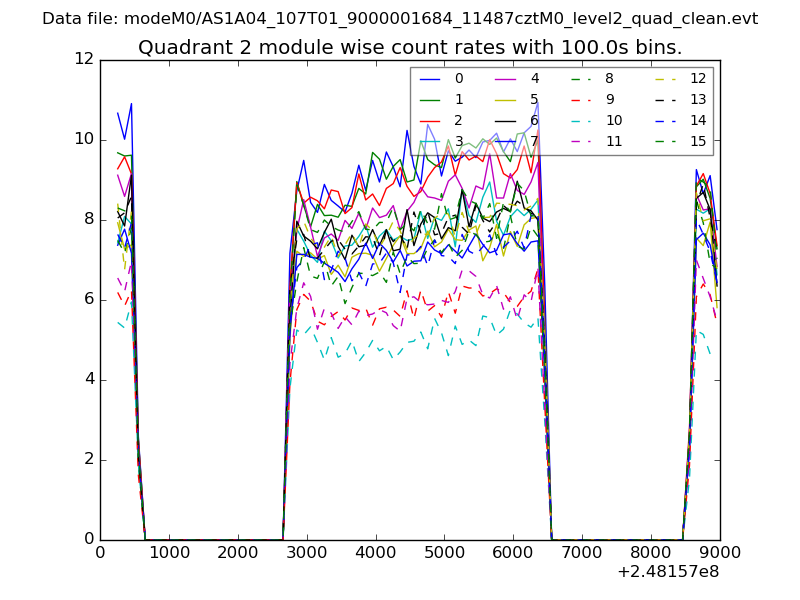
| Module-wise count rates for Quadrant B Data is divided into 100 sec bins |
 |
 |
| Module-wise count rates for Quadrant C Data is divided into 100 sec bins |
 |
 |
| Module-wise count rates for Quadrant D Data is divided into 100 sec bins |
 |
 |
| Parameter | Plot |
|---|---|
| CZT HV Monitor | 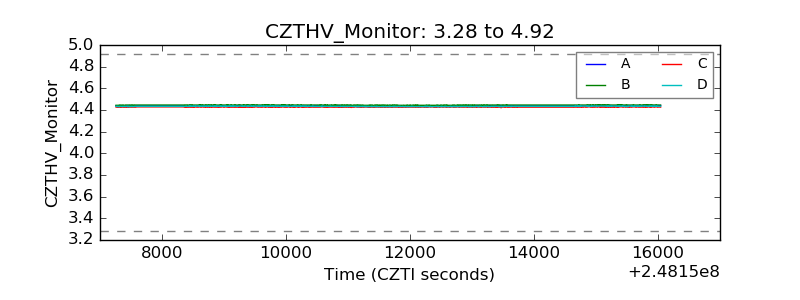 |
| D_VDD | 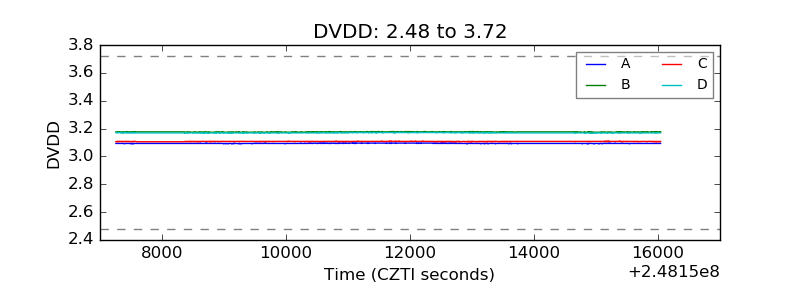 |
| Temperature 1 | 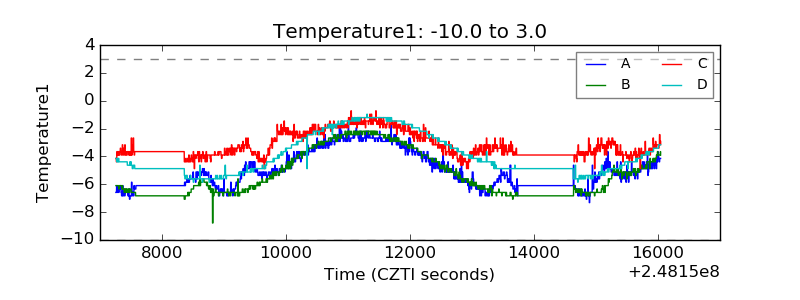 |
| Veto HV Monitor | 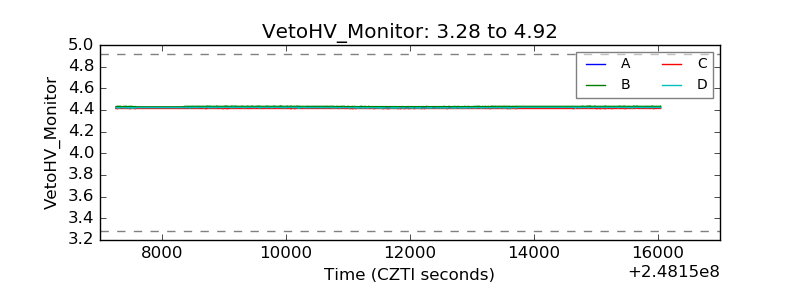 |
| Veto LLD | 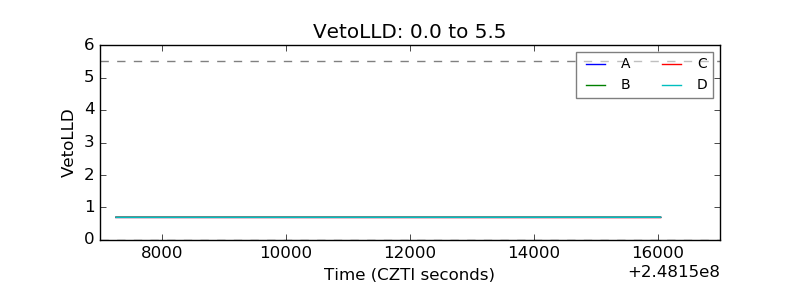 |
| Alpha Counter | 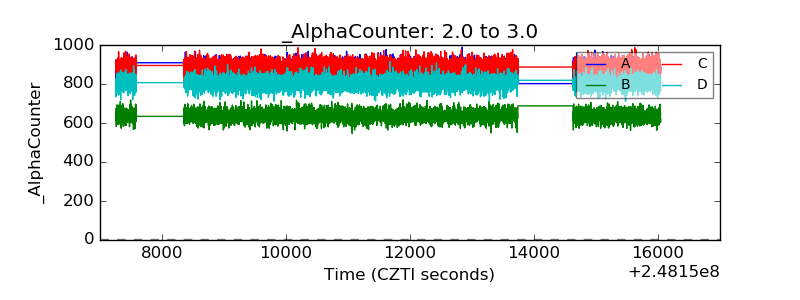 |
| _CPM_Rate | 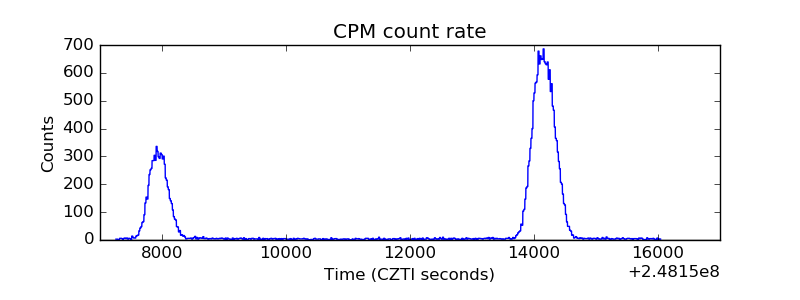 |
| CZT Counter | 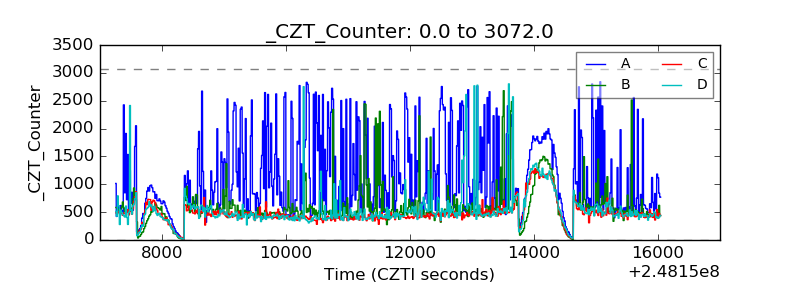 |
| +2.5 Volts monitor | 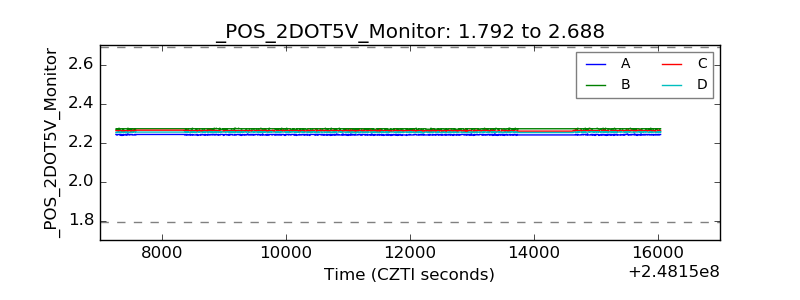 |
| +5 Volts monitor | 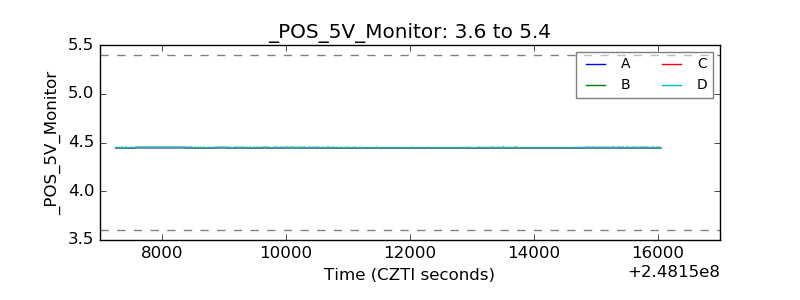 |
| _ROLL_ROT | 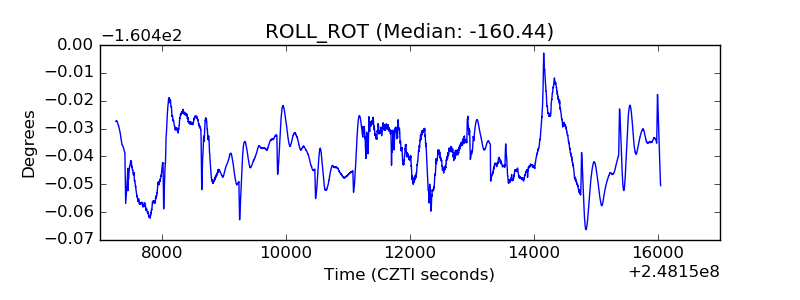 |
| _Roll_DEC | 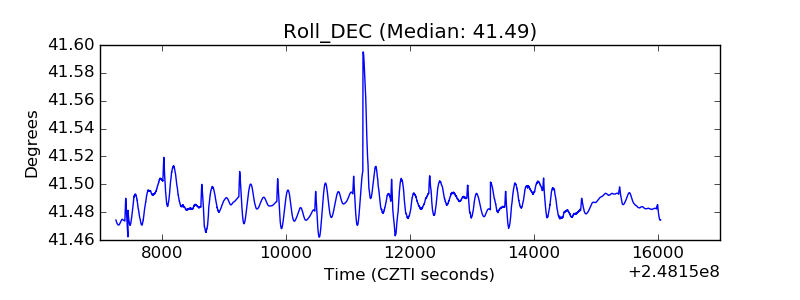 |
| _Roll_RA | 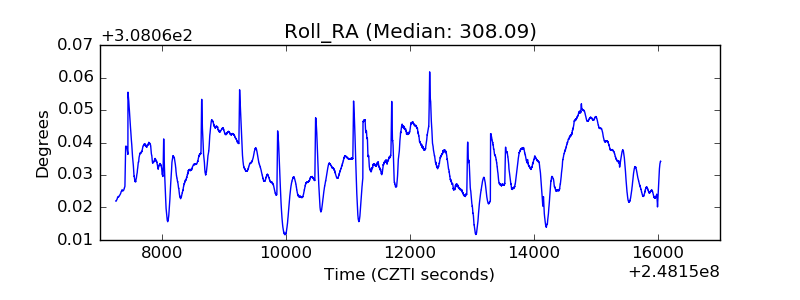 |
| Veto Counter | 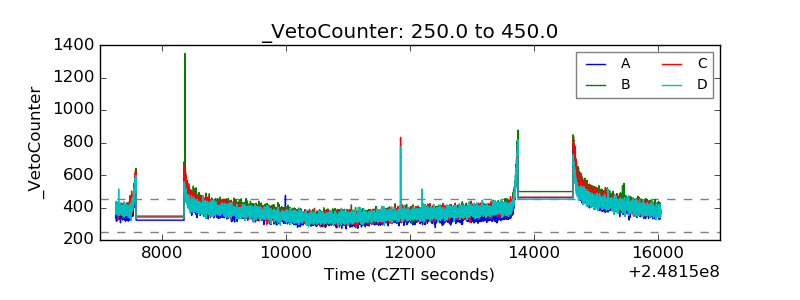 |