| Param | Original file | Final file |
|---|---|---|
| Filename | modeM0/AS1A04_107T01_9000001684_11490cztM0_level2.evt | modeM0/AS1A04_107T01_9000001684_11490cztM0_level2_quad_clean.evt |
| Size (bytes) | 585,400,320 | 99,025,920 |
| Size | 558.3 MB | 94.4 MB |
| Events in quadrant A | 6,321,737 | 611,344 |
| Events in quadrant B | 3,995,457 | 662,494 |
| Events in quadrant C | 3,008,345 | 653,223 |
| Events in quadrant D | 3,967,708 | 623,182 |
| Mode M9 | |||
|---|---|---|---|
| Quadrant | BADHDUFLAG | Total packets | Discarded packets |
| A | 0 | 16 | 0 |
| B | 0 | 16 | 0 |
| C | 0 | 16 | 0 |
| D | 0 | 17 | 0 |
| Mode SS | |||
|---|---|---|---|
| Quadrant | BADHDUFLAG | Total packets | Discarded packets |
| A | 0 | 130 | 0 |
| B | 0 | 130 | 0 |
| C | 0 | 130 | 0 |
| D | 0 | 130 | 0 |
| Mode M0 | |||
|---|---|---|---|
| Quadrant | BADHDUFLAG | Total packets | Discarded packets |
| A | 0 | 23246 | 3 |
| B | 0 | 16107 | 2 |
| C | 0 | 13265 | 2 |
| D | 0 | 15921 | 2 |
| Quadrant | Total seconds | Saturated seconds | Saturation percentage |
|---|---|---|---|
| A | 6430 | 1086 | 16.889580% |
| B | 6430 | 215 | 3.343701% |
| C | 6430 | 47 | 0.730949% |
| D | 6430 | 176 | 2.737170% |
Noise dominated data is calculated using 1-second bins in cleaned event files. If a bin has >2000 counts, and if more than 50% of those come from <1% of pixels, then it is considered to be noise-dominated and hence unusable.
| Quadrant | # 1 sec bins | Bins with >0 counts | Bins with >2000 counts | High rate bins dominated by noise | Noise dominated (total time) | Noise dominated (detector-on time) | Marked lightcurve |
|---|---|---|---|---|---|---|---|
| A | 7586 | 6431 | 639 | 639 | 8.42% | 9.94% | 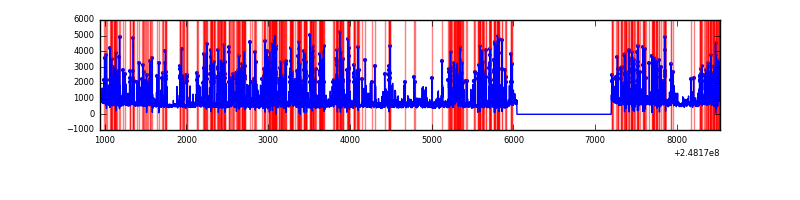 |
| B | 7586 | 6432 | 86 | 86 | 1.13% | 1.34% | 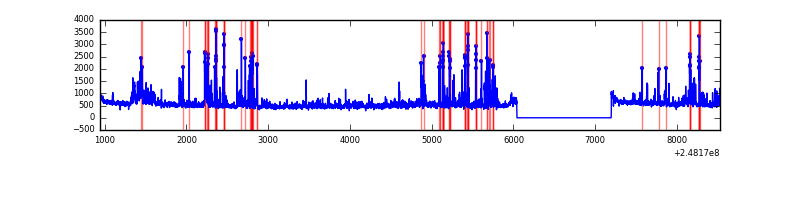 |
| C | 7586 | 6432 | 0 | 0 | 0.00% | 0.00% | 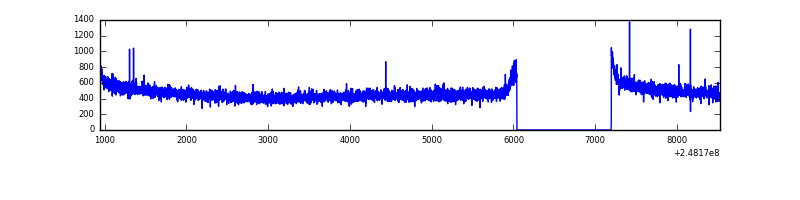 |
| D | 7586 | 6431 | 99 | 99 | 1.31% | 1.54% | 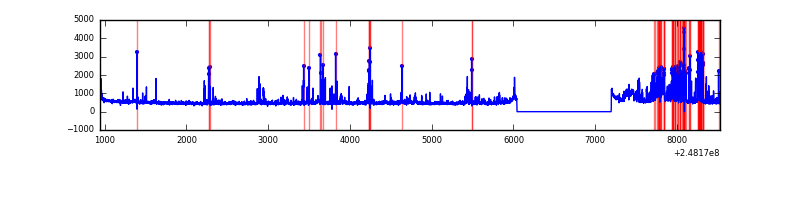 |
Top three noisy pixels from each quadrant. If the there are fewer than three noisy pixels in the level2.evt file, extra rows are filled as -1
| Pixel properties | Quadrant properties | ||||||
|---|---|---|---|---|---|---|---|
| Quadrant | DetID | PixID | Counts | Sigma | Mean | Median | Sigma |
| A | 8 | 5 | 3235244 | 21515.37 | 751 | 740 | 150.3 |
| A | 9 | 143 | 54043 | 354.56 | 751 | 740 | 150.3 |
| A | 15 | 223 | 37890 | 247.12 | 751 | 740 | 150.3 |
| B | 4 | 239 | 638811 | 4219.13 | 794 | 776 | 151.2 |
| B | 11 | 51 | 162168 | 1067.24 | 794 | 776 | 151.2 |
| B | 0 | 214 | 44894 | 291.74 | 794 | 776 | 151.2 |
| C | 13 | 61 | 5711 | 27.94 | 770 | 776 | 176.6 |
| C | 12 | 4 | 3374 | 14.71 | 770 | 776 | 176.6 |
| C | 14 | 67 | 2430 | 9.36 | 770 | 776 | 176.6 |
| D | 1 | 52 | 638914 | 3466.5 | 771 | 749 | 184.1 |
| D | 2 | 120 | 107892 | 582.0 | 771 | 749 | 184.1 |
| D | 13 | 152 | 99802 | 538.05 | 771 | 749 | 184.1 |
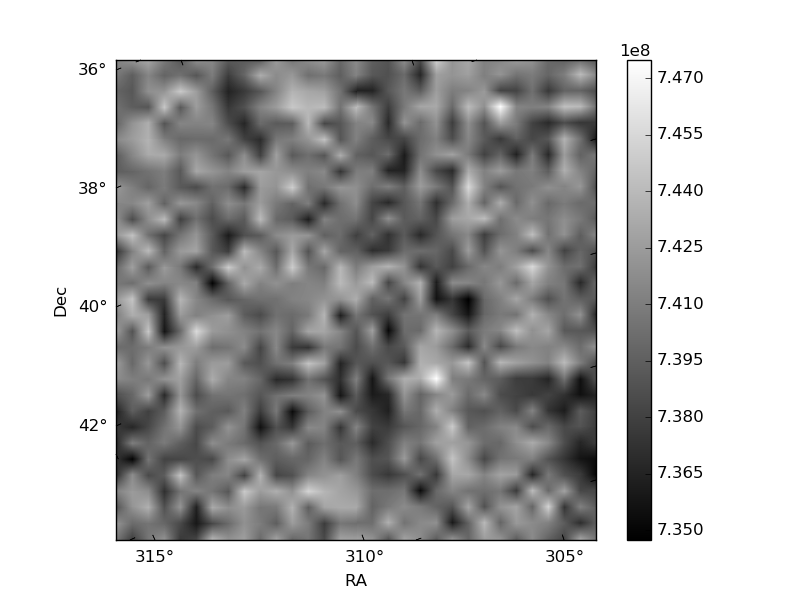
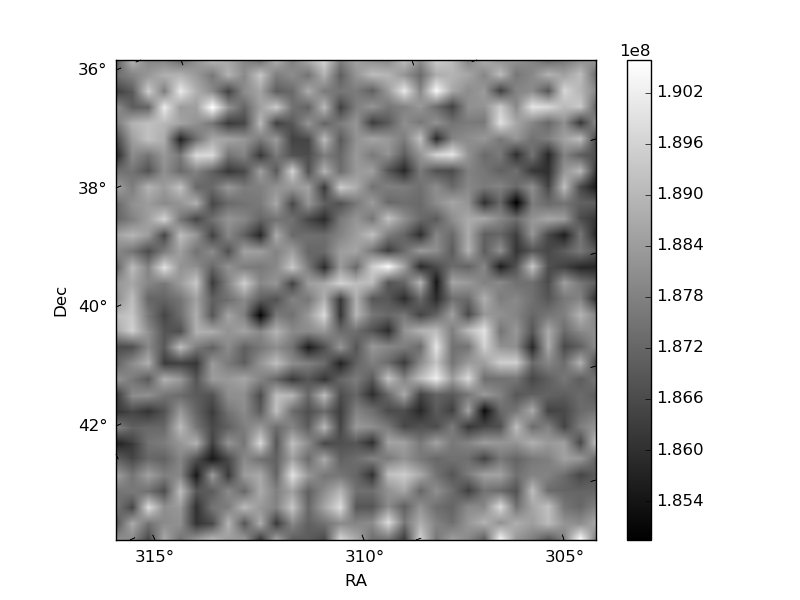
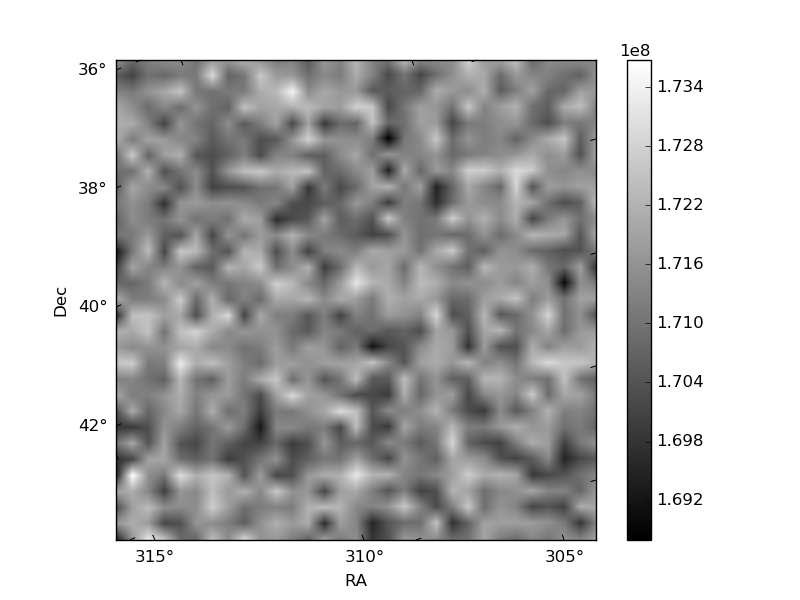
Histogram calculated using DETX and DETY for each event in the final _common_clean file
| Quadrant A | 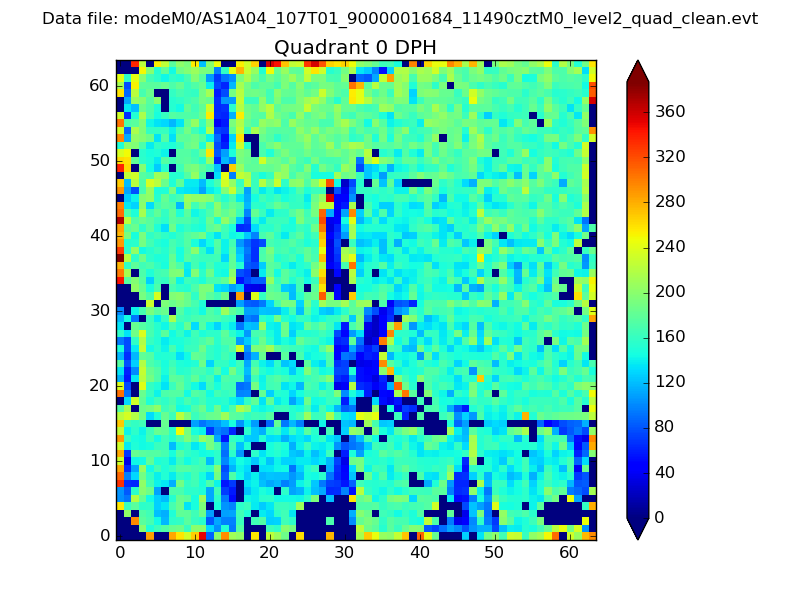 |
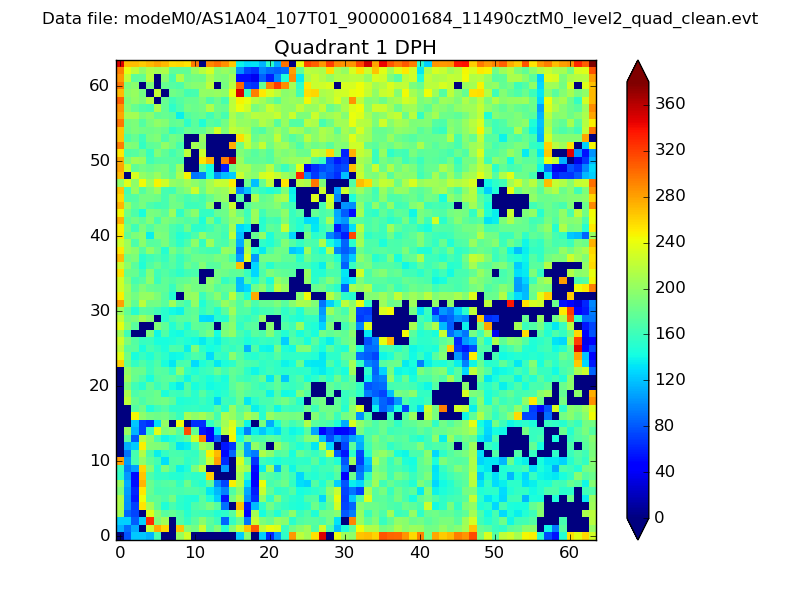 |
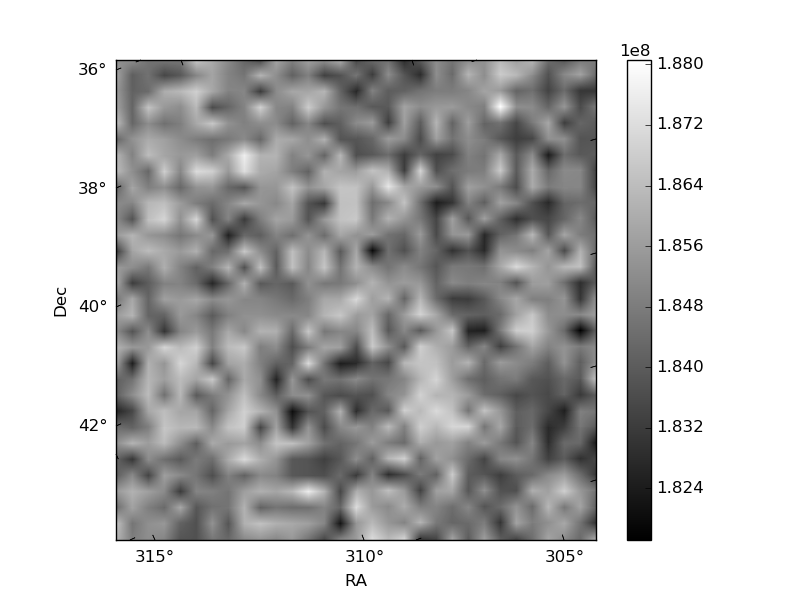
Quadrant B |
|---|---|---|---|
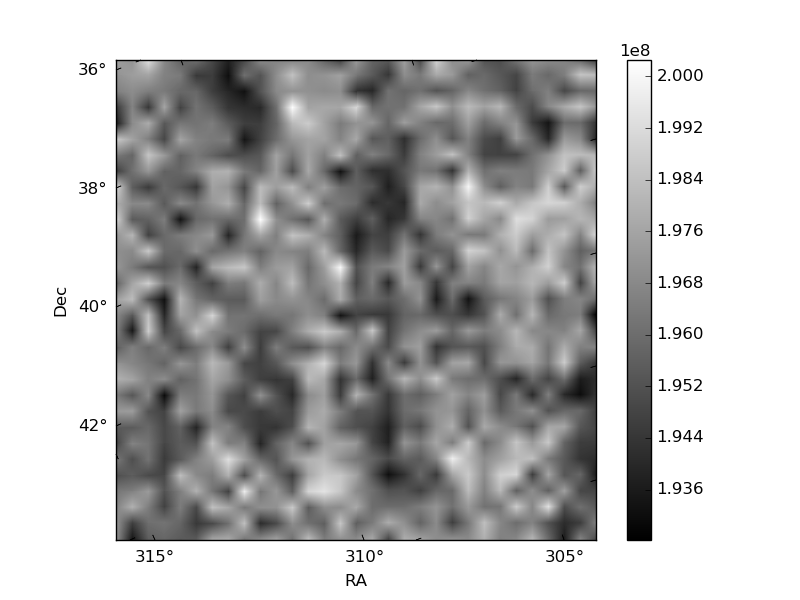
| Quadrant D | 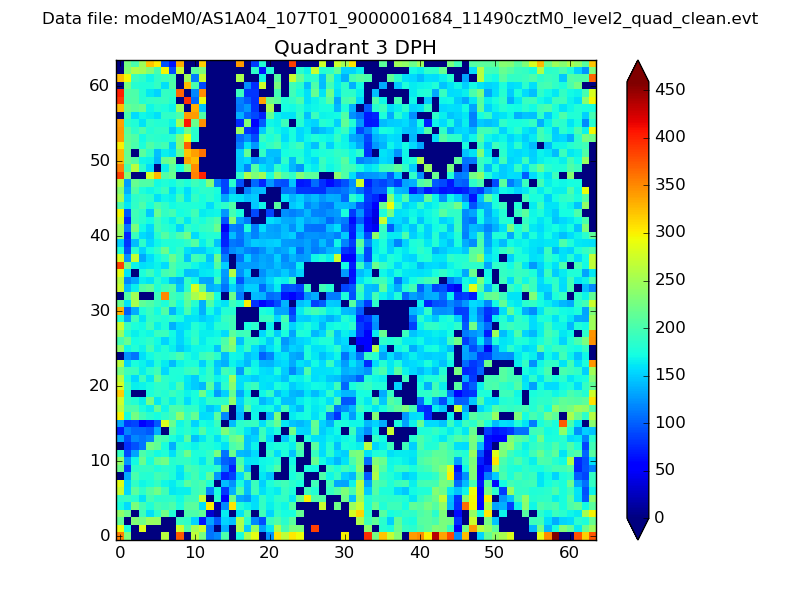 |
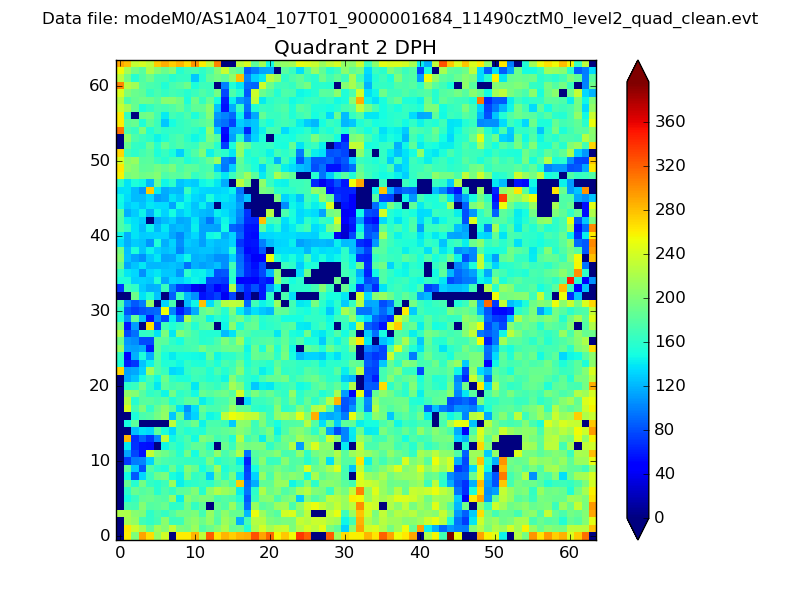 |
Quadrant C |
| Plot type | Count rate plots | Images |
|---|---|---|
| Comparison with Poisson distribution Blue bars denote a histogram of data divided into 1 sec bins. Red curve is a Poisson curve with rate = median count rate of data. |
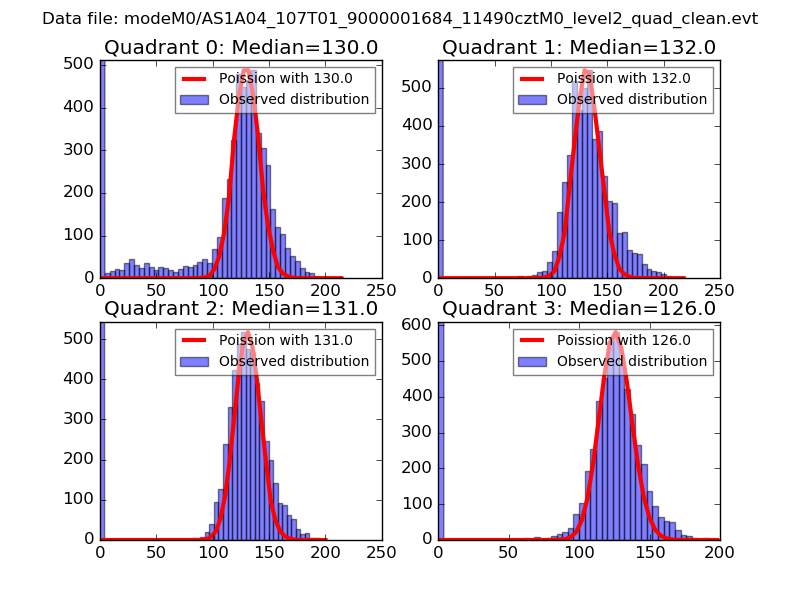 |
 |
| Quadrant-wise count rates Data is divided into 100 sec bins |
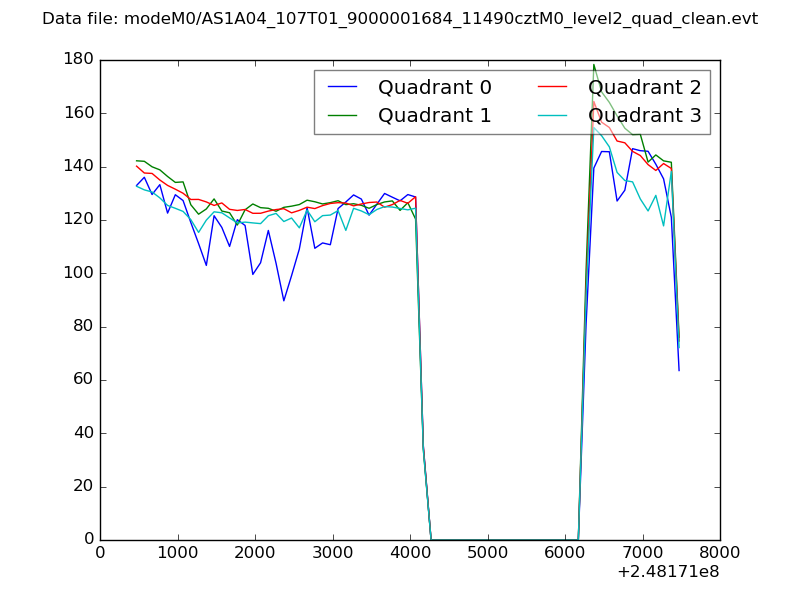 |
|
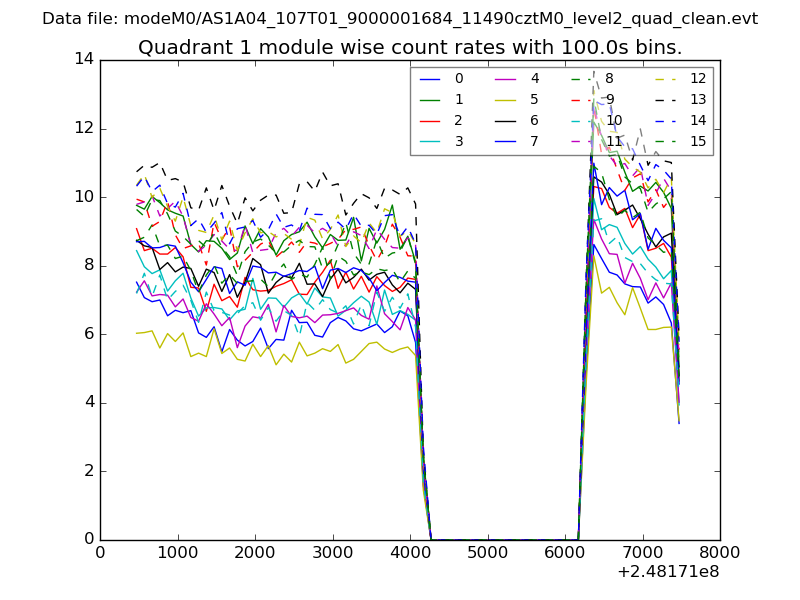
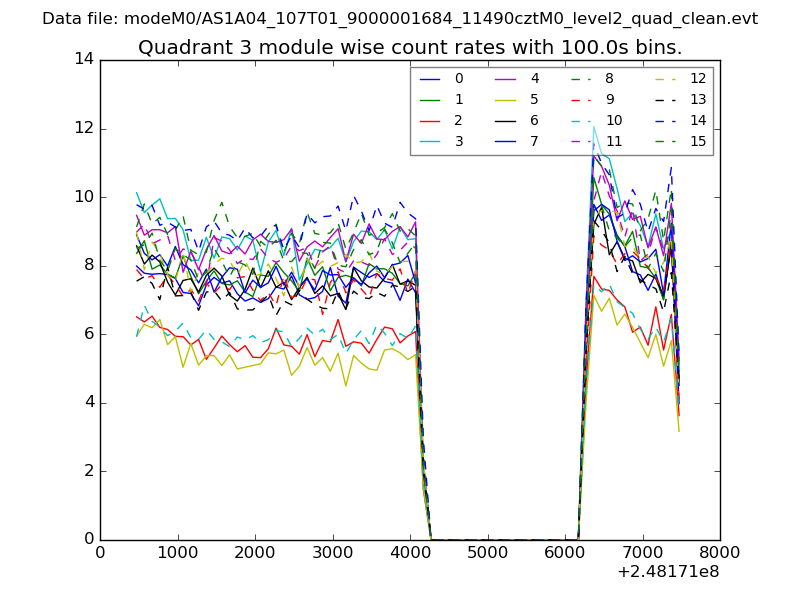
| Module-wise count rates for Quadrant A Data is divided into 100 sec bins |
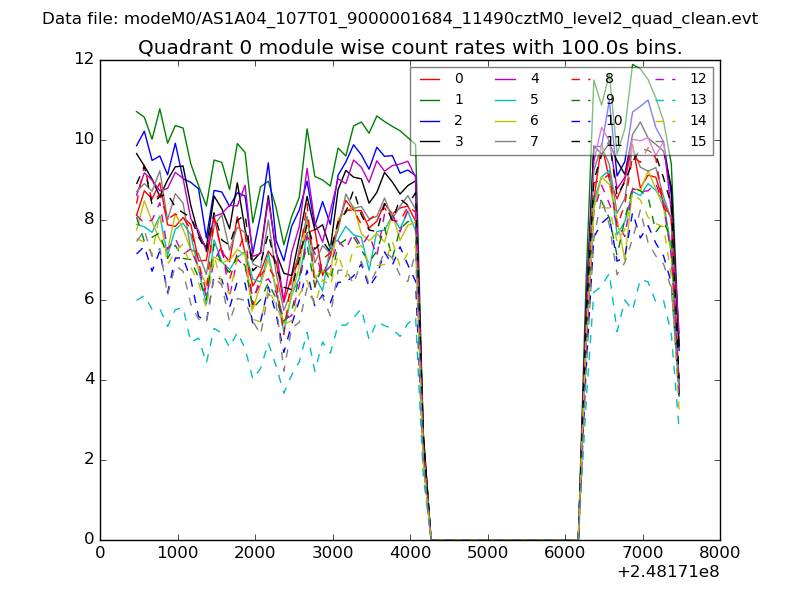 |
 |
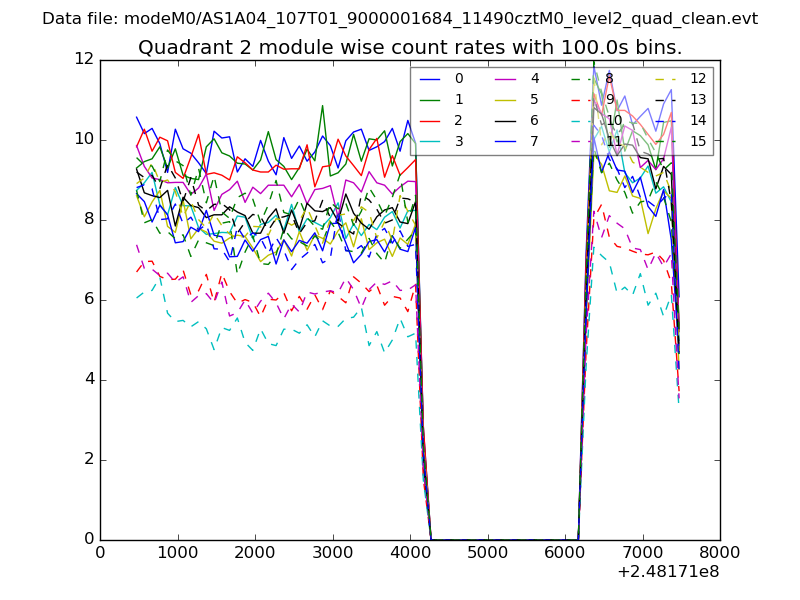
| Module-wise count rates for Quadrant B Data is divided into 100 sec bins |
 |
 |
| Module-wise count rates for Quadrant C Data is divided into 100 sec bins |
 |
 |
| Module-wise count rates for Quadrant D Data is divided into 100 sec bins |
 |
 |
| Parameter | Plot |
|---|---|
| CZT HV Monitor | 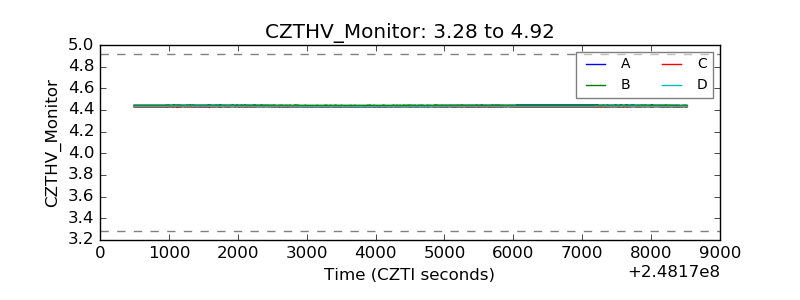 |
| D_VDD | 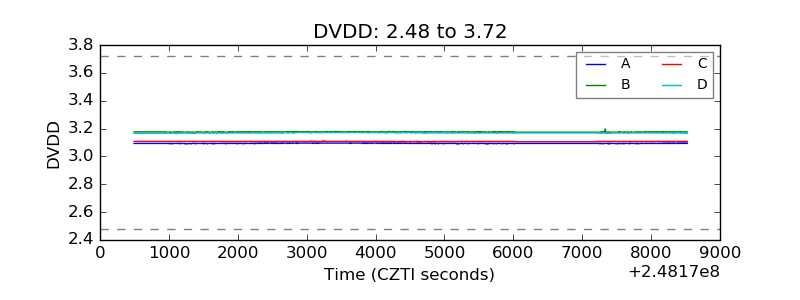 |
| Temperature 1 | 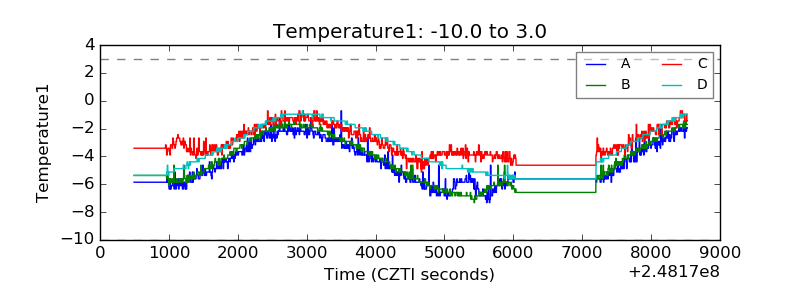 |
| Veto HV Monitor | 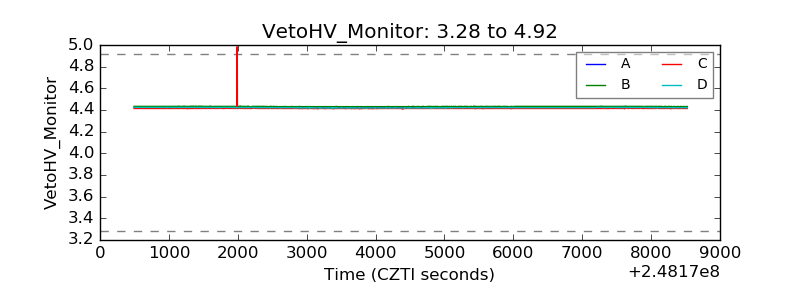 |
| Veto LLD | 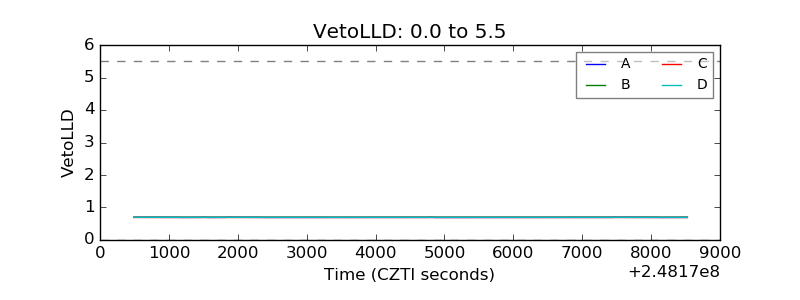 |
| Alpha Counter | 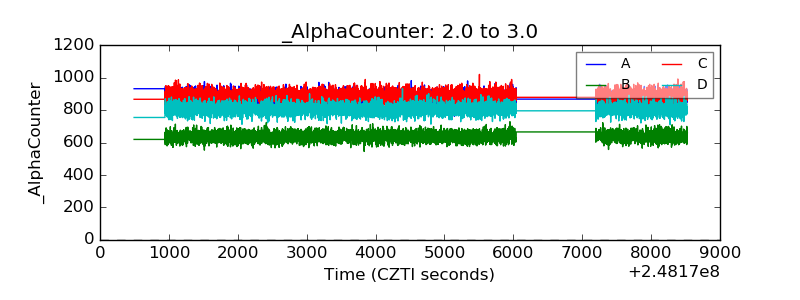 |
| _CPM_Rate | 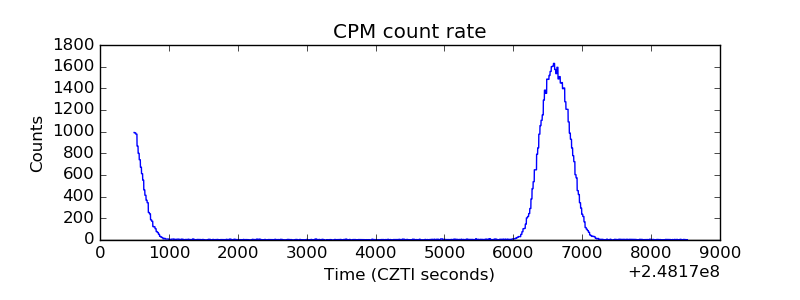 |
| CZT Counter | 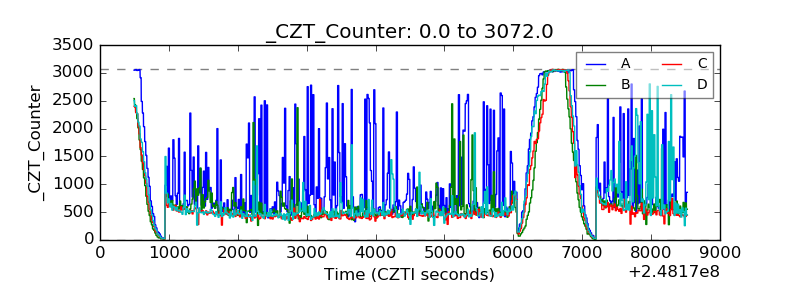 |
| +2.5 Volts monitor |  |
| +5 Volts monitor |  |
| _ROLL_ROT | 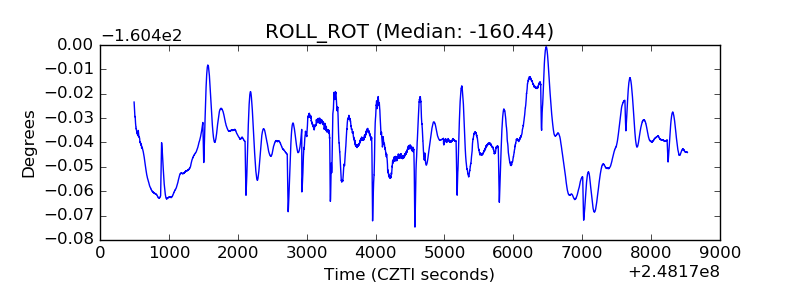 |
| _Roll_DEC | 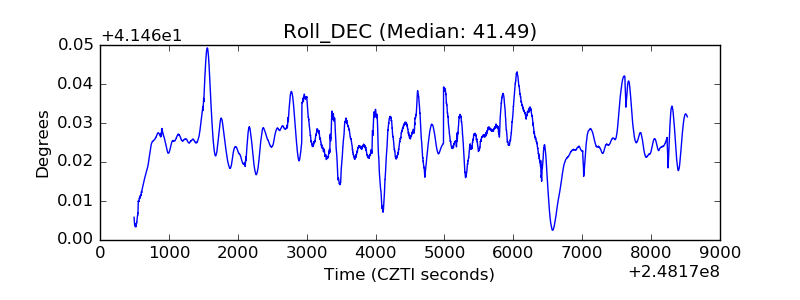 |
| _Roll_RA | 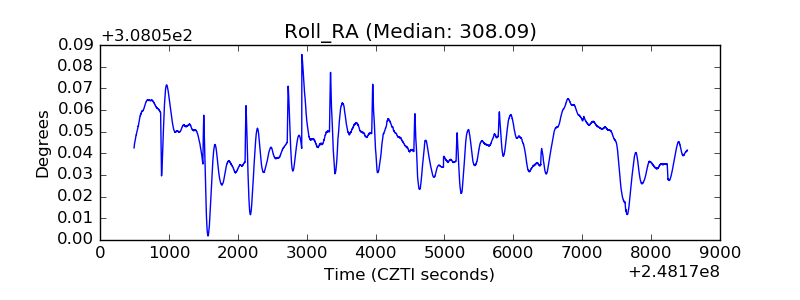 |
| Veto Counter | 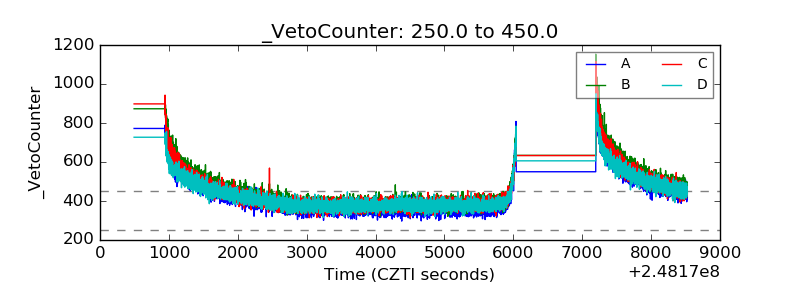 |