| Param | Original file | Final file |
|---|---|---|
| Filename | modeM0/AS1A04_107T01_9000001684_11492cztM0_level2.evt | modeM0/AS1A04_107T01_9000001684_11492cztM0_level2_quad_clean.evt |
| Size (bytes) | 621,967,680 | 95,682,240 |
| Size | 593.2 MB | 91.2 MB |
| Events in quadrant A | 6,901,487 | 580,819 |
| Events in quadrant B | 4,095,178 | 645,026 |
| Events in quadrant C | 2,862,480 | 639,751 |
| Events in quadrant D | 4,568,412 | 609,498 |
| Mode M9 | |||
|---|---|---|---|
| Quadrant | BADHDUFLAG | Total packets | Discarded packets |
| A | 0 | 13 | 0 |
| B | 0 | 13 | 0 |
| C | 0 | 13 | 0 |
| D | 0 | 13 | 0 |
| Mode SS | |||
|---|---|---|---|
| Quadrant | BADHDUFLAG | Total packets | Discarded packets |
| A | 0 | 122 | 0 |
| B | 0 | 122 | 0 |
| C | 0 | 122 | 0 |
| D | 0 | 122 | 0 |
| Mode M0 | |||
|---|---|---|---|
| Quadrant | BADHDUFLAG | Total packets | Discarded packets |
| A | 0 | 24663 | 2 |
| B | 0 | 16089 | 1 |
| C | 0 | 12391 | 1 |
| D | 0 | 17375 | 1 |
| Quadrant | Total seconds | Saturated seconds | Saturation percentage |
|---|---|---|---|
| A | 6046 | 1306 | 21.601059% |
| B | 6046 | 302 | 4.995038% |
| C | 6046 | 31 | 0.512736% |
| D | 6046 | 252 | 4.168045% |
Noise dominated data is calculated using 1-second bins in cleaned event files. If a bin has >2000 counts, and if more than 50% of those come from <1% of pixels, then it is considered to be noise-dominated and hence unusable.
| Quadrant | # 1 sec bins | Bins with >0 counts | Bins with >2000 counts | High rate bins dominated by noise | Noise dominated (total time) | Noise dominated (detector-on time) | Marked lightcurve |
|---|---|---|---|---|---|---|---|
| A | 7347 | 6047 | 893 | 893 | 12.15% | 14.77% | 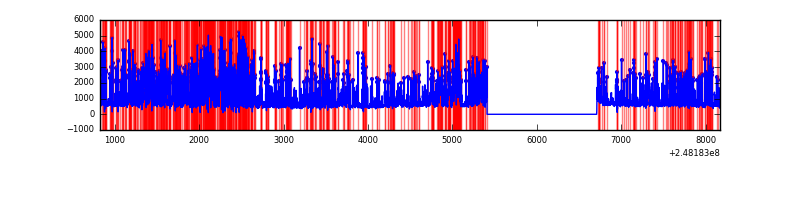 |
| B | 7347 | 6048 | 168 | 168 | 2.29% | 2.78% | 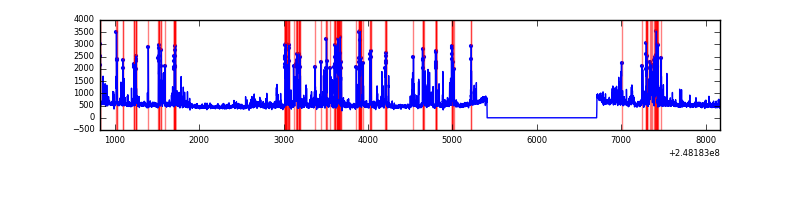 |
| C | 7347 | 6048 | 0 | 0 | 0.00% | 0.00% | 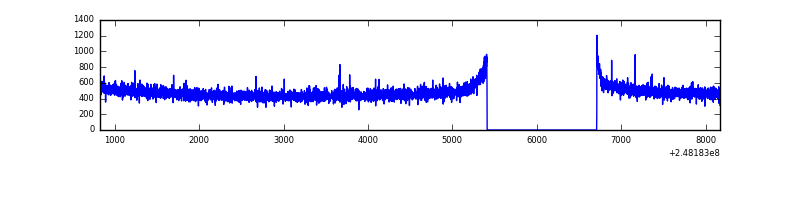 |
| D | 7347 | 6048 | 193 | 193 | 2.63% | 3.19% |  |
Top three noisy pixels from each quadrant. If the there are fewer than three noisy pixels in the level2.evt file, extra rows are filled as -1
| Pixel properties | Quadrant properties | ||||||
|---|---|---|---|---|---|---|---|
| Quadrant | DetID | PixID | Counts | Sigma | Mean | Median | Sigma |
| A | 8 | 5 | 4122008 | 29382.0 | 696 | 685 | 140.3 |
| A | 9 | 143 | 30830 | 214.91 | 696 | 685 | 140.3 |
| A | 1 | 162 | 16347 | 111.66 | 696 | 685 | 140.3 |
| B | 4 | 239 | 957424 | 6890.78 | 744 | 728 | 138.8 |
| B | 11 | 51 | 171541 | 1230.31 | 744 | 728 | 138.8 |
| B | 0 | 214 | 29217 | 205.2 | 744 | 728 | 138.8 |
| C | 13 | 61 | 5274 | 26.95 | 733 | 739 | 168.3 |
| C | 14 | 67 | 3390 | 15.75 | 733 | 739 | 168.3 |
| C | 12 | 4 | 3048 | 13.72 | 733 | 739 | 168.3 |
| D | 1 | 52 | 1197019 | 6951.88 | 732 | 717 | 172.1 |
| D | 8 | 195 | 158099 | 914.57 | 732 | 717 | 172.1 |
| D | 13 | 152 | 124180 | 717.46 | 732 | 717 | 172.1 |
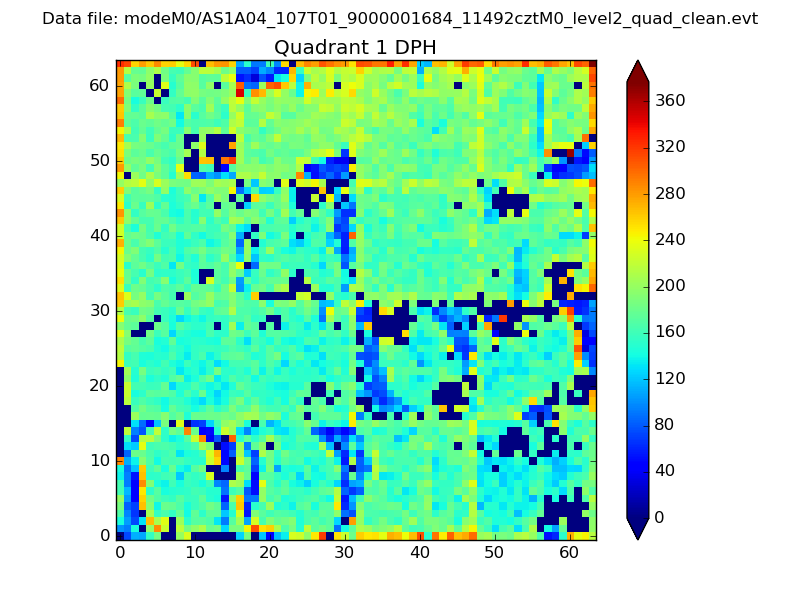
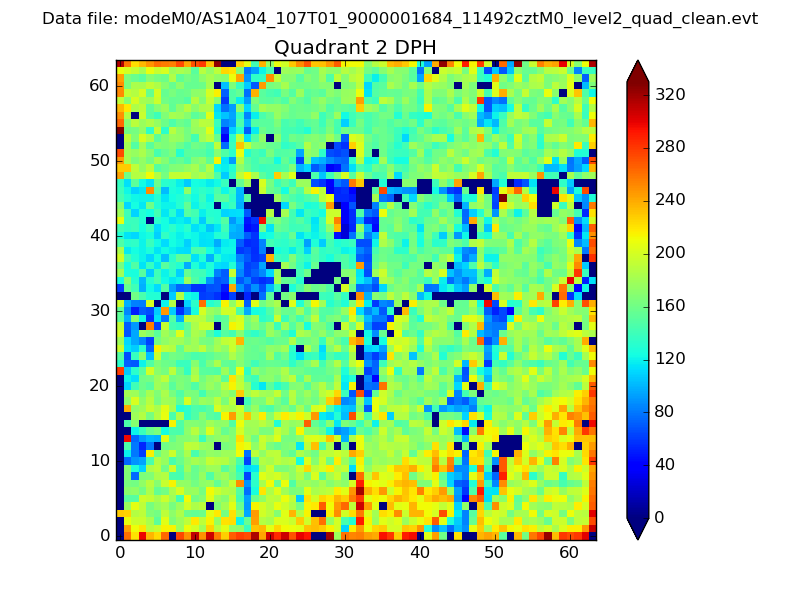
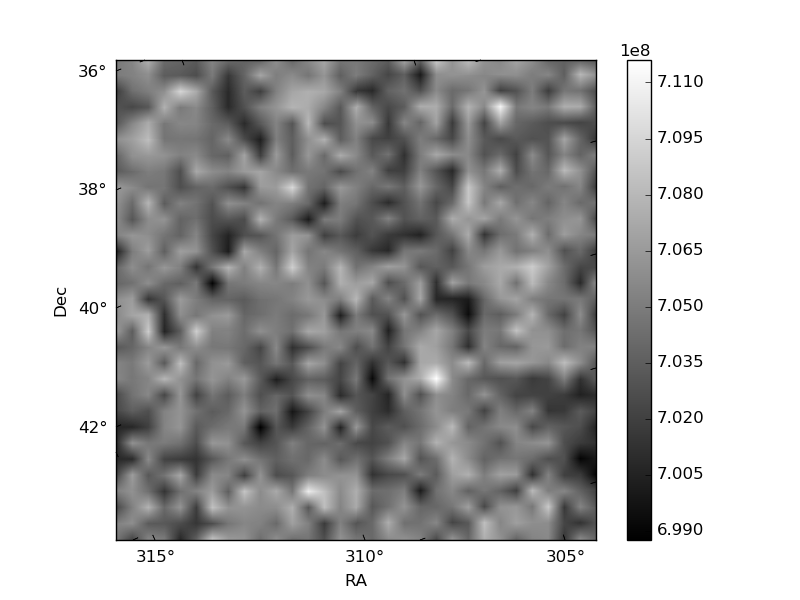
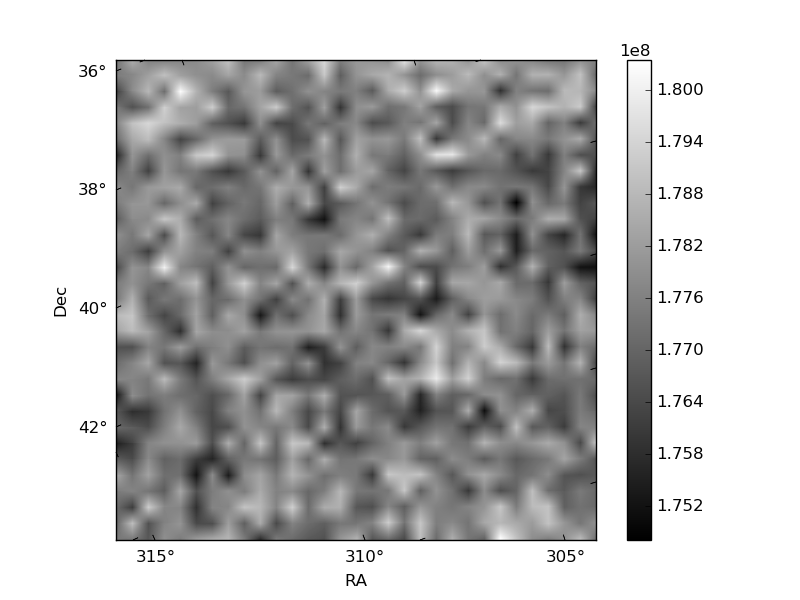
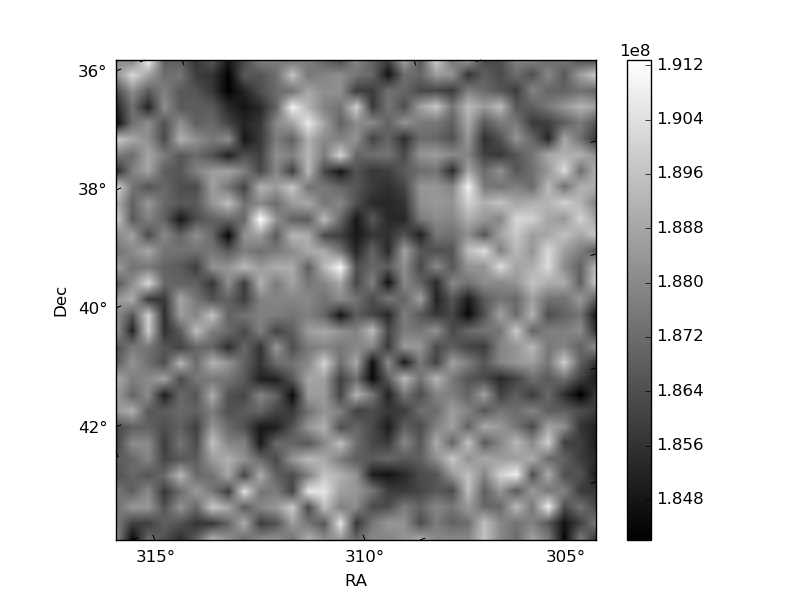
Histogram calculated using DETX and DETY for each event in the final _common_clean file
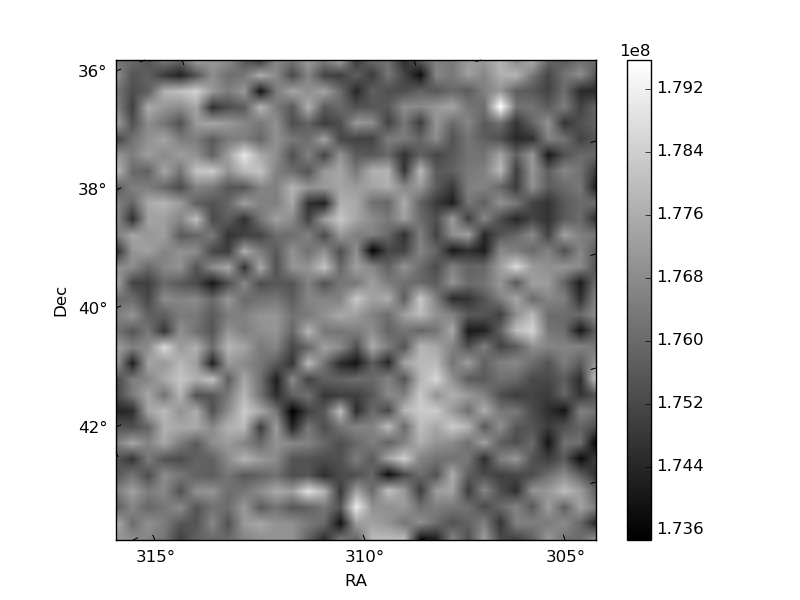
| Quadrant A | 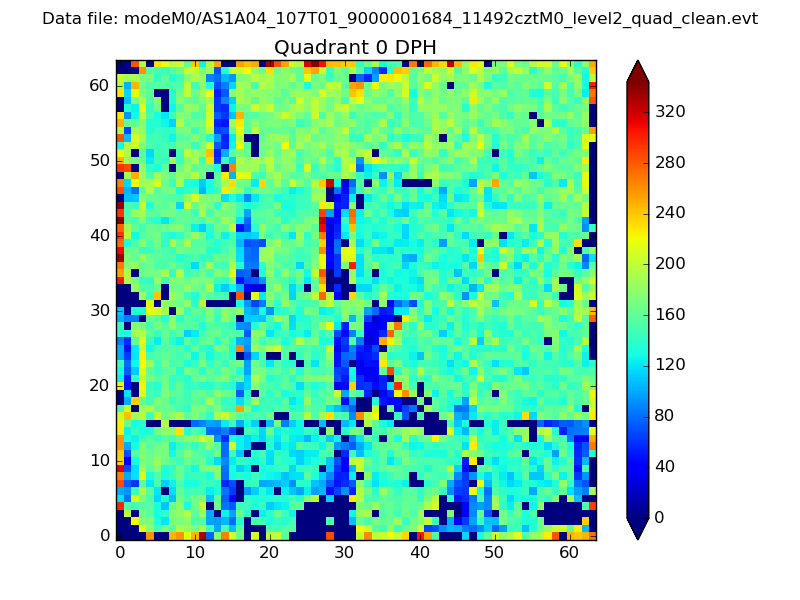 |
 |
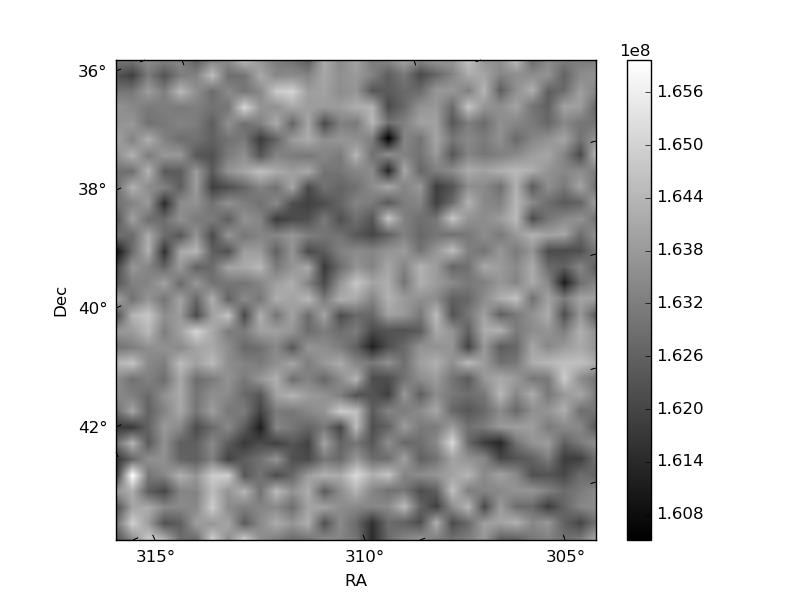
Quadrant B |
|---|---|---|---|
| Quadrant D | 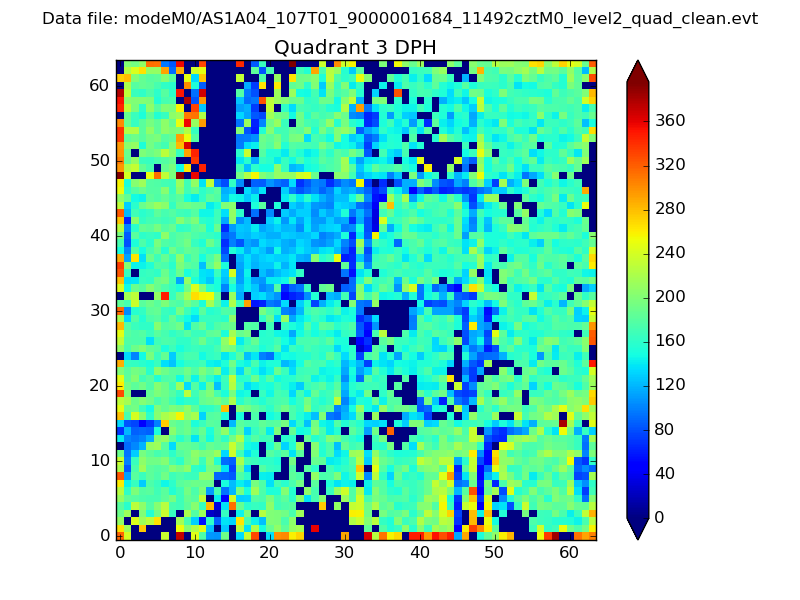 |
 |
Quadrant C |
| Plot type | Count rate plots | Images |
|---|---|---|
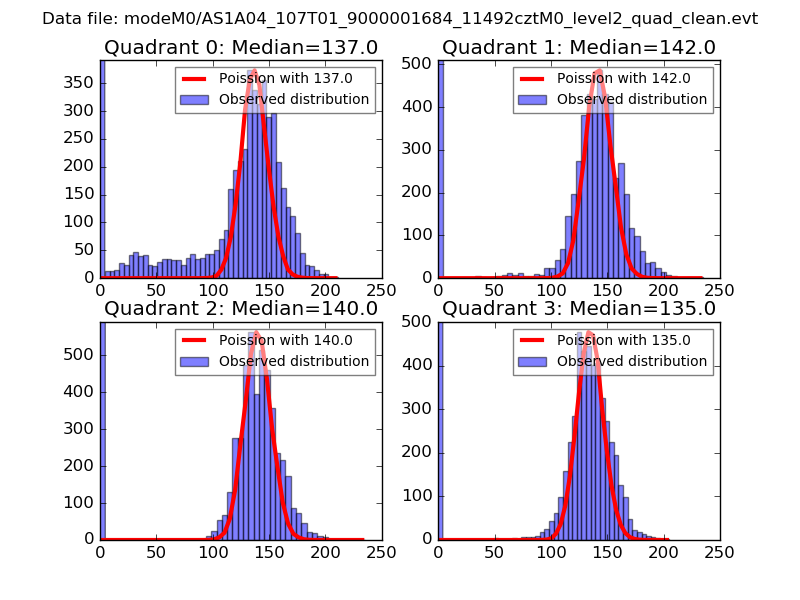
| Comparison with Poisson distribution Blue bars denote a histogram of data divided into 1 sec bins. Red curve is a Poisson curve with rate = median count rate of data. |
 |
 |
| Quadrant-wise count rates Data is divided into 100 sec bins |
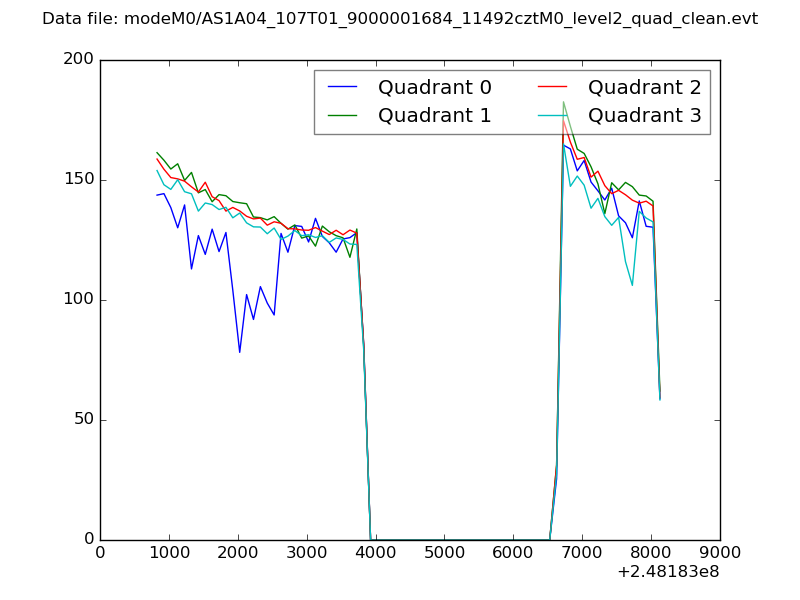 |
|
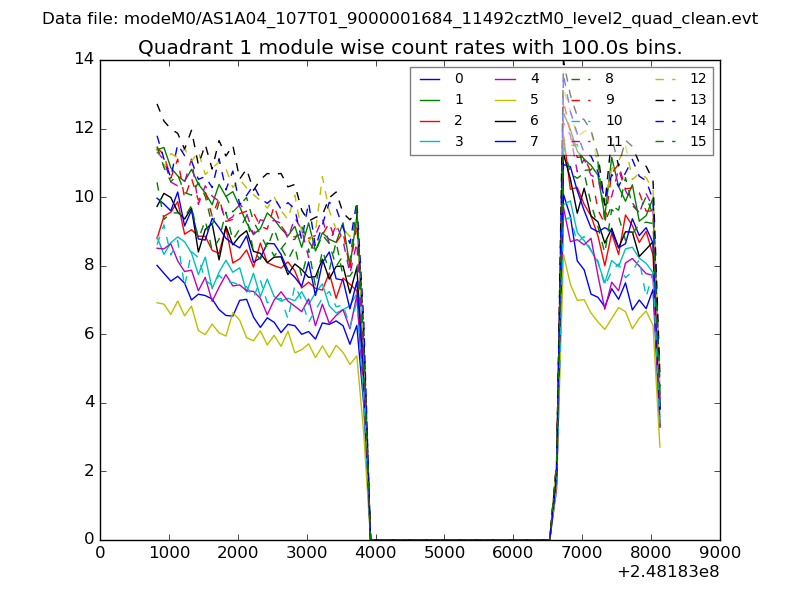
| Module-wise count rates for Quadrant A Data is divided into 100 sec bins |
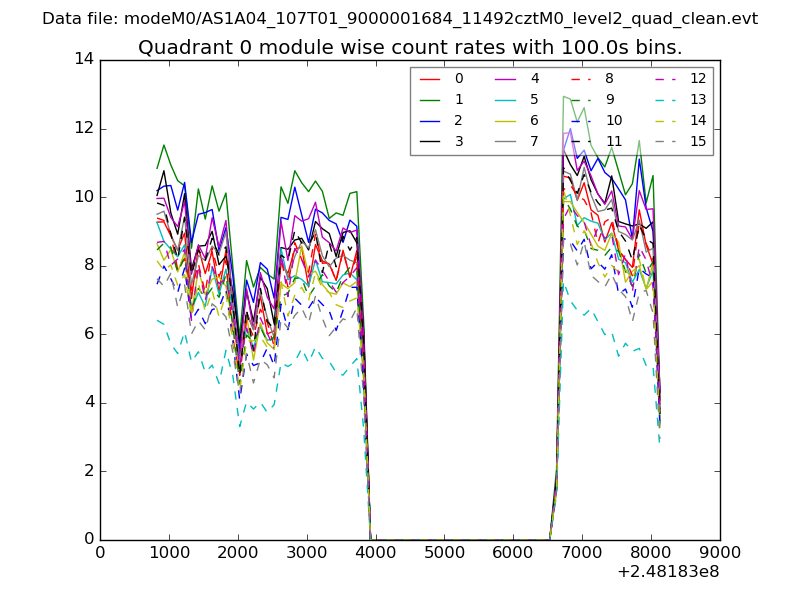 |
 |
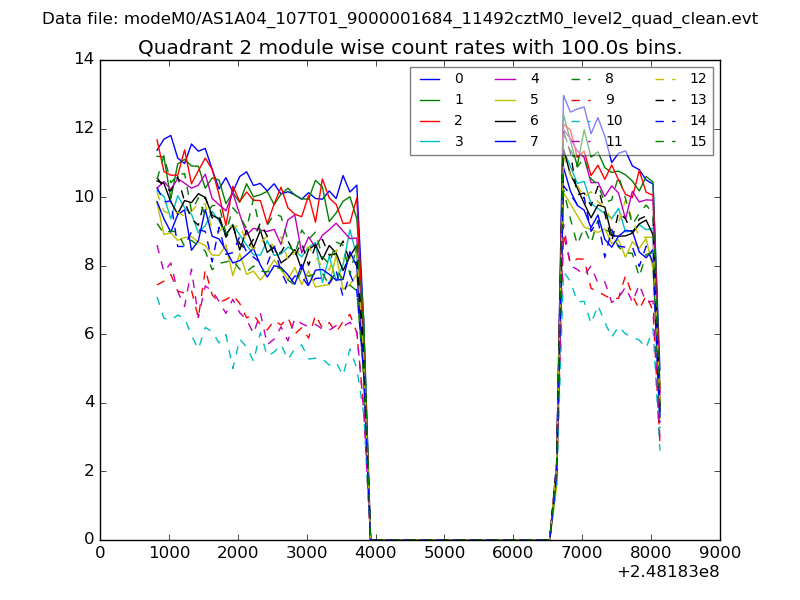
| Module-wise count rates for Quadrant B Data is divided into 100 sec bins |
 |
 |
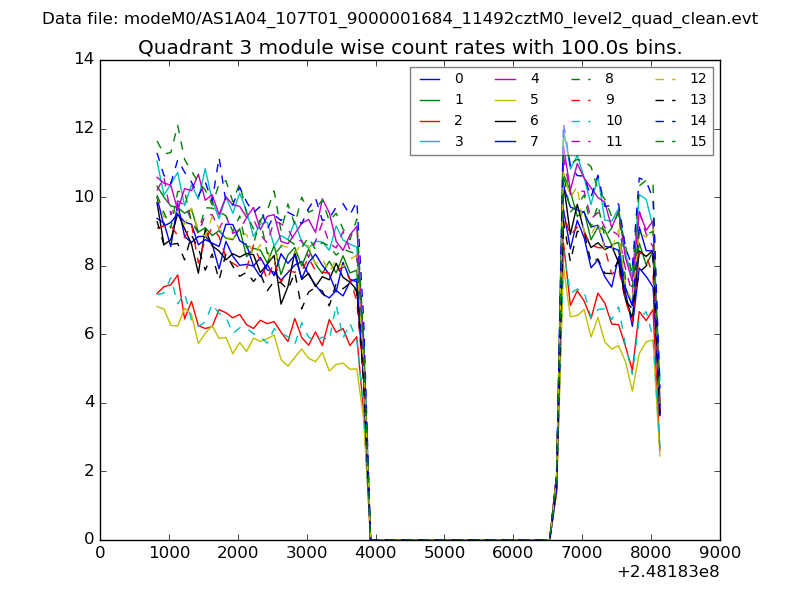
| Module-wise count rates for Quadrant C Data is divided into 100 sec bins |
 |
 |
| Module-wise count rates for Quadrant D Data is divided into 100 sec bins |
 |
 |
| Parameter | Plot |
|---|---|
| CZT HV Monitor | 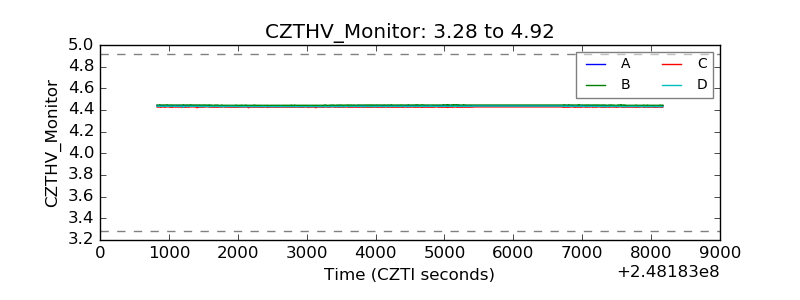 |
| D_VDD | 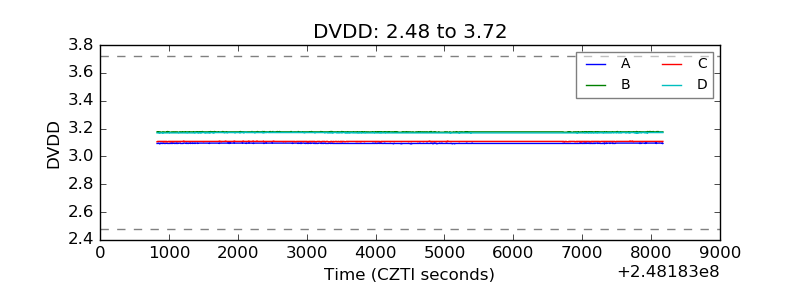 |
| Temperature 1 |  |
| Veto HV Monitor | 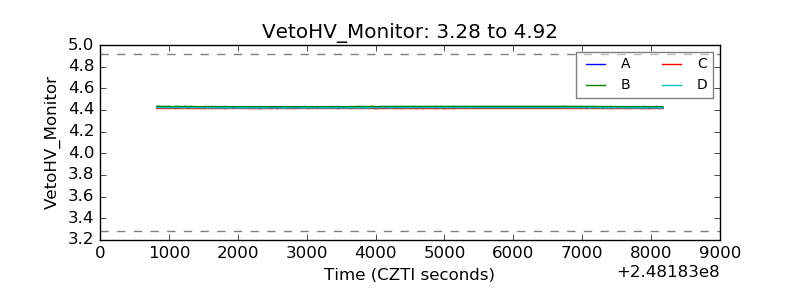 |
| Veto LLD |  |
| Alpha Counter | 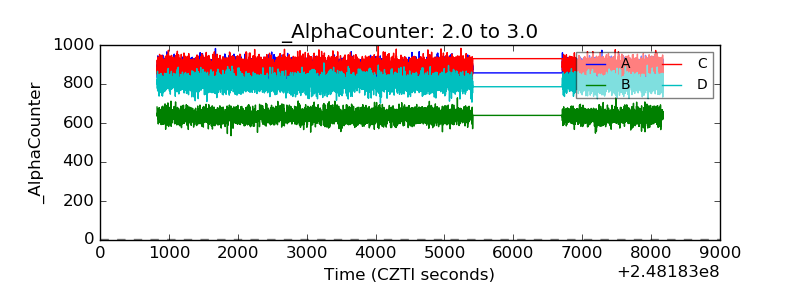 |
| _CPM_Rate | 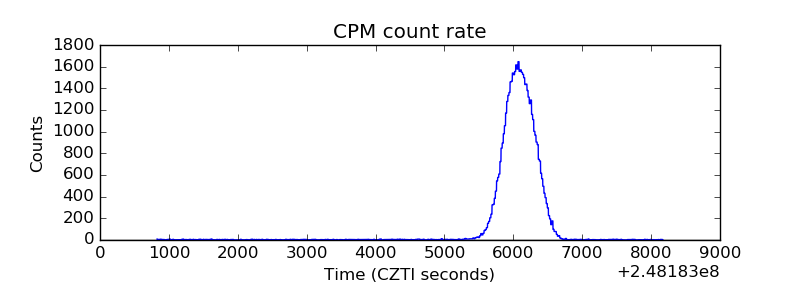 |
| CZT Counter | 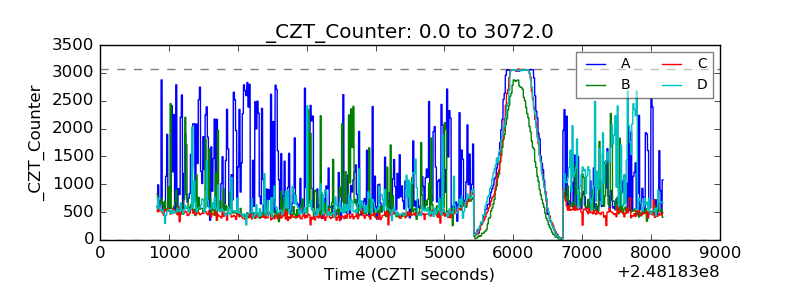 |
| +2.5 Volts monitor |  |
| +5 Volts monitor |  |
| _ROLL_ROT |  |
| _Roll_DEC |  |
| _Roll_RA | 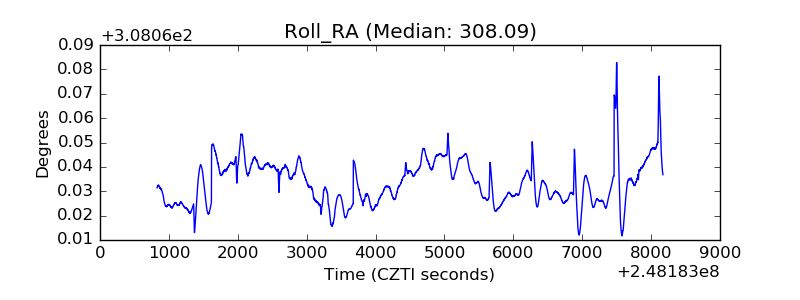 |
| Veto Counter | 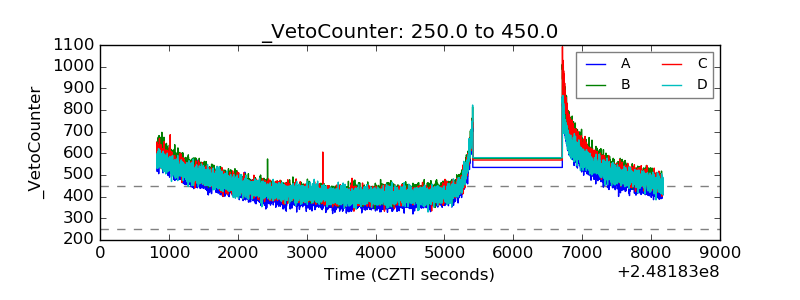 |