| Param | Original file | Final file |
|---|---|---|
| Filename | modeM0/AS1A04_107T01_9000001684_11493cztM0_level2.evt | modeM0/AS1A04_107T01_9000001684_11493cztM0_level2_quad_clean.evt |
| Size (bytes) | 584,003,520 | 83,796,480 |
| Size | 556.9 MB | 79.9 MB |
| Events in quadrant A | 6,241,639 | 512,670 |
| Events in quadrant B | 3,740,826 | 545,767 |
| Events in quadrant C | 2,780,757 | 548,394 |
| Events in quadrant D | 4,522,059 | 516,224 |
| Mode M9 | |||
|---|---|---|---|
| Quadrant | BADHDUFLAG | Total packets | Discarded packets |
| A | 0 | 12 | 0 |
| B | 0 | 12 | 0 |
| C | 0 | 12 | 0 |
| D | 0 | 12 | 0 |
| Mode SS | |||
|---|---|---|---|
| Quadrant | BADHDUFLAG | Total packets | Discarded packets |
| A | 0 | 122 | 0 |
| B | 0 | 122 | 0 |
| C | 0 | 122 | 0 |
| D | 0 | 122 | 0 |
| Mode M0 | |||
|---|---|---|---|
| Quadrant | BADHDUFLAG | Total packets | Discarded packets |
| A | 0 | 22554 | 2 |
| B | 0 | 14892 | 1 |
| C | 0 | 12167 | 1 |
| D | 0 | 17374 | 1 |
| Quadrant | Total seconds | Saturated seconds | Saturation percentage |
|---|---|---|---|
| A | 5922 | 1073 | 18.118879% |
| B | 5922 | 227 | 3.833164% |
| C | 5922 | 47 | 0.793651% |
| D | 5922 | 276 | 4.660588% |
Noise dominated data is calculated using 1-second bins in cleaned event files. If a bin has >2000 counts, and if more than 50% of those come from <1% of pixels, then it is considered to be noise-dominated and hence unusable.
| Quadrant | # 1 sec bins | Bins with >0 counts | Bins with >2000 counts | High rate bins dominated by noise | Noise dominated (total time) | Noise dominated (detector-on time) | Marked lightcurve |
|---|---|---|---|---|---|---|---|
| A | 7188 | 5924 | 755 | 755 | 10.50% | 12.74% | 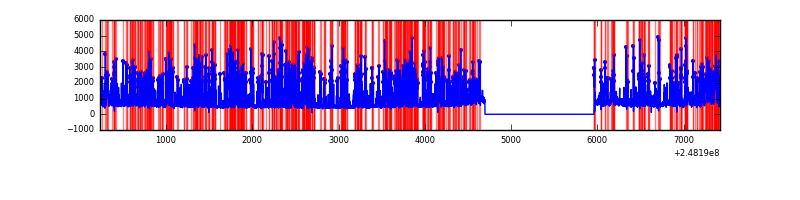 |
| B | 7188 | 5924 | 88 | 88 | 1.22% | 1.49% | 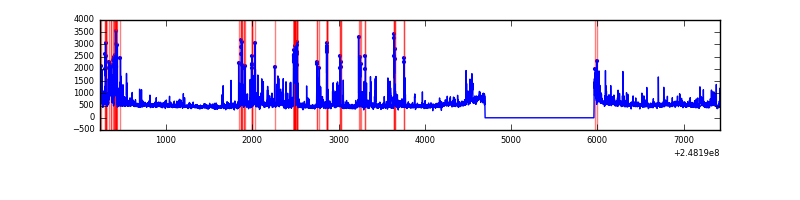 |
| C | 7188 | 5924 | 0 | 0 | 0.00% | 0.00% | 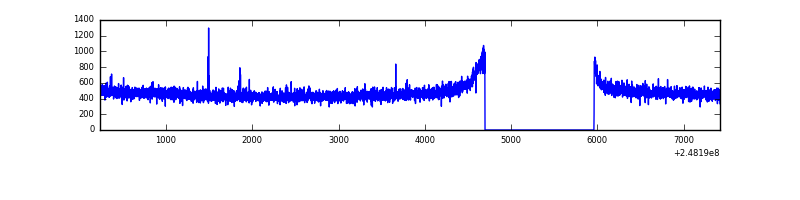 |
| D | 7188 | 5924 | 227 | 227 | 3.16% | 3.83% | 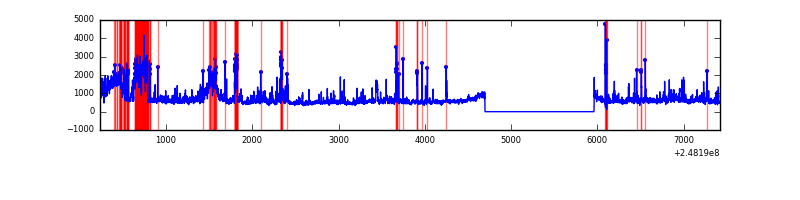 |
Top three noisy pixels from each quadrant. If the there are fewer than three noisy pixels in the level2.evt file, extra rows are filled as -1
| Pixel properties | Quadrant properties | ||||||
|---|---|---|---|---|---|---|---|
| Quadrant | DetID | PixID | Counts | Sigma | Mean | Median | Sigma |
| A | 8 | 5 | 3465272 | 25149.08 | 686 | 672 | 137.8 |
| A | 1 | 162 | 33417 | 237.69 | 686 | 672 | 137.8 |
| A | 9 | 143 | 19793 | 138.8 | 686 | 672 | 137.8 |
| B | 4 | 239 | 657652 | 4890.16 | 719 | 704 | 134.3 |
| B | 11 | 51 | 145188 | 1075.5 | 719 | 704 | 134.3 |
| B | 15 | 204 | 43333 | 317.32 | 719 | 704 | 134.3 |
| C | 13 | 61 | 5208 | 27.41 | 711 | 717 | 163.9 |
| C | 12 | 4 | 4290 | 21.8 | 711 | 717 | 163.9 |
| C | 14 | 234 | 3562 | 17.36 | 711 | 717 | 163.9 |
| D | 1 | 52 | 1109728 | 6543.04 | 708 | 689 | 169.5 |
| D | 2 | 120 | 225236 | 1324.77 | 708 | 689 | 169.5 |
| D | 8 | 195 | 143866 | 844.71 | 708 | 689 | 169.5 |
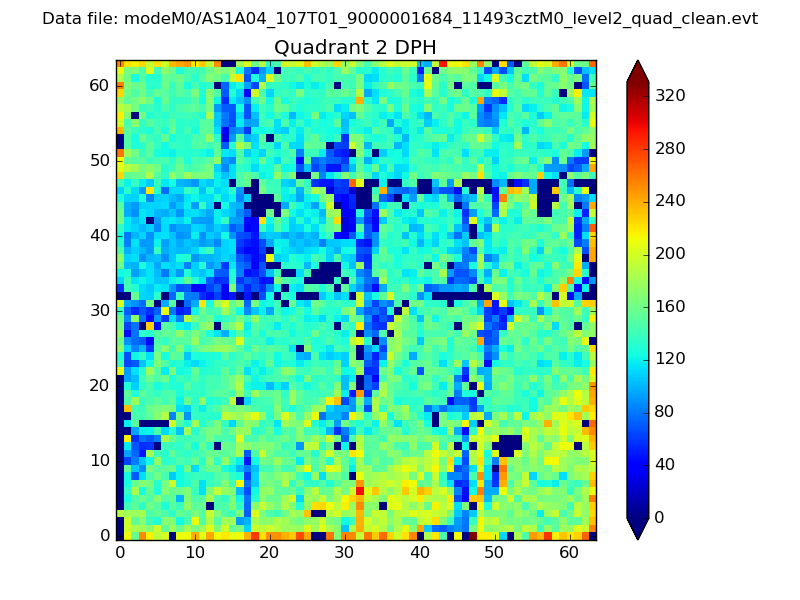
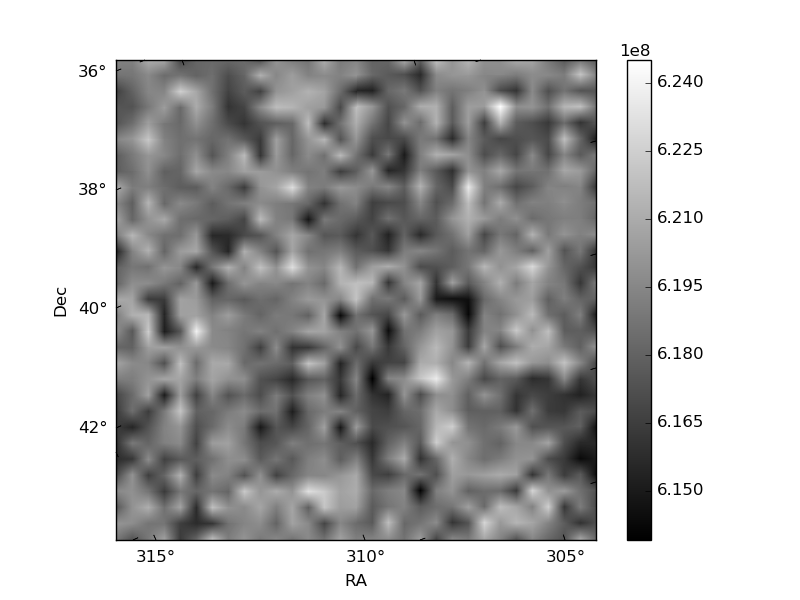
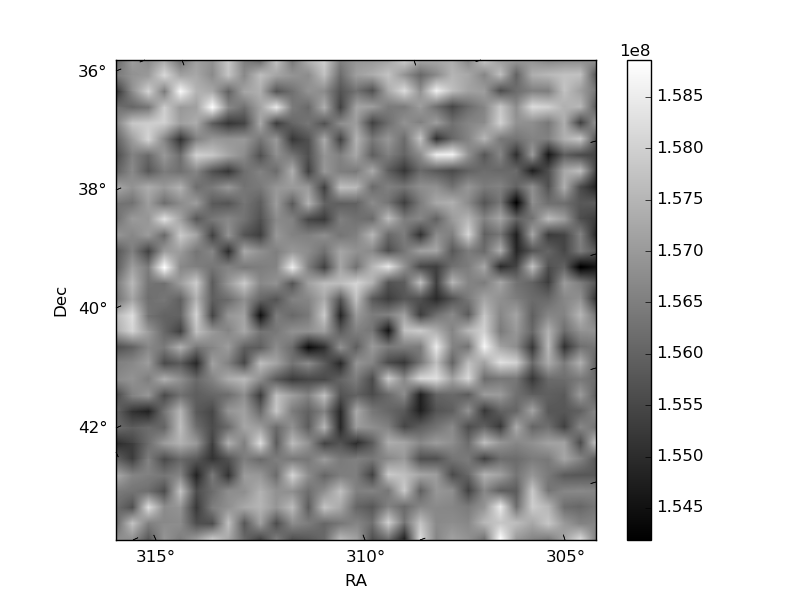
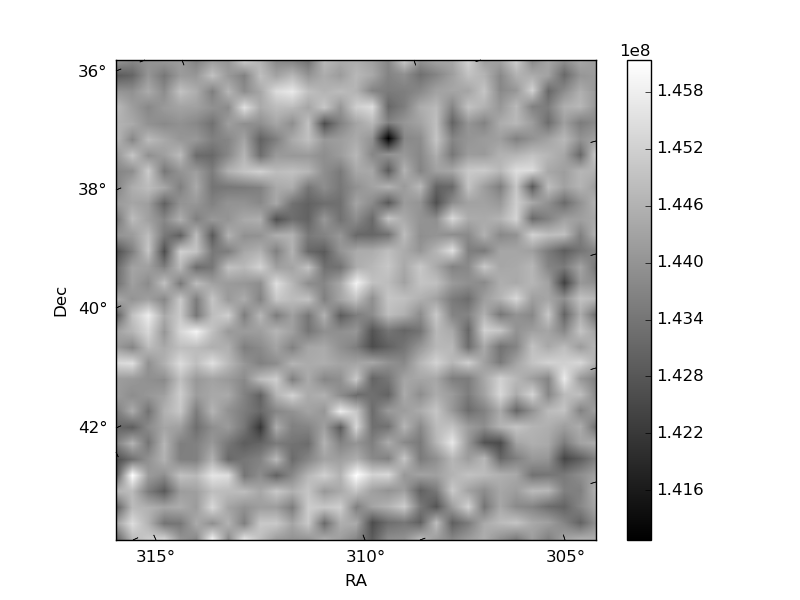
Histogram calculated using DETX and DETY for each event in the final _common_clean file
| Quadrant A | 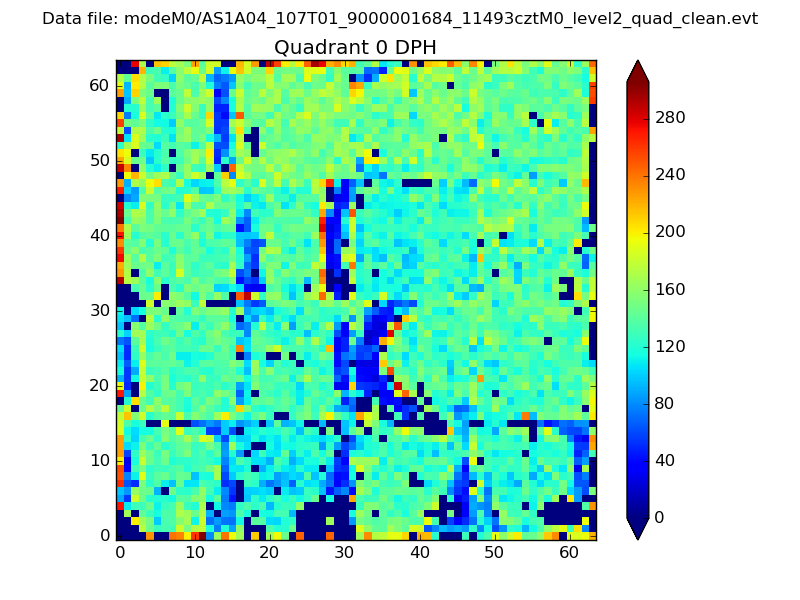 |
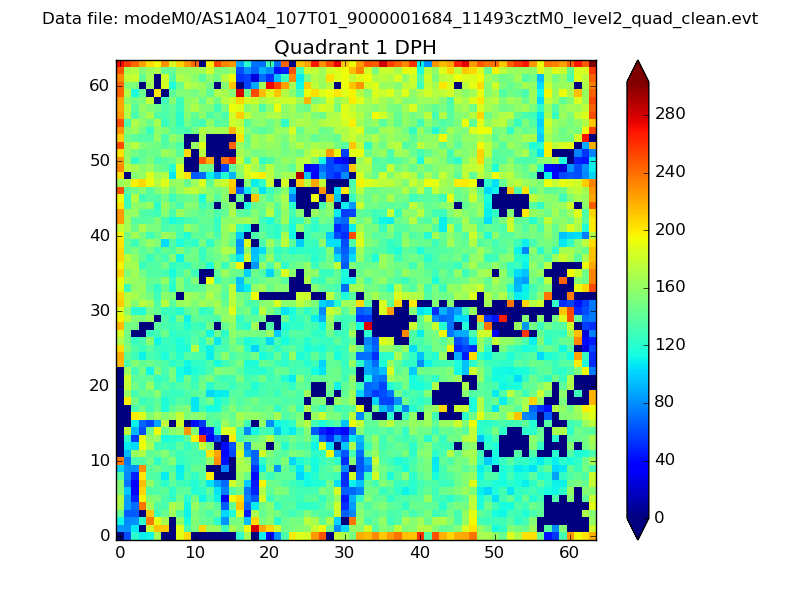 |
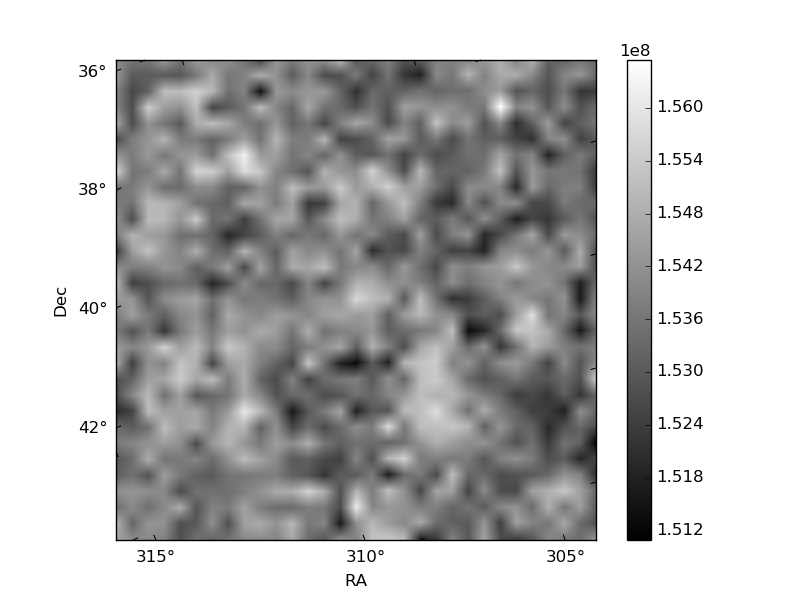
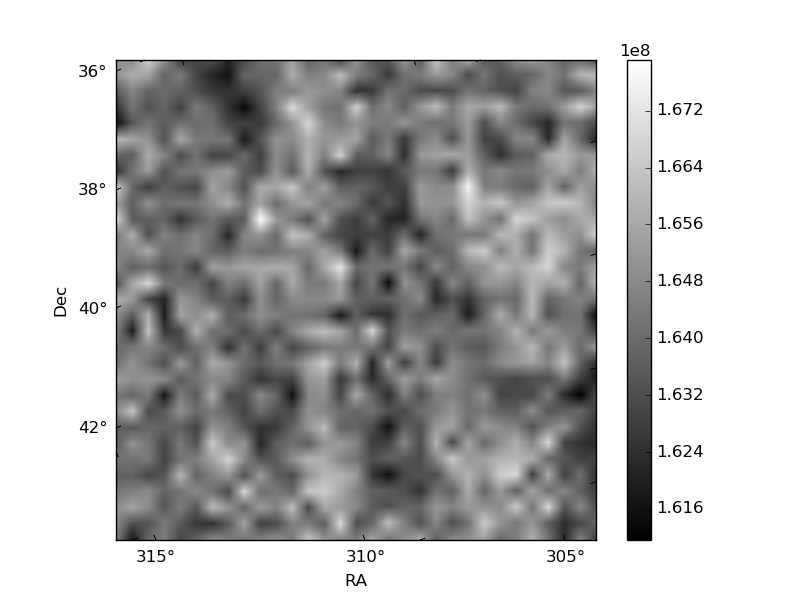
Quadrant B |
|---|---|---|---|
| Quadrant D | 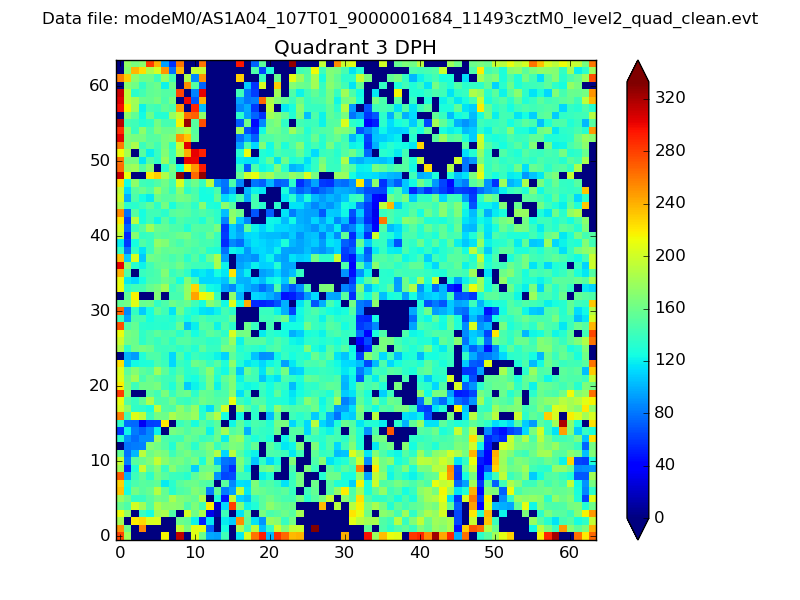 |
 |
Quadrant C |
| Plot type | Count rate plots | Images |
|---|---|---|
| Comparison with Poisson distribution Blue bars denote a histogram of data divided into 1 sec bins. Red curve is a Poisson curve with rate = median count rate of data. |
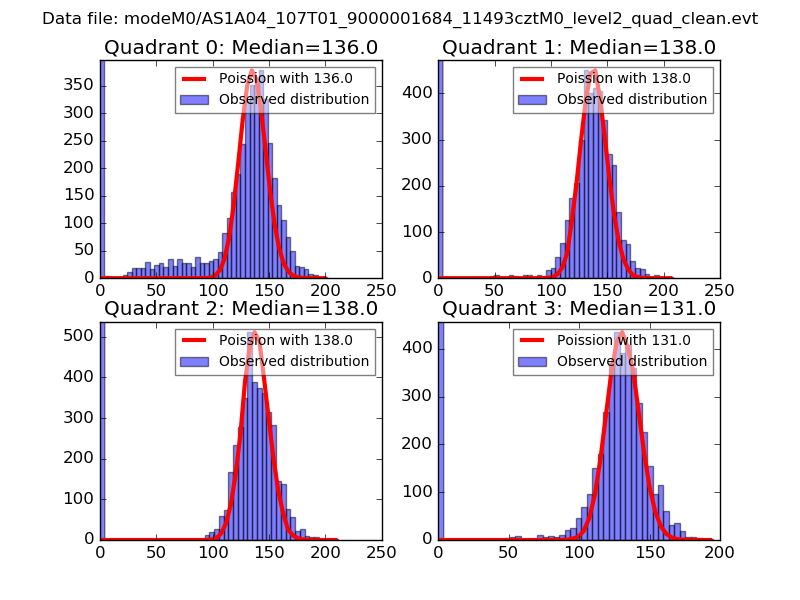 |
 |
| Quadrant-wise count rates Data is divided into 100 sec bins |
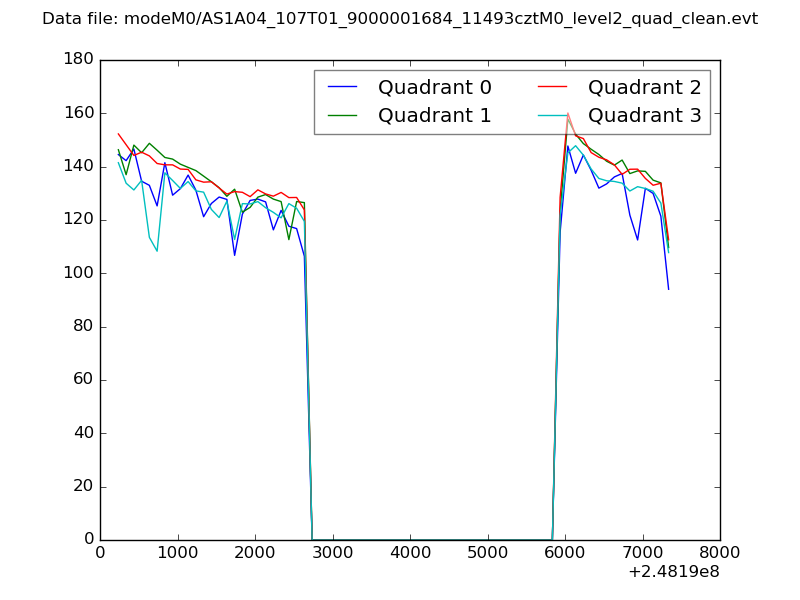 |
|
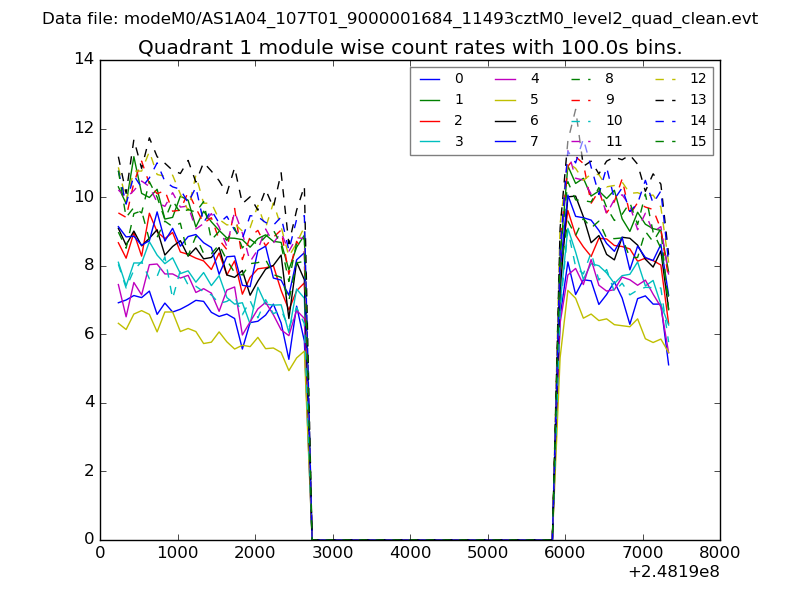
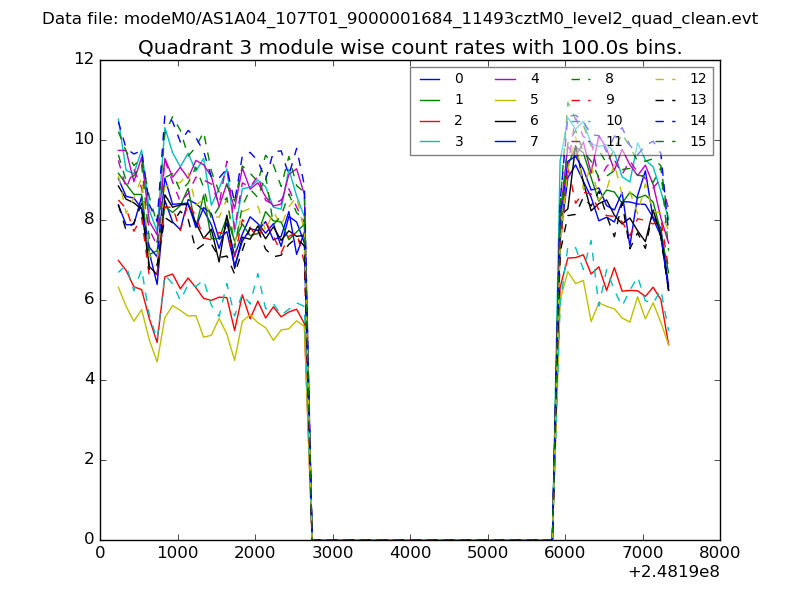
| Module-wise count rates for Quadrant A Data is divided into 100 sec bins |
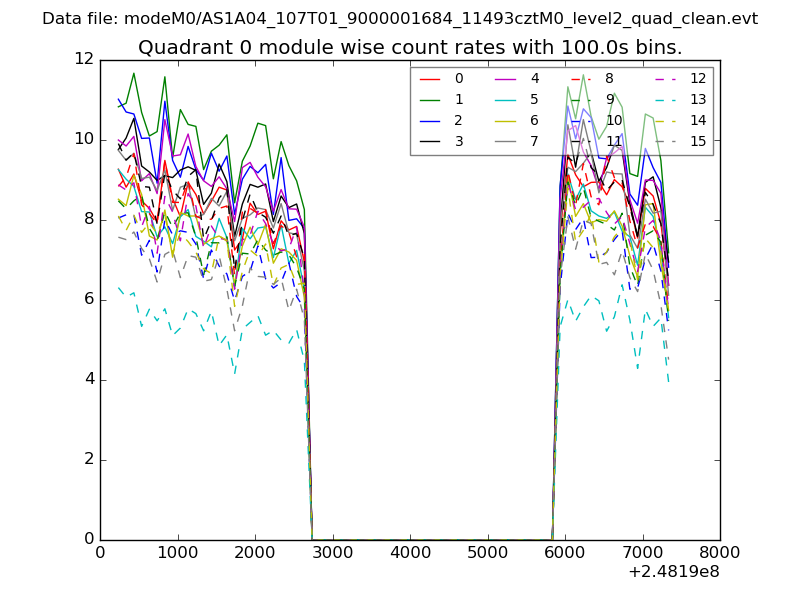 |
 |
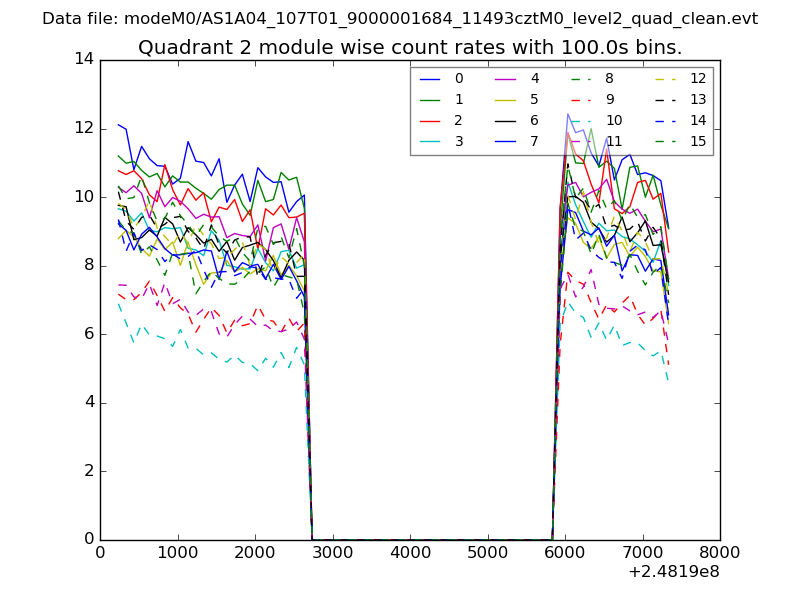
| Module-wise count rates for Quadrant B Data is divided into 100 sec bins |
 |
 |
| Module-wise count rates for Quadrant C Data is divided into 100 sec bins |
 |
 |
| Module-wise count rates for Quadrant D Data is divided into 100 sec bins |
 |
 |
| Parameter | Plot |
|---|---|
| CZT HV Monitor | 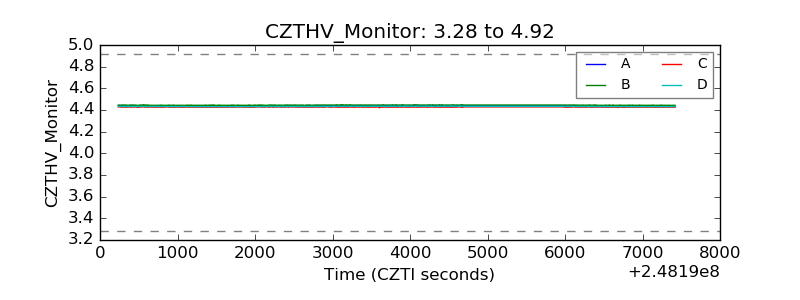 |
| D_VDD | 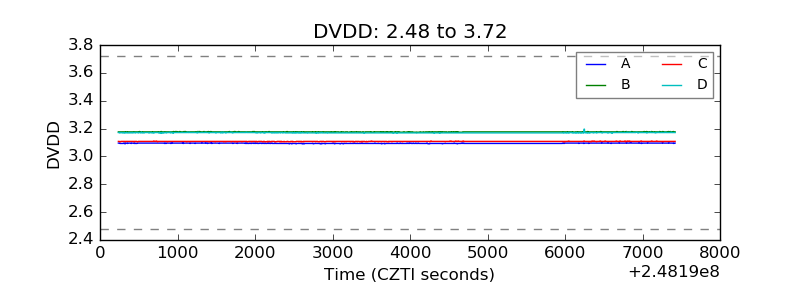 |
| Temperature 1 | 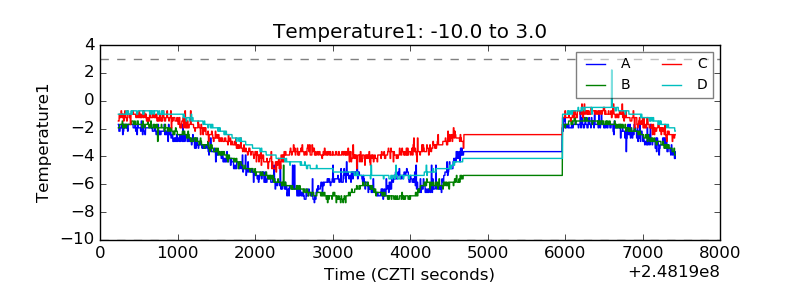 |
| Veto HV Monitor | 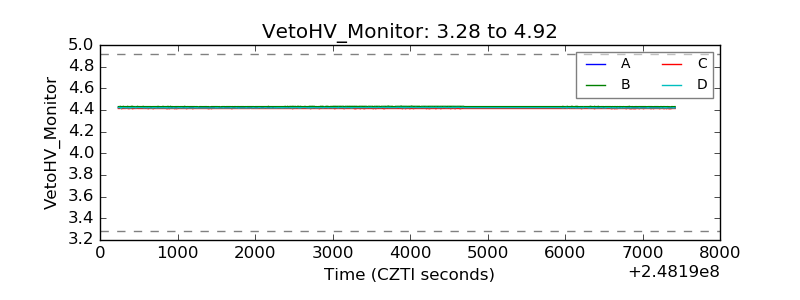 |
| Veto LLD |  |
| Alpha Counter | 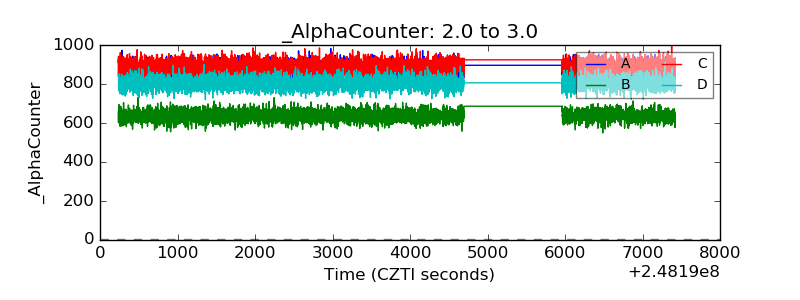 |
| _CPM_Rate | 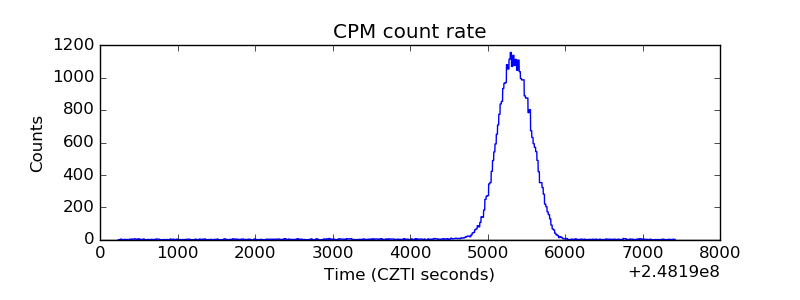 |
| CZT Counter | 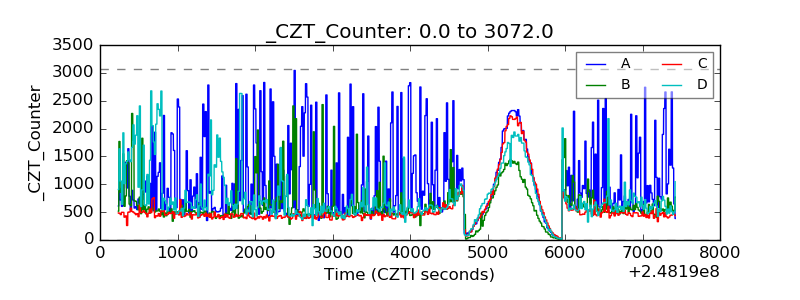 |
| +2.5 Volts monitor |  |
| +5 Volts monitor |  |
| _ROLL_ROT | 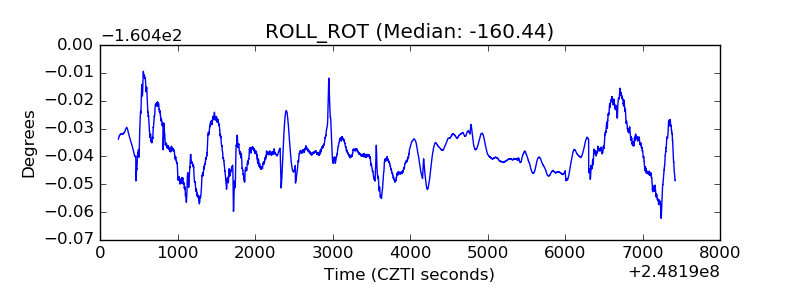 |
| _Roll_DEC | 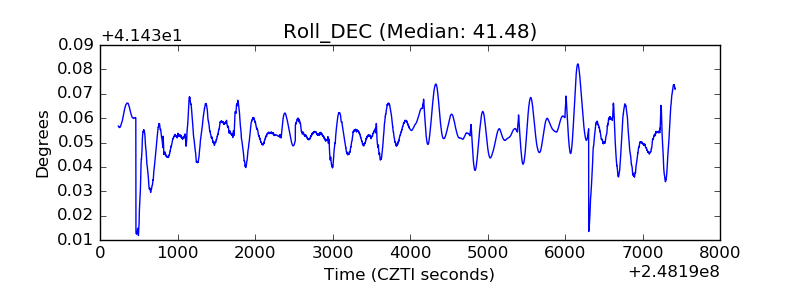 |
| _Roll_RA | 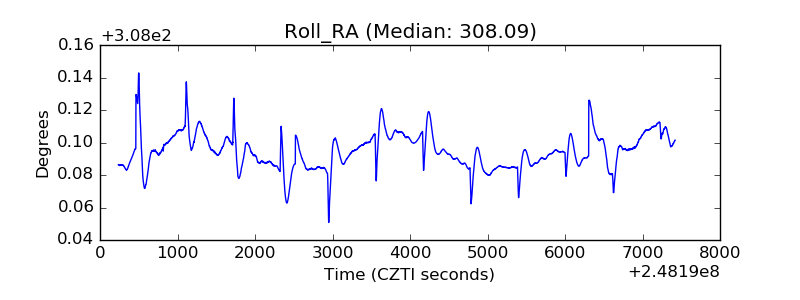 |
| Veto Counter | 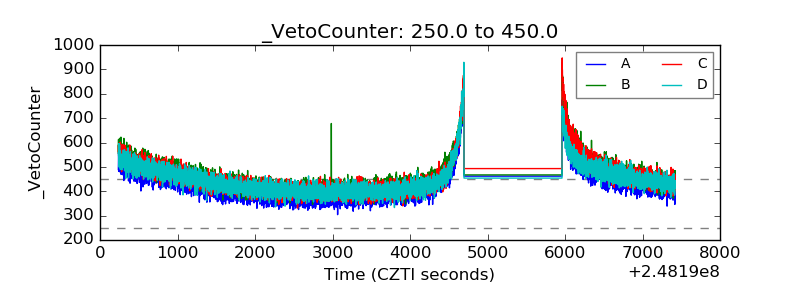 |