| Param | Original file | Final file |
|---|---|---|
| Filename | modeM0/AS1A04_107T01_9000001684_11494cztM0_level2.evt | modeM0/AS1A04_107T01_9000001684_11494cztM0_level2_quad_clean.evt |
| Size (bytes) | 626,503,680 | 90,875,520 |
| Size | 597.5 MB | 86.7 MB |
| Events in quadrant A | 6,112,603 | 555,468 |
| Events in quadrant B | 5,123,999 | 577,192 |
| Events in quadrant C | 3,016,222 | 595,994 |
| Events in quadrant D | 4,281,608 | 570,093 |
| Mode M9 | |||
|---|---|---|---|
| Quadrant | BADHDUFLAG | Total packets | Discarded packets |
| A | 0 | 12 | 0 |
| B | 0 | 12 | 0 |
| C | 0 | 12 | 0 |
| D | 0 | 13 | 0 |
| Mode SS | |||
|---|---|---|---|
| Quadrant | BADHDUFLAG | Total packets | Discarded packets |
| A | 0 | 130 | 0 |
| B | 0 | 130 | 0 |
| C | 0 | 130 | 0 |
| D | 0 | 130 | 0 |
| Mode M0 | |||
|---|---|---|---|
| Quadrant | BADHDUFLAG | Total packets | Discarded packets |
| A | 0 | 22587 | 3 |
| B | 0 | 19556 | 2 |
| C | 0 | 13376 | 2 |
| D | 0 | 16941 | 2 |
| Quadrant | Total seconds | Saturated seconds | Saturation percentage |
|---|---|---|---|
| A | 6499 | 832 | 12.801970% |
| B | 6499 | 497 | 7.647330% |
| C | 6499 | 36 | 0.553931% |
| D | 6499 | 116 | 1.784890% |
Noise dominated data is calculated using 1-second bins in cleaned event files. If a bin has >2000 counts, and if more than 50% of those come from <1% of pixels, then it is considered to be noise-dominated and hence unusable.
| Quadrant | # 1 sec bins | Bins with >0 counts | Bins with >2000 counts | High rate bins dominated by noise | Noise dominated (total time) | Noise dominated (detector-on time) | Marked lightcurve |
|---|---|---|---|---|---|---|---|
| A | 7625 | 6500 | 548 | 548 | 7.19% | 8.43% | 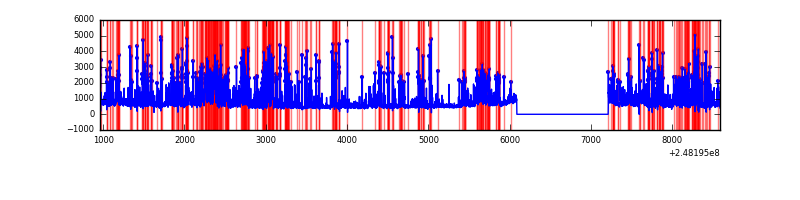 |
| B | 7625 | 6501 | 284 | 284 | 3.72% | 4.37% | 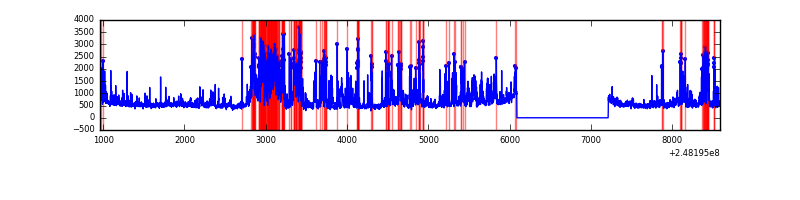 |
| C | 7625 | 6501 | 0 | 0 | 0.00% | 0.00% | 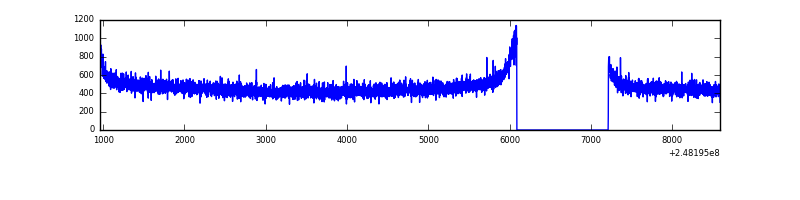 |
| D | 7625 | 6501 | 54 | 54 | 0.71% | 0.83% | 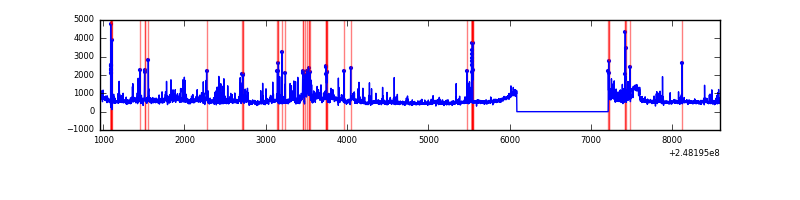 |
Top three noisy pixels from each quadrant. If the there are fewer than three noisy pixels in the level2.evt file, extra rows are filled as -1
| Pixel properties | Quadrant properties | ||||||
|---|---|---|---|---|---|---|---|
| Quadrant | DetID | PixID | Counts | Sigma | Mean | Median | Sigma |
| A | 8 | 5 | 2997966 | 19884.91 | 755 | 742 | 150.7 |
| A | 1 | 162 | 50489 | 330.04 | 755 | 742 | 150.7 |
| A | 1 | 178 | 27825 | 179.68 | 755 | 742 | 150.7 |
| B | 4 | 81 | 1078960 | 7344.45 | 772 | 755 | 146.8 |
| B | 4 | 239 | 793093 | 5397.2 | 772 | 755 | 146.8 |
| B | 11 | 51 | 114789 | 776.77 | 772 | 755 | 146.8 |
| C | 13 | 61 | 5618 | 27.12 | 773 | 778 | 178.5 |
| C | 14 | 67 | 2532 | 9.83 | 773 | 778 | 178.5 |
| C | 12 | 4 | 2181 | 7.86 | 773 | 778 | 178.5 |
| D | 1 | 52 | 451067 | 2459.72 | 772 | 753 | 183.1 |
| D | 12 | 110 | 181584 | 987.74 | 772 | 753 | 183.1 |
| D | 13 | 152 | 148801 | 808.67 | 772 | 753 | 183.1 |
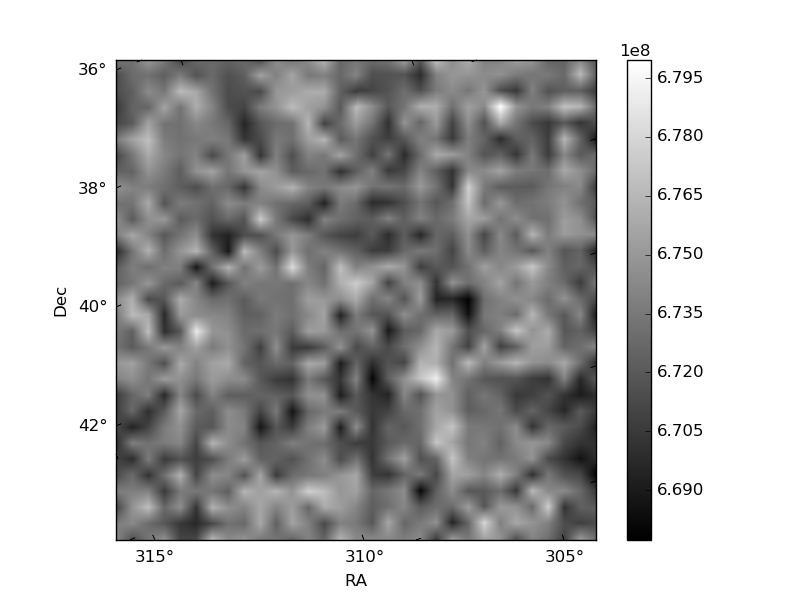
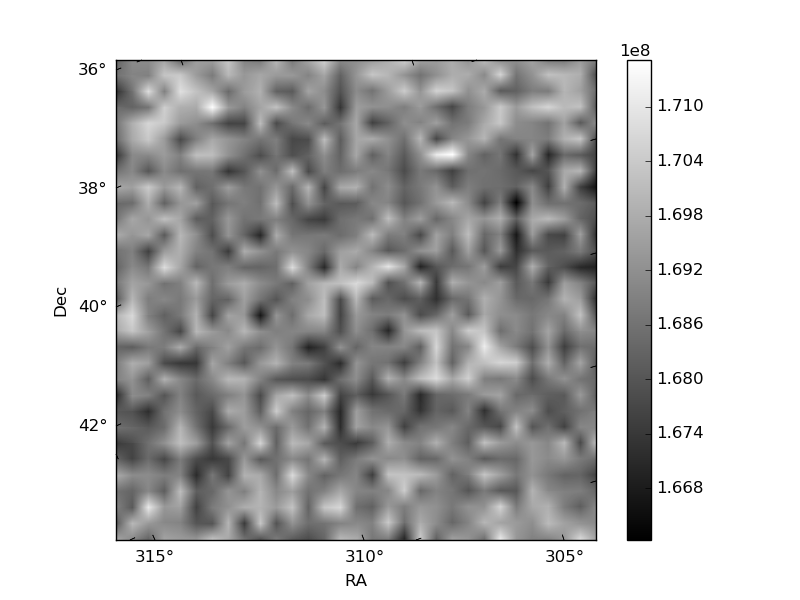
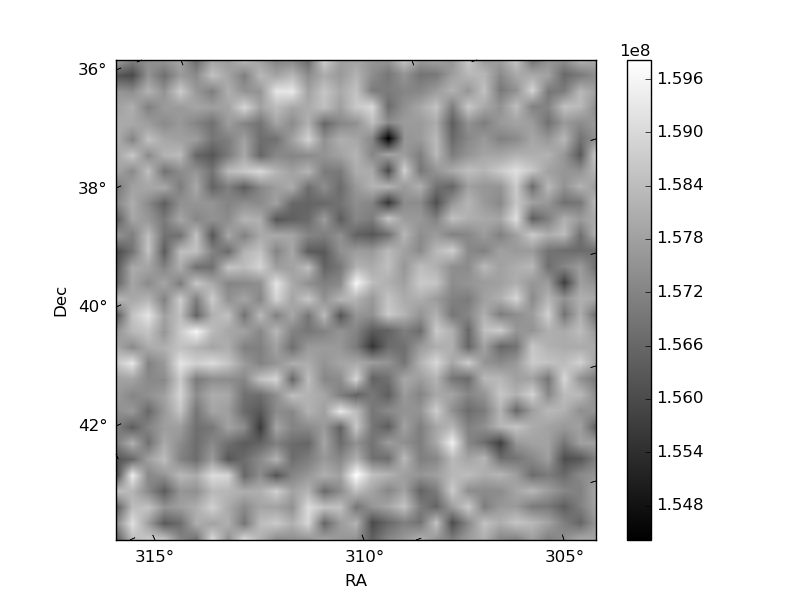
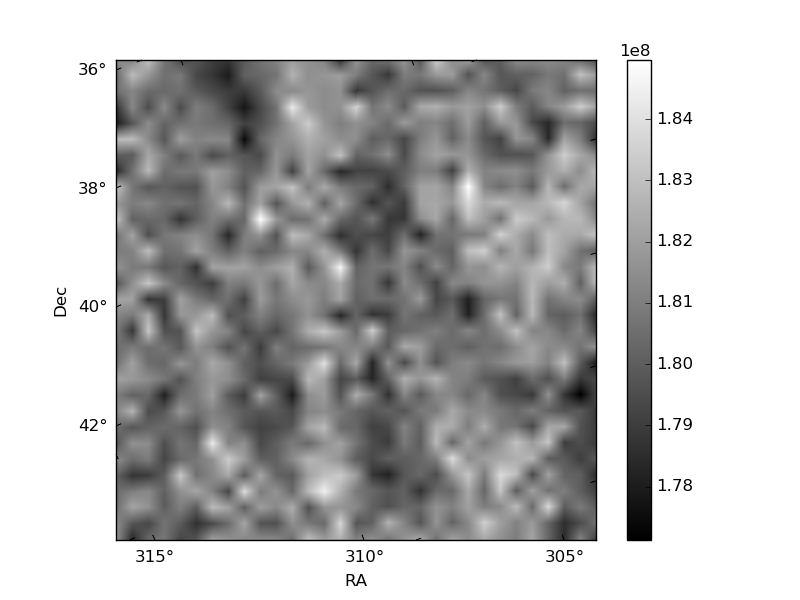
Histogram calculated using DETX and DETY for each event in the final _common_clean file
| Quadrant A | 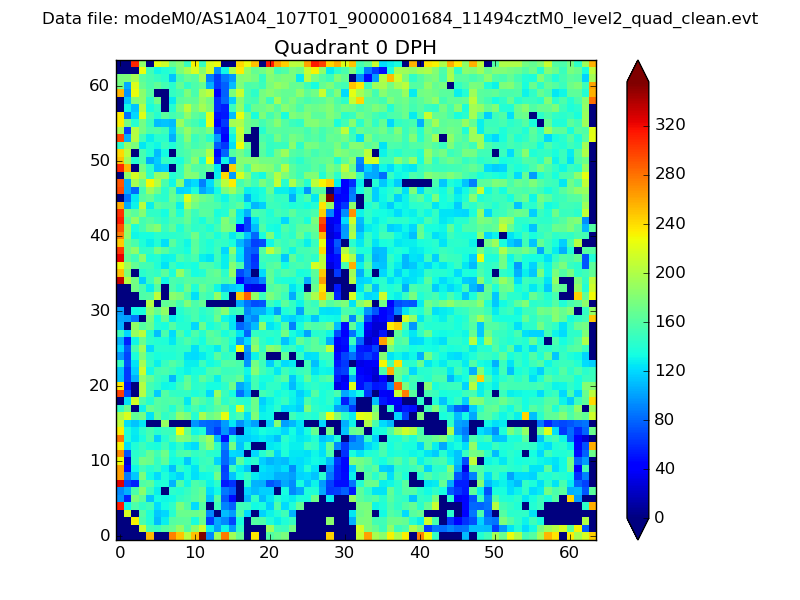 |
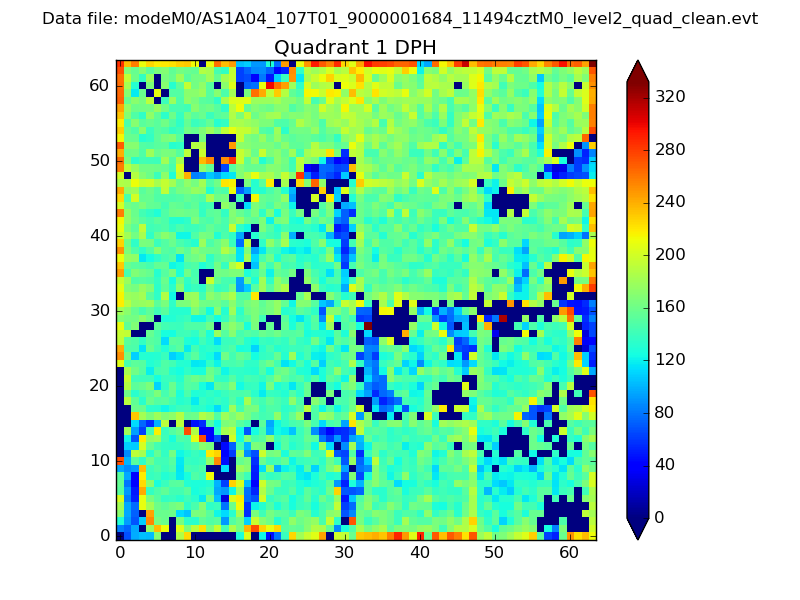 |
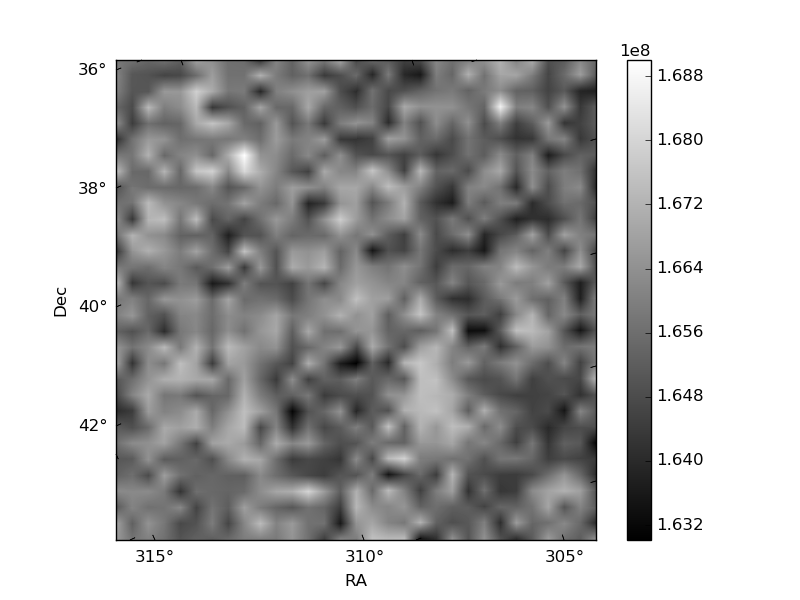
Quadrant B |
|---|---|---|---|
| Quadrant D | 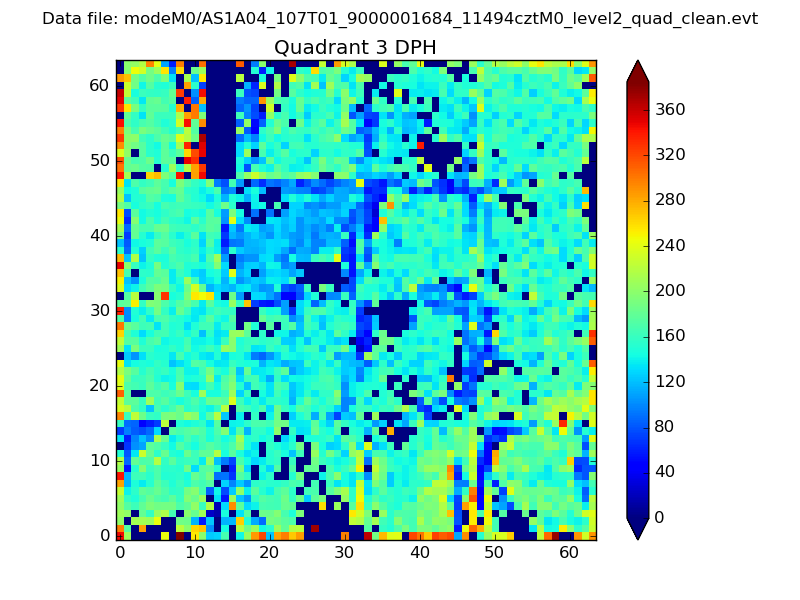 |
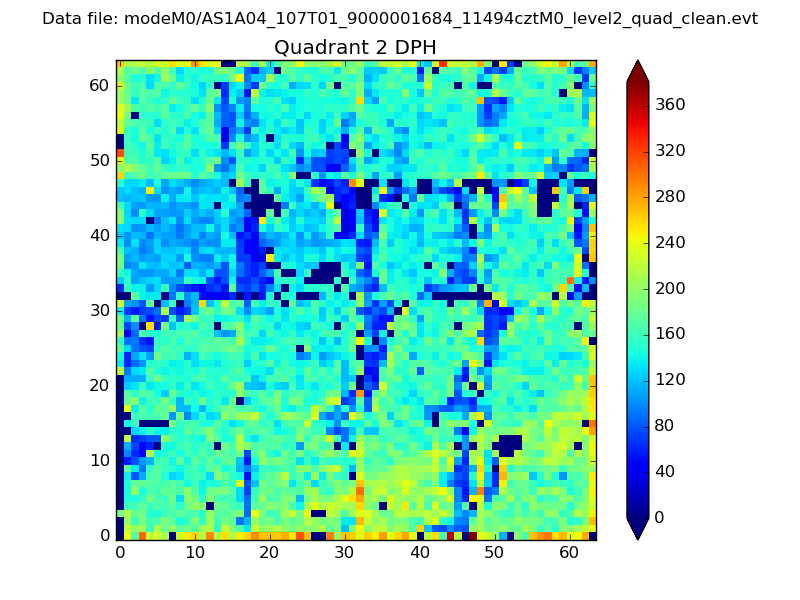 |
Quadrant C |
| Plot type | Count rate plots | Images |
|---|---|---|
| Comparison with Poisson distribution Blue bars denote a histogram of data divided into 1 sec bins. Red curve is a Poisson curve with rate = median count rate of data. |
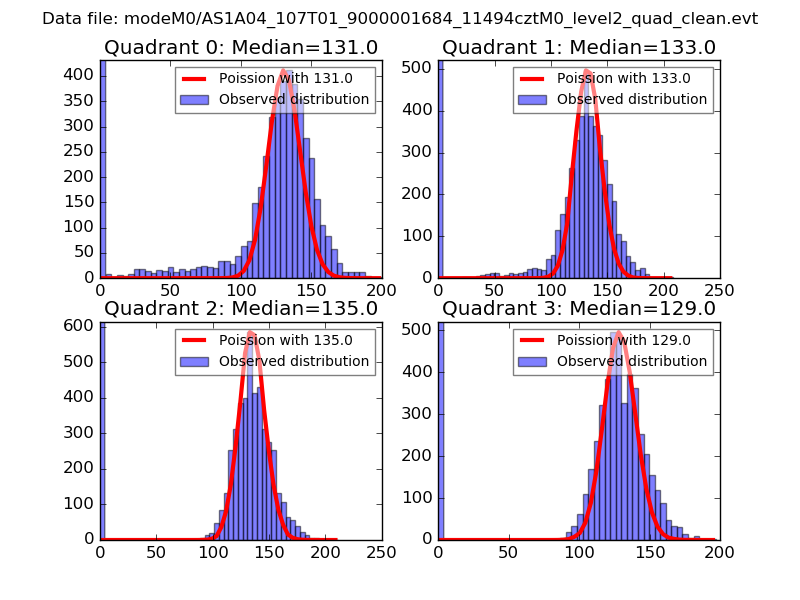 |
 |
| Quadrant-wise count rates Data is divided into 100 sec bins |
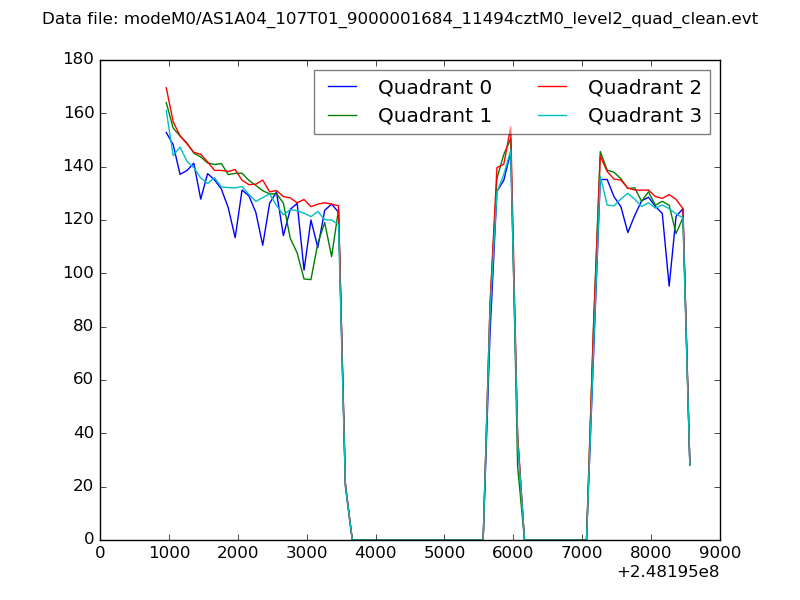 |
|
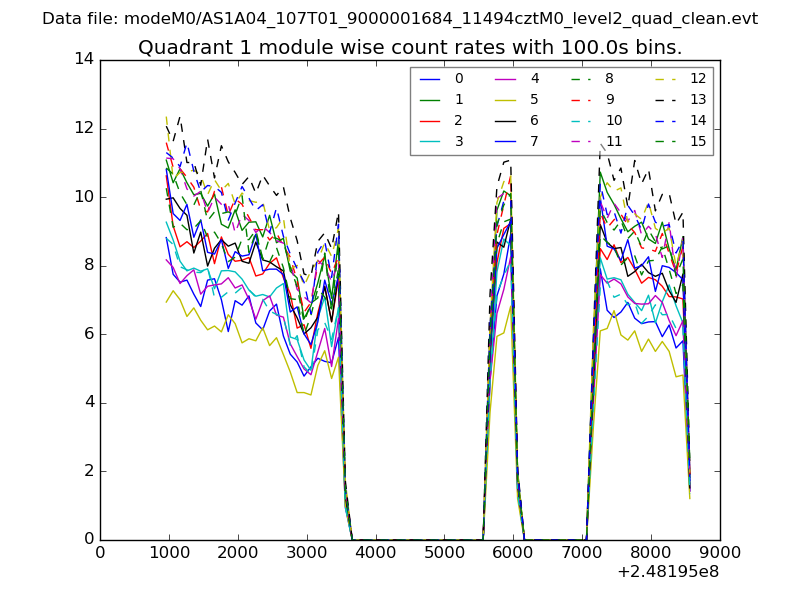
| Module-wise count rates for Quadrant A Data is divided into 100 sec bins |
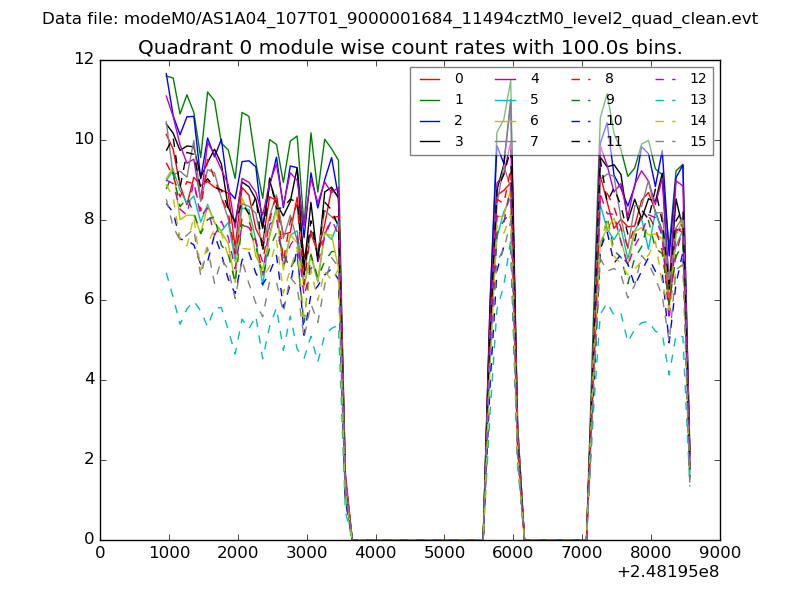 |
 |
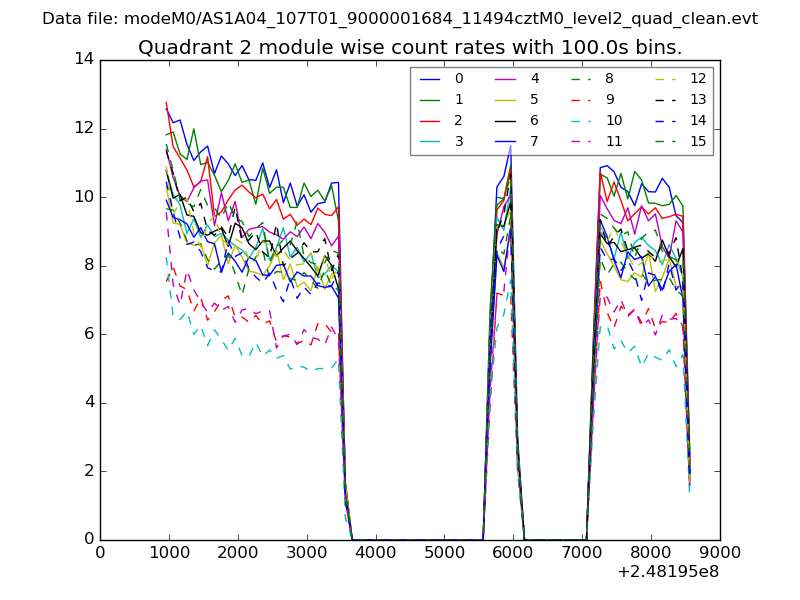
| Module-wise count rates for Quadrant B Data is divided into 100 sec bins |
 |
 |
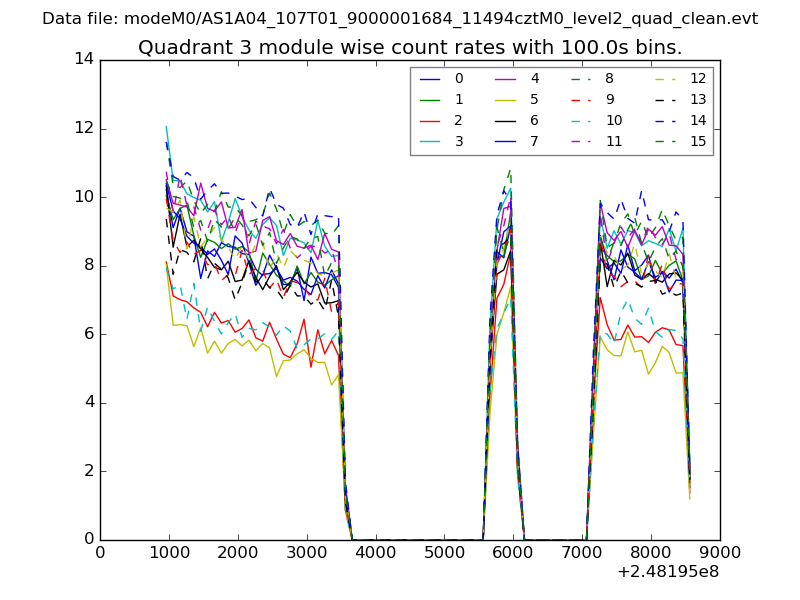
| Module-wise count rates for Quadrant C Data is divided into 100 sec bins |
 |
 |
| Module-wise count rates for Quadrant D Data is divided into 100 sec bins |
 |
 |
| Parameter | Plot |
|---|---|
| CZT HV Monitor | 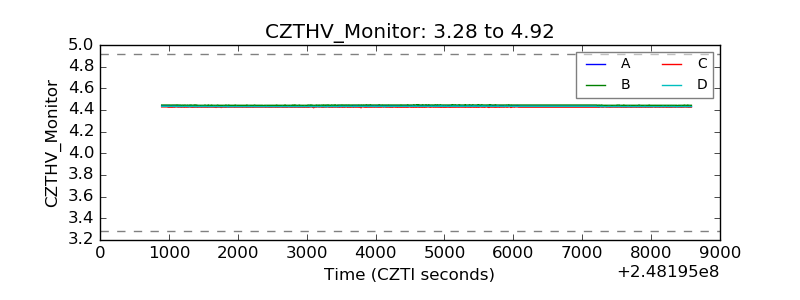 |
| D_VDD | 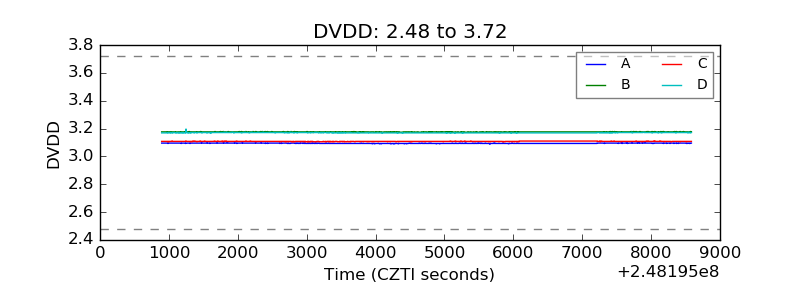 |
| Temperature 1 | 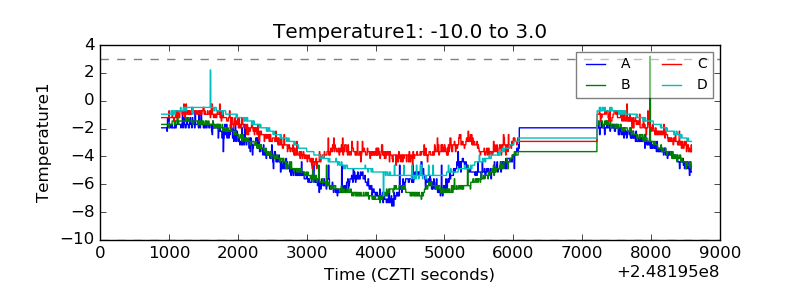 |
| Veto HV Monitor | 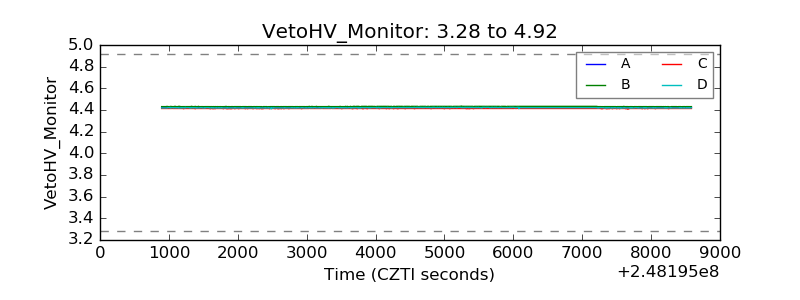 |
| Veto LLD |  |
| Alpha Counter | 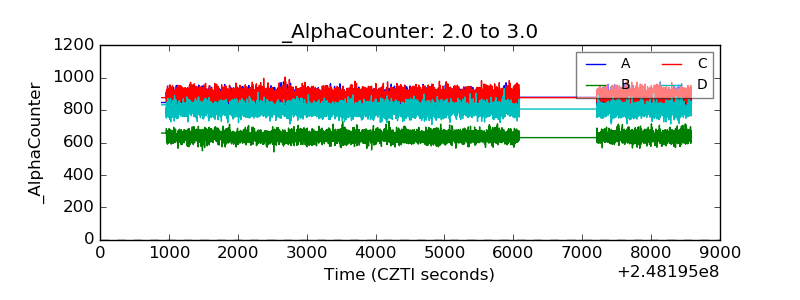 |
| _CPM_Rate | 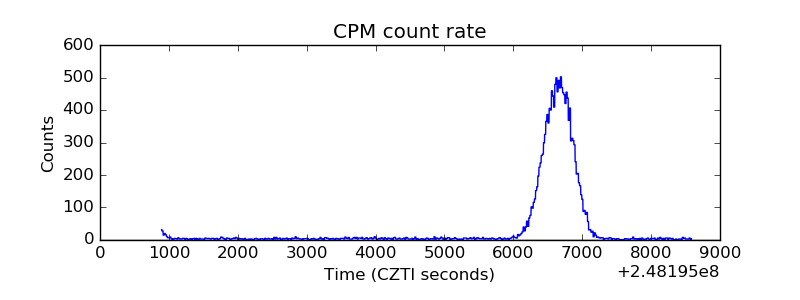 |
| CZT Counter | 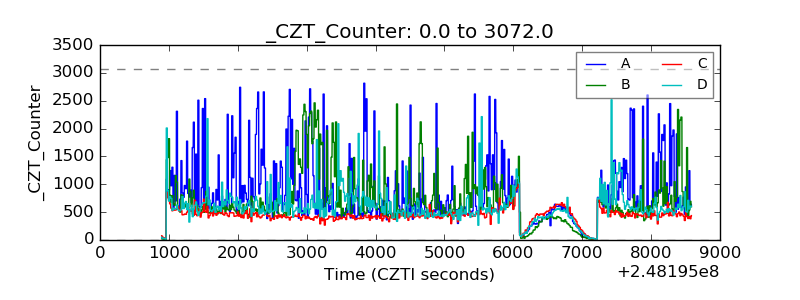 |
| +2.5 Volts monitor |  |
| +5 Volts monitor | 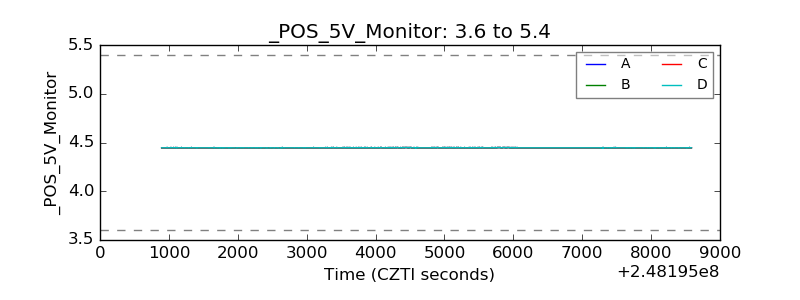 |
| _ROLL_ROT |  |
| _Roll_DEC | 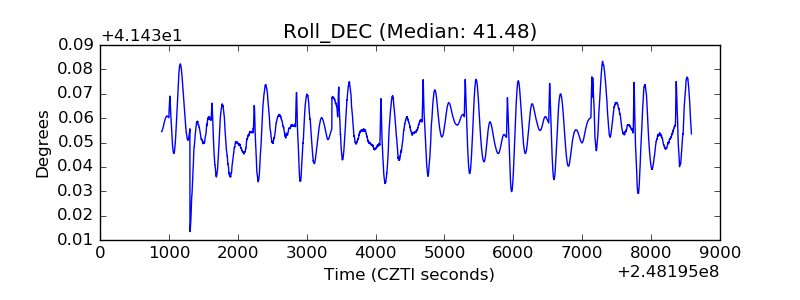 |
| _Roll_RA | 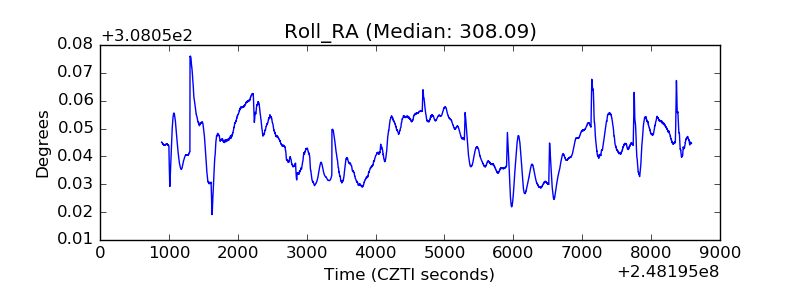 |
| Veto Counter |  |