| Param | Original file | Final file |
|---|---|---|
| Filename | modeM0/AS1A04_021T05_9000001686cztM0_level2.fits | modeM0/AS1A04_021T05_9000001686cztM0_level2_quad_clean.evt |
| Size (bytes) | 599,610,240 | 583,079,040 |
| Size | 571.8 MB | 556.1 MB |
| Events in quadrant A | 3,456,178 | 3,073,071 |
| Events in quadrant B | 3,382,894 | 3,261,496 |
| Events in quadrant C | 3,702,516 | 3,663,357 |
| Events in quadrant D | 3,137,230 | 3,188,026 |
| Mode M9 | |||
|---|---|---|---|
| Quadrant | BADHDUFLAG | Total packets | Discarded packets |
| A | 0 | 100 | 0 |
| B | 0 | 100 | 0 |
| C | 0 | 100 | 0 |
| D | 0 | 100 | 0 |
| Mode SS | |||
|---|---|---|---|
| Quadrant | BADHDUFLAG | Total packets | Discarded packets |
| A | 0 | 1330 | 0 |
| B | 0 | 1330 | 0 |
| C | 0 | 1330 | 0 |
| D | 0 | 1330 | 0 |
| Mode M0 | |||
|---|---|---|---|
| Quadrant | BADHDUFLAG | Total packets | Discarded packets |
| A | 0 | 243867 | 0 |
| B | 0 | 213563 | 0 |
| C | 0 | 133705 | 0 |
| D | 0 | 172142 | 0 |
| Quadrant | Total seconds | Saturated seconds | Saturation percentage |
|---|---|---|---|
| A | 65186 | 10612 | 16.279569% |
| B | 65186 | 8675 | 13.308072% |
| C | 65186 | 465 | 0.713343% |
| D | 65186 | 3018 | 4.629828% |
Noise dominated data is calculated using 1-second bins in cleaned event files. If a bin has >2000 counts, and if more than 50% of those come from <1% of pixels, then it is considered to be noise-dominated and hence unusable.
| Quadrant | # 1 sec bins | Bins with >0 counts | Bins with >2000 counts | High rate bins dominated by noise | Noise dominated (total time) | Noise dominated (detector-on time) | Marked lightcurve |
|---|---|---|---|---|---|---|---|
| A | 75226 | 65005 | 0 | 0 | 0.00% | 0.00% |  |
| B | 75226 | 65059 | 0 | 0 | 0.00% | 0.00% | 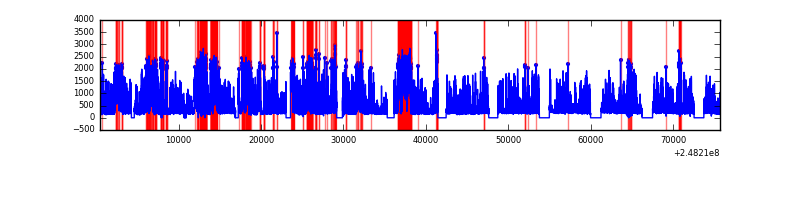 |
| C | 75226 | 65186 | 0 | 0 | 0.00% | 0.00% |  |
| D | 75226 | 65112 | 0 | 0 | 0.00% | 0.00% |  |
Top three noisy pixels from each quadrant. If the there are fewer than three noisy pixels in the level2.evt file, extra rows are filled as -1
| Pixel properties | Quadrant properties | ||||||
|---|---|---|---|---|---|---|---|
| Quadrant | DetID | PixID | Counts | Sigma | Mean | Median | Sigma |
| A | 0 | 29 | 3334 | 11.04 | 899 | 841 | 225.7 |
| A | 7 | 110 | 2838 | 8.85 | 899 | 841 | 225.7 |
| A | 9 | 19 | 2569 | 7.66 | 899 | 841 | 225.7 |
| B | 2 | 9 | 2970 | 11.94 | 891 | 847 | 177.8 |
| B | 3 | 17 | 2276 | 8.04 | 891 | 847 | 177.8 |
| B | 14 | 254 | 2214 | 7.69 | 891 | 847 | 177.8 |
| C | 1 | 80 | 2788 | 7.44 | 976 | 909 | 252.5 |
| C | 1 | 81 | 2737 | 7.24 | 976 | 909 | 252.5 |
| C | 12 | 241 | 2545 | 6.48 | 976 | 909 | 252.5 |
| D | 6 | 231 | 2319 | 6.27 | 896 | 815 | 239.9 |
| D | 3 | 14 | 2256 | 6.01 | 896 | 815 | 239.9 |
| D | 7 | 5 | 2236 | 5.92 | 896 | 815 | 239.9 |
Histogram calculated using DETX and DETY for each event in the final _common_clean file
| Quadrant A | 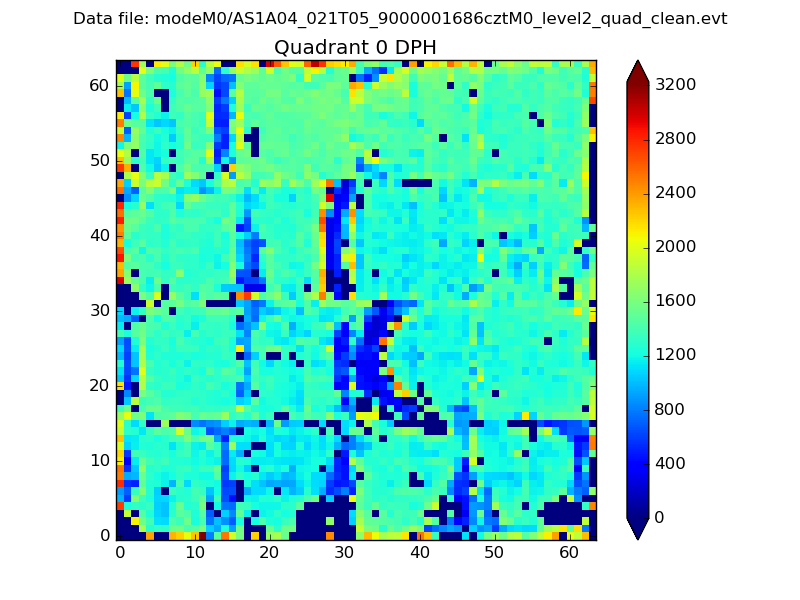 |
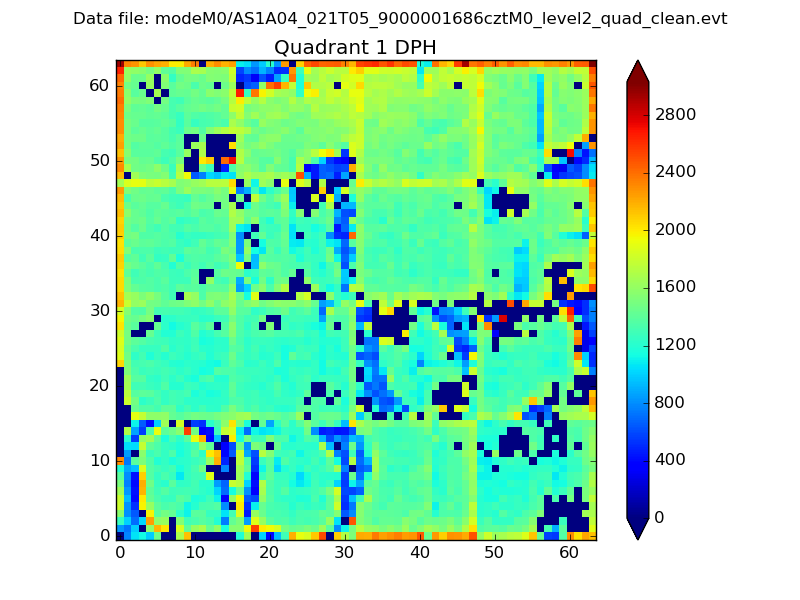 |
Quadrant B |
|---|---|---|---|
| Quadrant D |  |
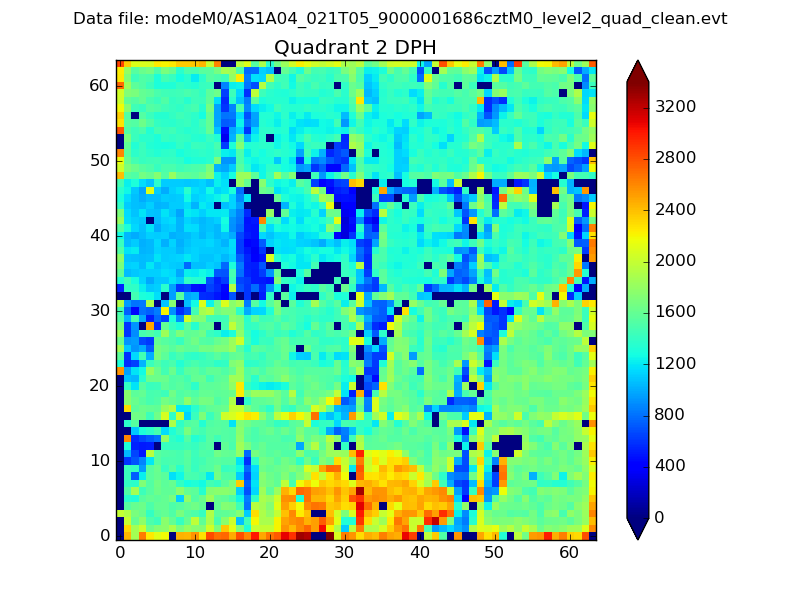 |
Quadrant C |
| Plot type | Count rate plots | Images |
|---|---|---|
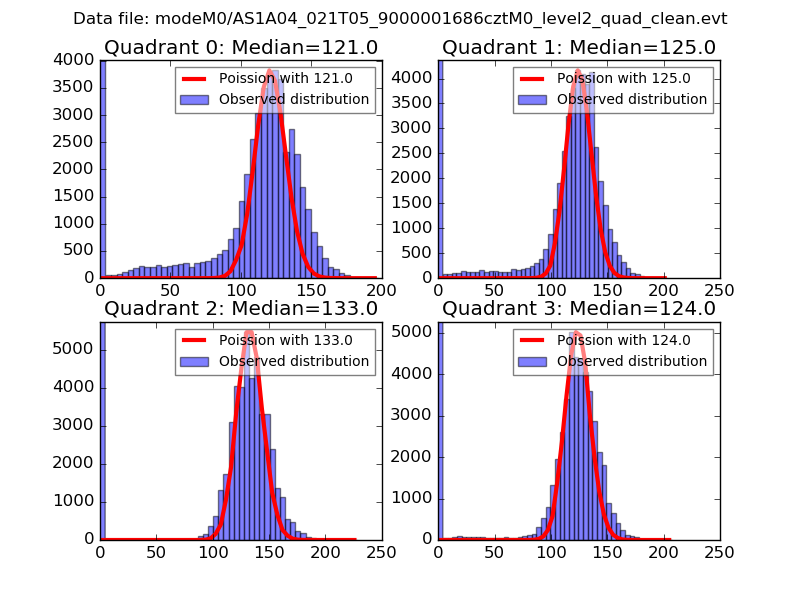
| Comparison with Poisson distribution Blue bars denote a histogram of data divided into 1 sec bins. Red curve is a Poisson curve with rate = median count rate of data. |
 |
 |
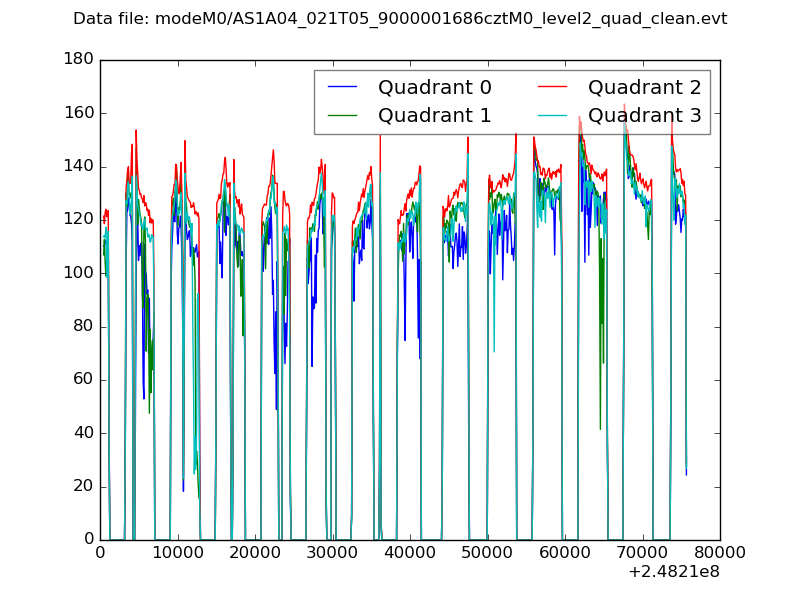
| Quadrant-wise count rates Data is divided into 100 sec bins |
 |
|
| Module-wise count rates for Quadrant A Data is divided into 100 sec bins |
 |
 |
| Module-wise count rates for Quadrant B Data is divided into 100 sec bins |
 |
 |
| Module-wise count rates for Quadrant C Data is divided into 100 sec bins |
 |
 |
| Module-wise count rates for Quadrant D Data is divided into 100 sec bins |
 |
 |
| Parameter | Plot |
|---|---|
| CZT HV Monitor |  |
| D_VDD |  |
| Temperature 1 | 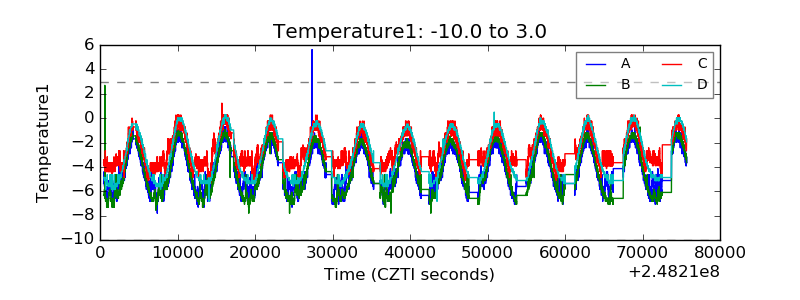 |
| Veto HV Monitor | 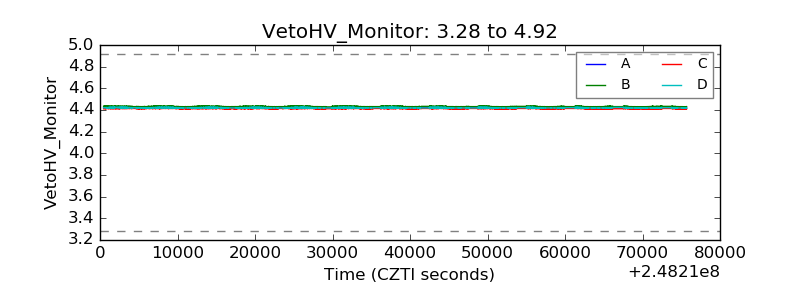 |
| Veto LLD | 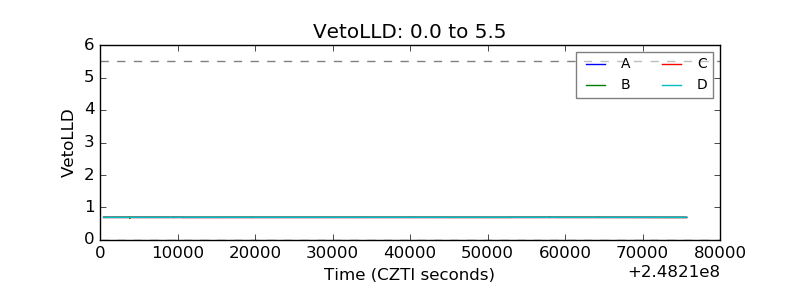 |
| Alpha Counter |  |
| _CPM_Rate | 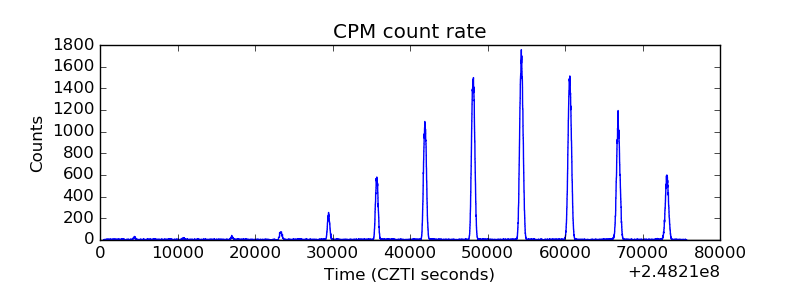 |
| CZT Counter |  |
| +2.5 Volts monitor |  |
| +5 Volts monitor | 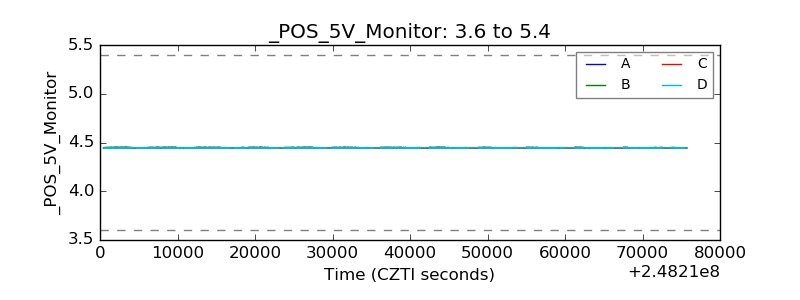 |
| _ROLL_ROT |  |
| _Roll_DEC |  |
| _Roll_RA | 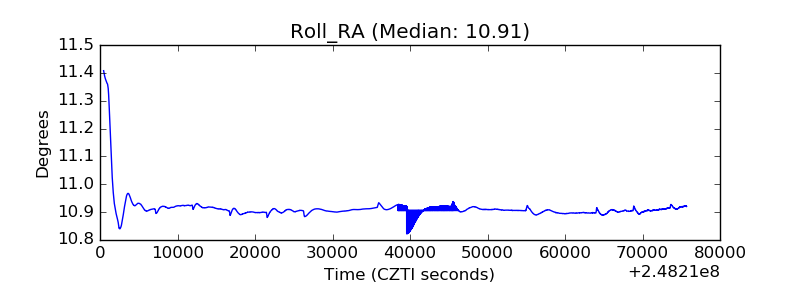 |
| Veto Counter | 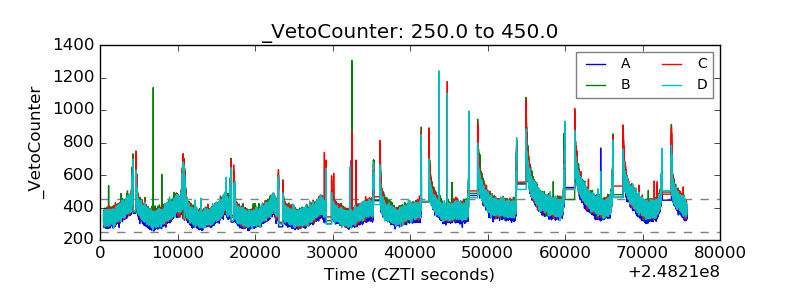 |