| Param | Original file | Final file |
|---|---|---|
| Filename | modeM0/AS1A04_021T05_9000001686_11496cztM0_level2.evt | modeM0/AS1A04_021T05_9000001686_11496cztM0_level2_quad_clean.evt |
| Size (bytes) | 548,516,160 | 62,994,240 |
| Size | 523.1 MB | 60.1 MB |
| Events in quadrant A | 5,439,176 | 346,946 |
| Events in quadrant B | 5,293,506 | 376,933 |
| Events in quadrant C | 2,433,254 | 420,893 |
| Events in quadrant D | 3,084,776 | 389,056 |
| Mode M9 | |||
|---|---|---|---|
| Quadrant | BADHDUFLAG | Total packets | Discarded packets |
| A | 0 | 4 | 0 |
| B | 0 | 4 | 0 |
| C | 0 | 4 | 0 |
| D | 0 | 4 | 0 |
| Mode SS | |||
|---|---|---|---|
| Quadrant | BADHDUFLAG | Total packets | Discarded packets |
| A | 0 | 108 | 0 |
| B | 0 | 108 | 0 |
| C | 0 | 108 | 0 |
| D | 0 | 108 | 0 |
| Mode M0 | |||
|---|---|---|---|
| Quadrant | BADHDUFLAG | Total packets | Discarded packets |
| A | 0 | 19924 | 2 |
| B | 0 | 19324 | 1 |
| C | 0 | 10998 | 1 |
| D | 0 | 12726 | 1 |
| Quadrant | Total seconds | Saturated seconds | Saturation percentage |
|---|---|---|---|
| A | 5328 | 957 | 17.961712% |
| B | 5328 | 1067 | 20.026276% |
| C | 5328 | 14 | 0.262763% |
| D | 5328 | 113 | 2.120871% |
Noise dominated data is calculated using 1-second bins in cleaned event files. If a bin has >2000 counts, and if more than 50% of those come from <1% of pixels, then it is considered to be noise-dominated and hence unusable.
| Quadrant | # 1 sec bins | Bins with >0 counts | Bins with >2000 counts | High rate bins dominated by noise | Noise dominated (total time) | Noise dominated (detector-on time) | Marked lightcurve |
|---|---|---|---|---|---|---|---|
| A | 5689 | 5330 | 518 | 518 | 9.11% | 9.72% | 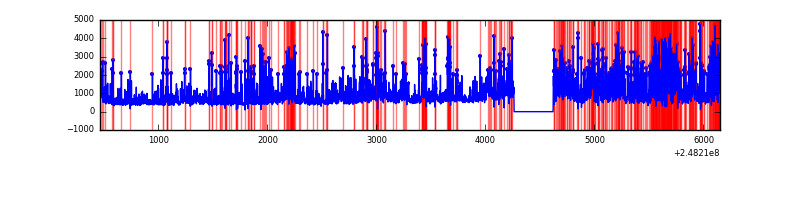 |
| B | 5689 | 5330 | 716 | 716 | 12.59% | 13.43% | 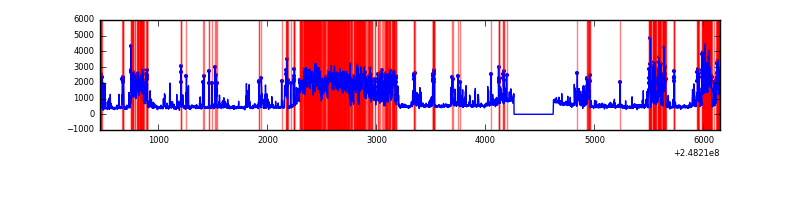 |
| C | 5689 | 5330 | 0 | 0 | 0.00% | 0.00% | 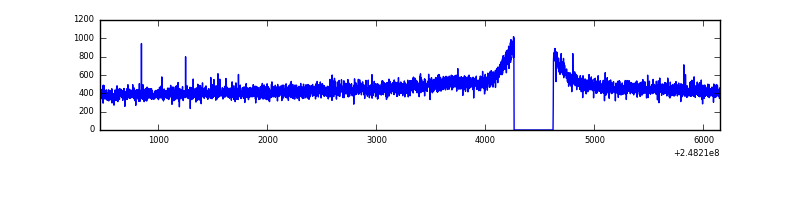 |
| D | 5689 | 5330 | 56 | 56 | 0.98% | 1.05% | 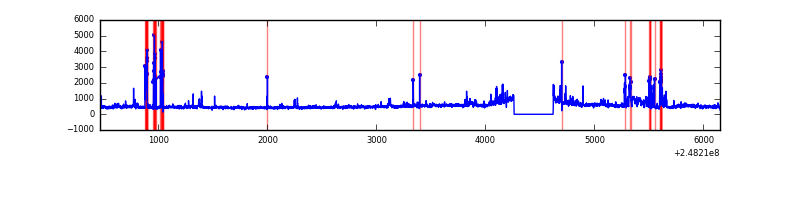 |
Top three noisy pixels from each quadrant. If the there are fewer than three noisy pixels in the level2.evt file, extra rows are filled as -1
| Pixel properties | Quadrant properties | ||||||
|---|---|---|---|---|---|---|---|
| Quadrant | DetID | PixID | Counts | Sigma | Mean | Median | Sigma |
| A | 8 | 5 | 3035724 | 25171.51 | 582 | 569 | 120.6 |
| A | 1 | 162 | 34368 | 280.3 | 582 | 569 | 120.6 |
| A | 9 | 143 | 28223 | 229.34 | 582 | 569 | 120.6 |
| B | 4 | 81 | 2056378 | 17949.05 | 592 | 577 | 114.5 |
| B | 4 | 239 | 717072 | 6255.67 | 592 | 577 | 114.5 |
| B | 11 | 51 | 145973 | 1269.44 | 592 | 577 | 114.5 |
| C | 13 | 61 | 4591 | 27.03 | 624 | 628 | 146.6 |
| C | 3 | 202 | 1473 | 5.76 | 624 | 628 | 146.6 |
| C | -1 | -1 | -1 | -1.0 | 624 | 628 | 146.6 |
| D | 1 | 52 | 236910 | 1581.82 | 614 | 596 | 149.4 |
| D | 13 | 152 | 133864 | 892.06 | 614 | 596 | 149.4 |
| D | 10 | 253 | 125070 | 833.19 | 614 | 596 | 149.4 |
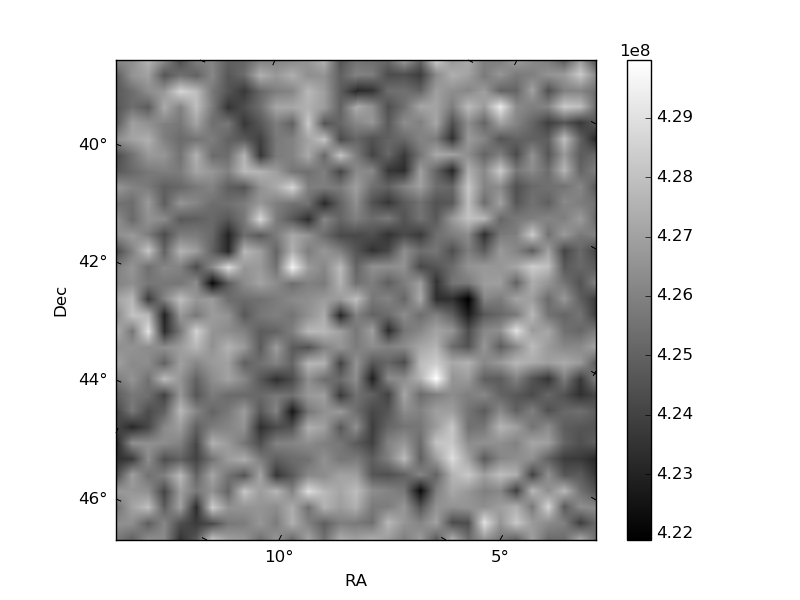
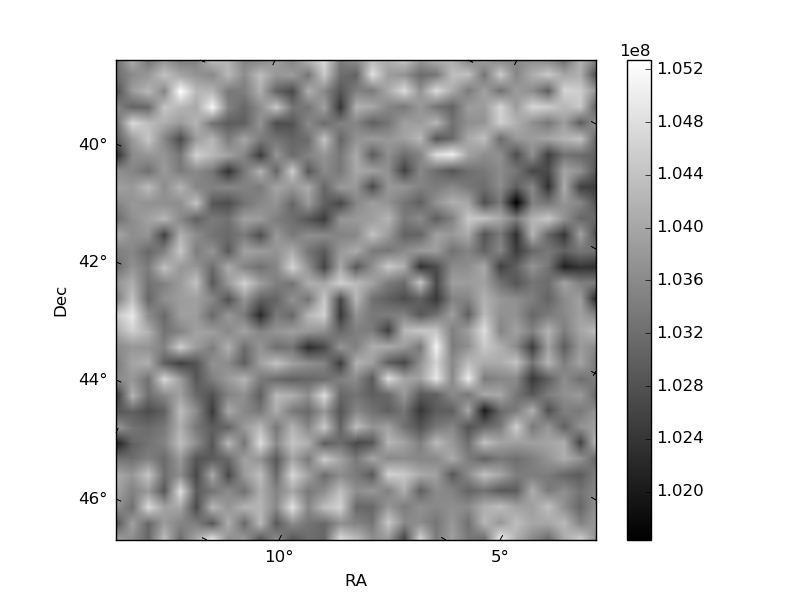
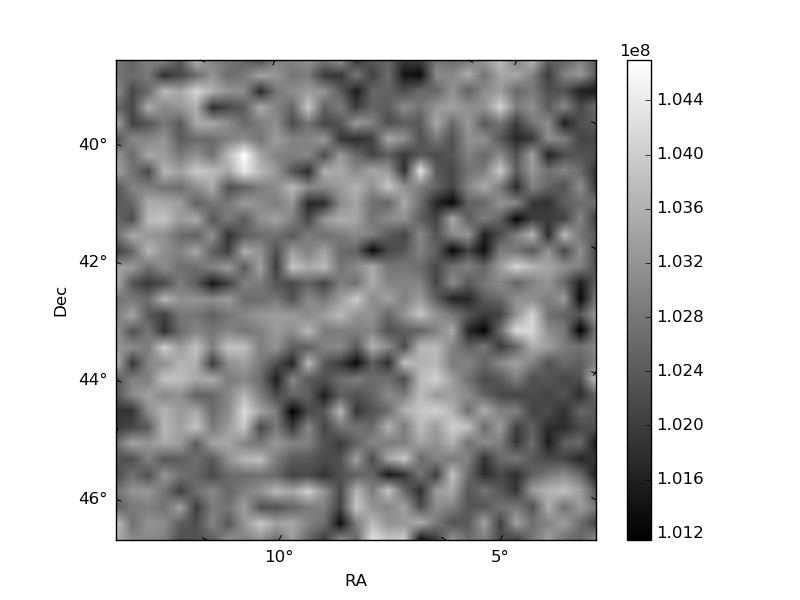
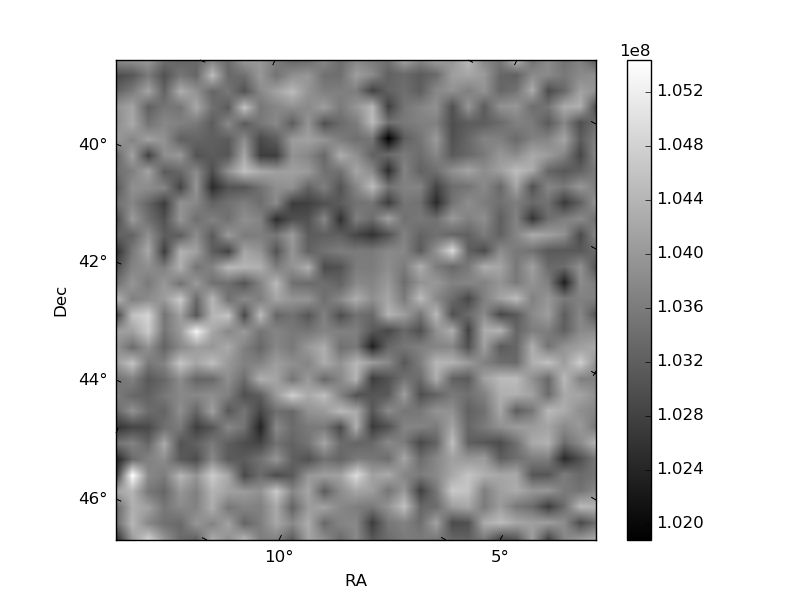
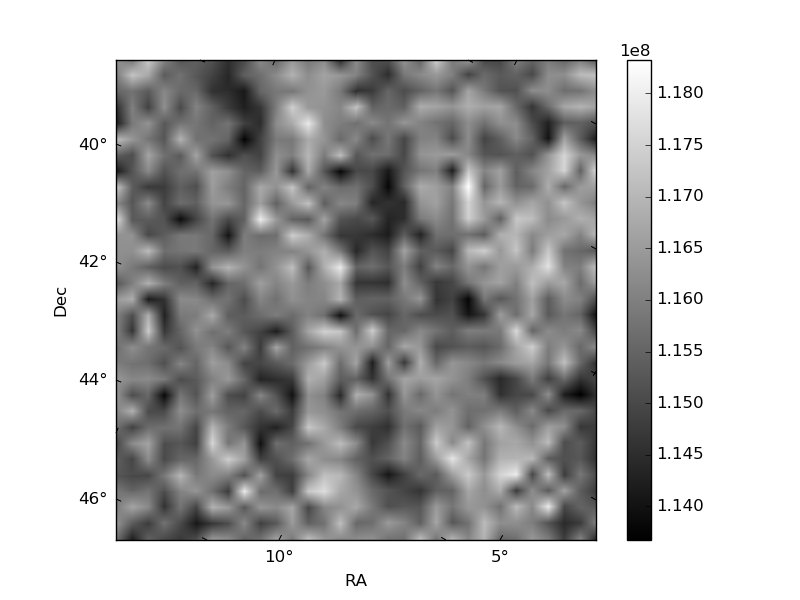
Histogram calculated using DETX and DETY for each event in the final _common_clean file
| Quadrant A | 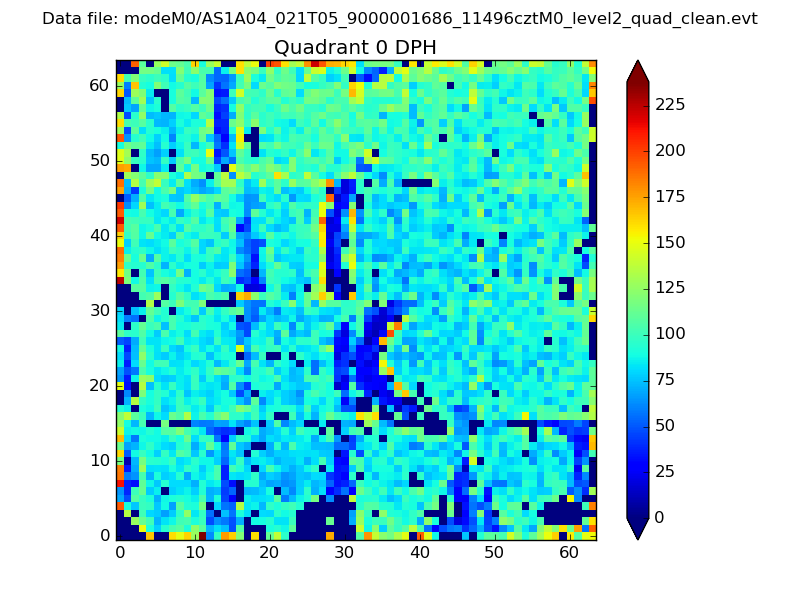 |
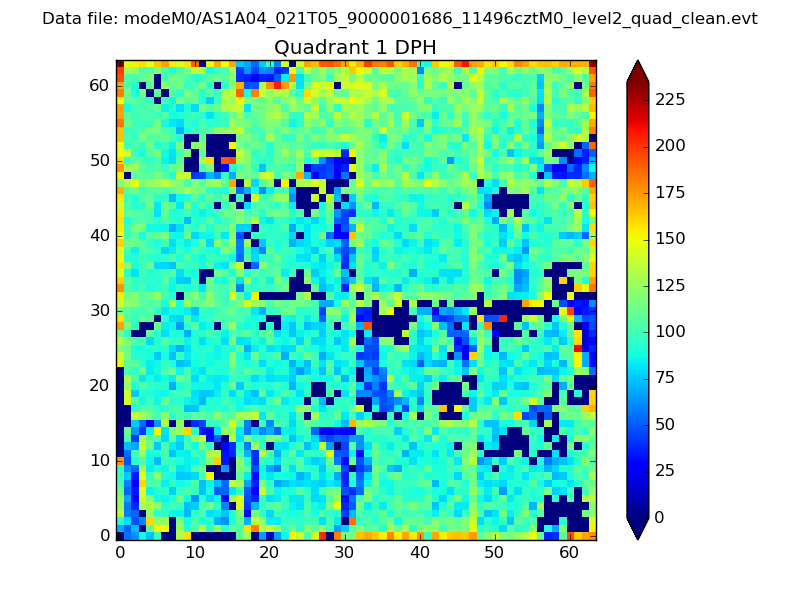 |
Quadrant B |
|---|---|---|---|
| Quadrant D | 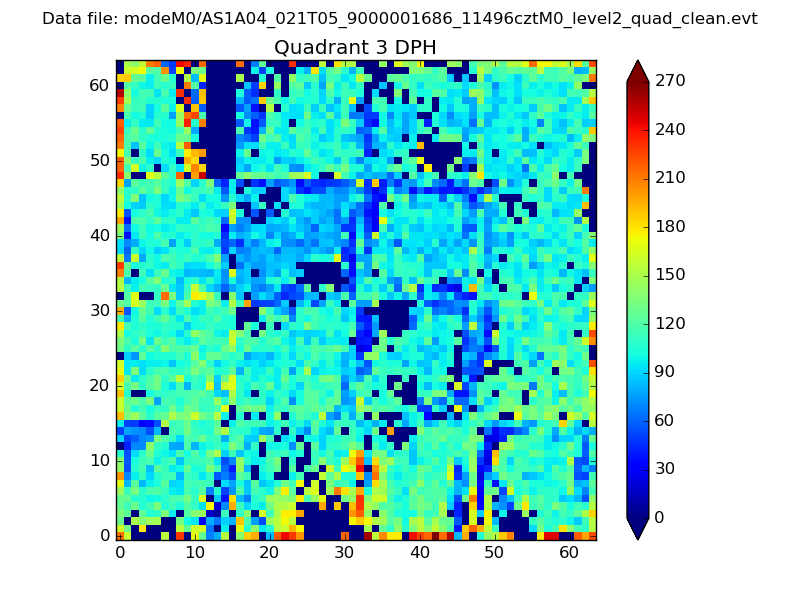 |
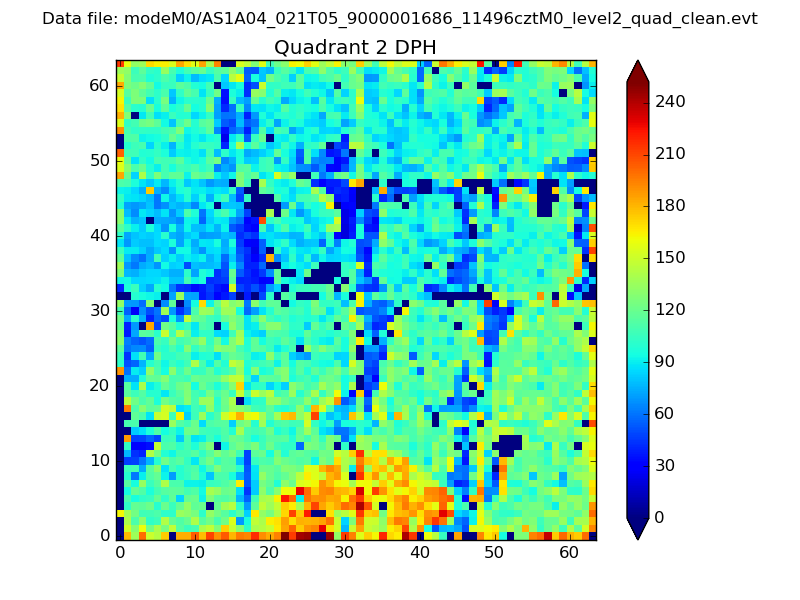 |
Quadrant C |
| Plot type | Count rate plots | Images |
|---|---|---|
| Comparison with Poisson distribution Blue bars denote a histogram of data divided into 1 sec bins. Red curve is a Poisson curve with rate = median count rate of data. |
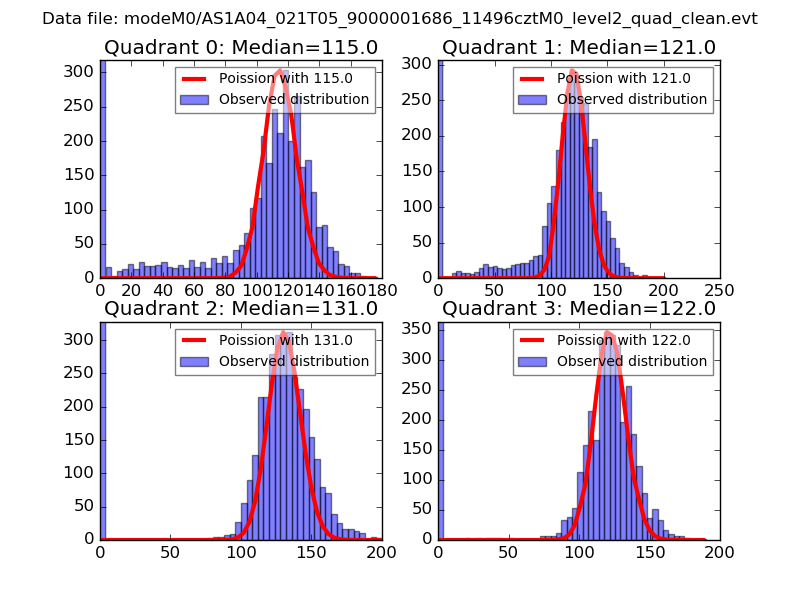 |
 |
| Quadrant-wise count rates Data is divided into 100 sec bins |
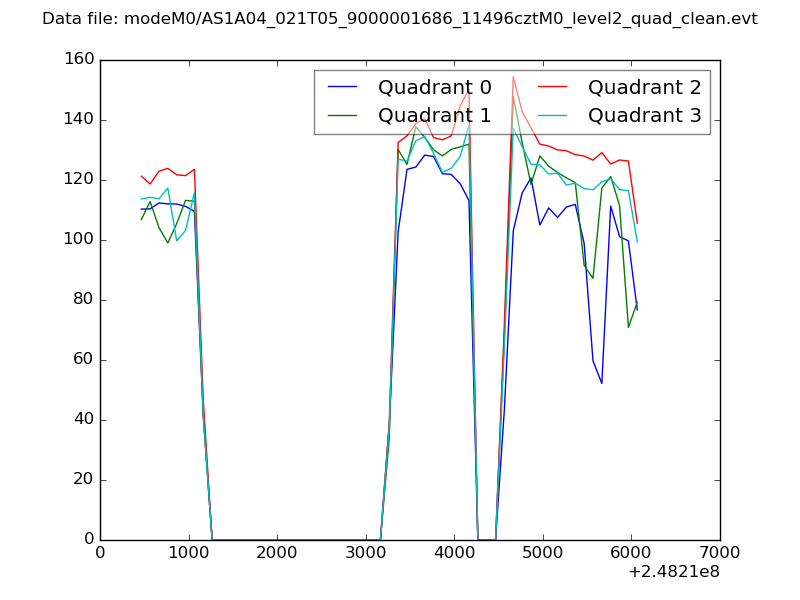 |
|
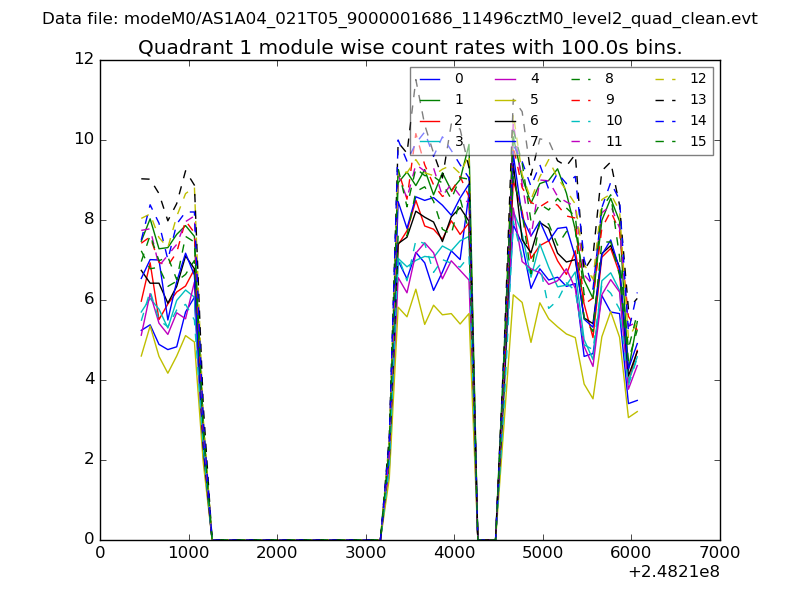
| Module-wise count rates for Quadrant A Data is divided into 100 sec bins |
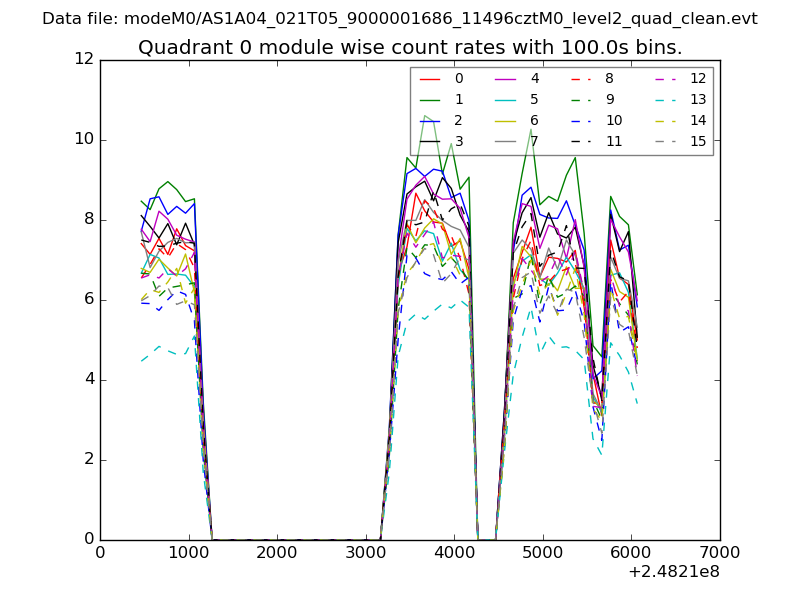 |
 |
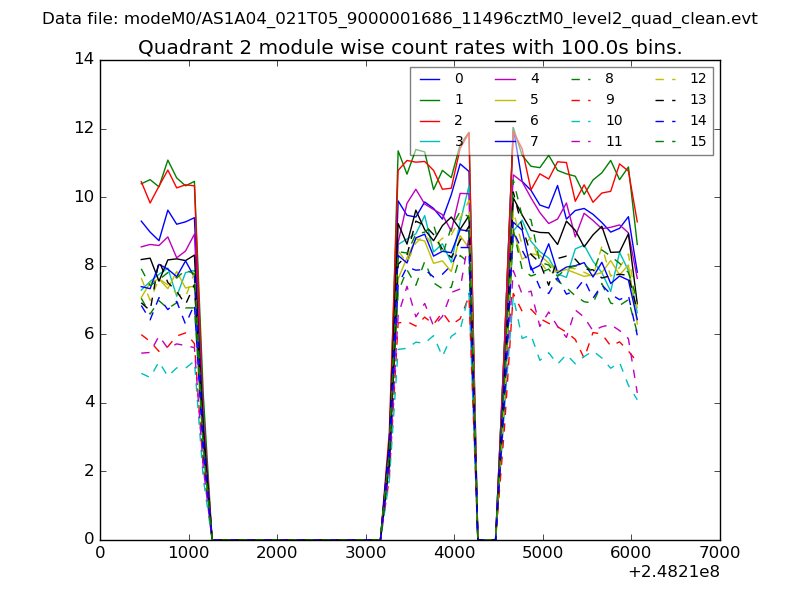
| Module-wise count rates for Quadrant B Data is divided into 100 sec bins |
 |
 |
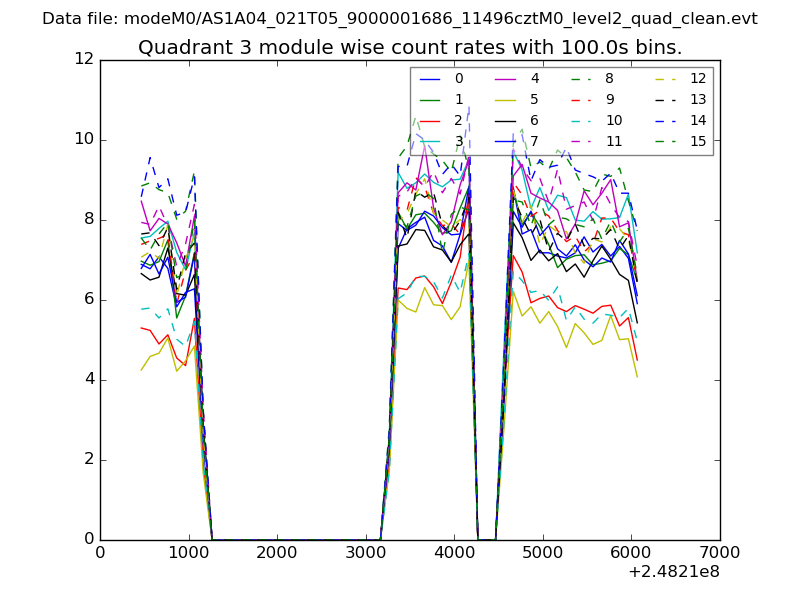
| Module-wise count rates for Quadrant C Data is divided into 100 sec bins |
 |
 |
| Module-wise count rates for Quadrant D Data is divided into 100 sec bins |
 |
 |
| Parameter | Plot |
|---|---|
| CZT HV Monitor | 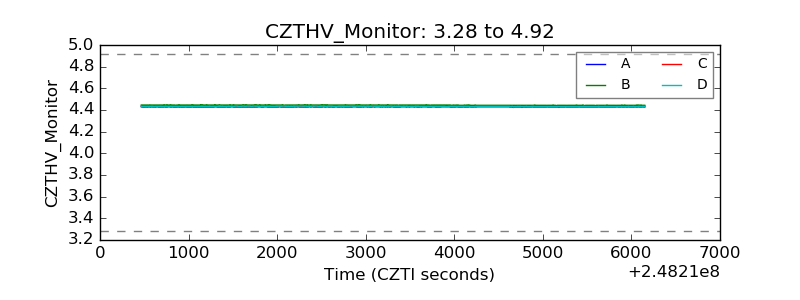 |
| D_VDD | 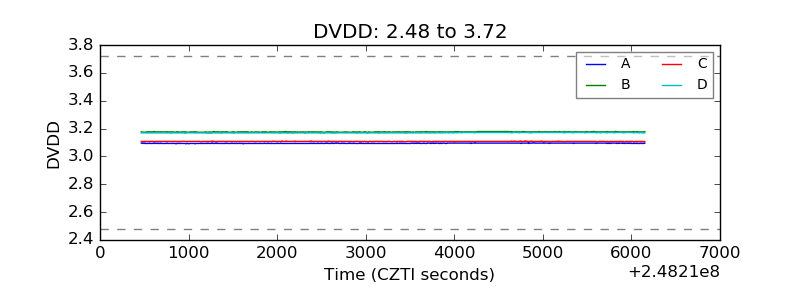 |
| Temperature 1 | 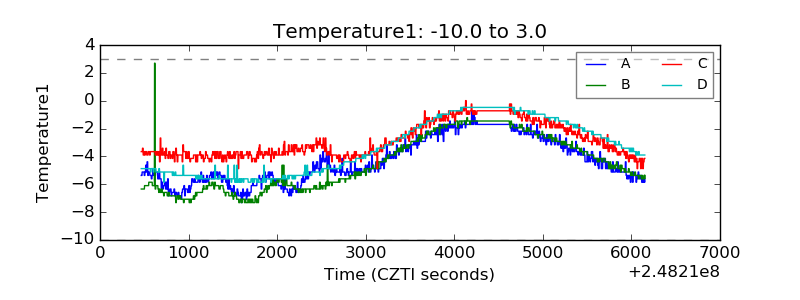 |
| Veto HV Monitor | 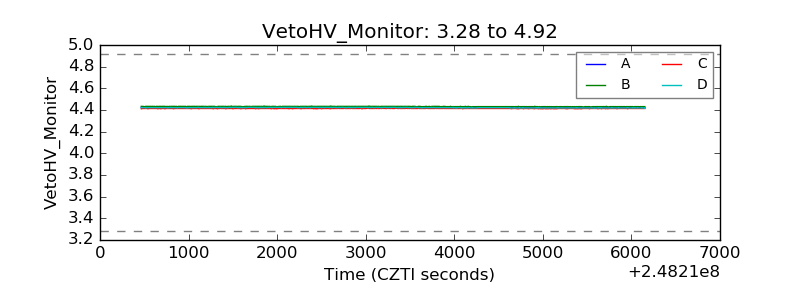 |
| Veto LLD | 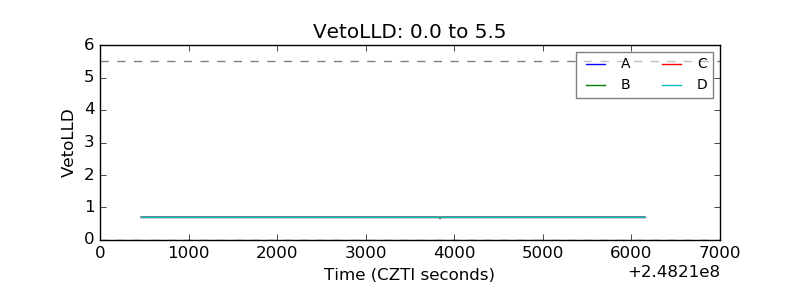 |
| Alpha Counter | 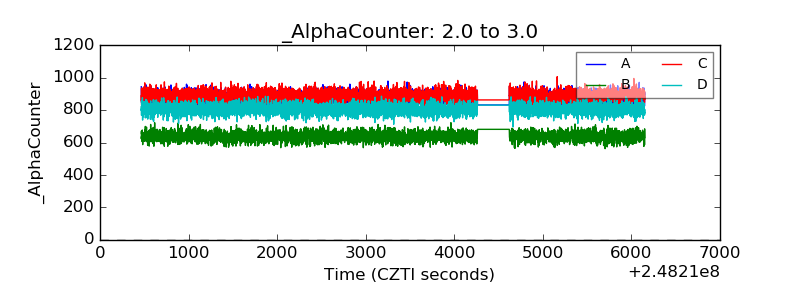 |
| _CPM_Rate | 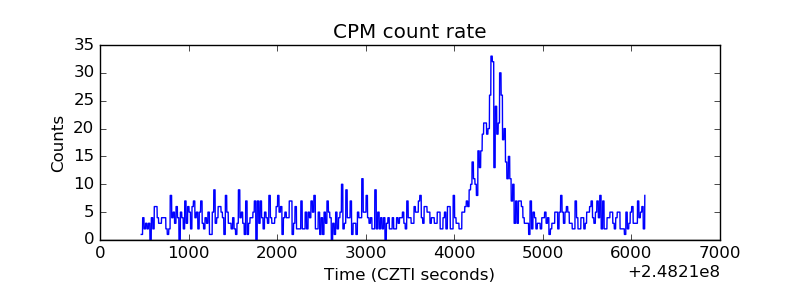 |
| CZT Counter | 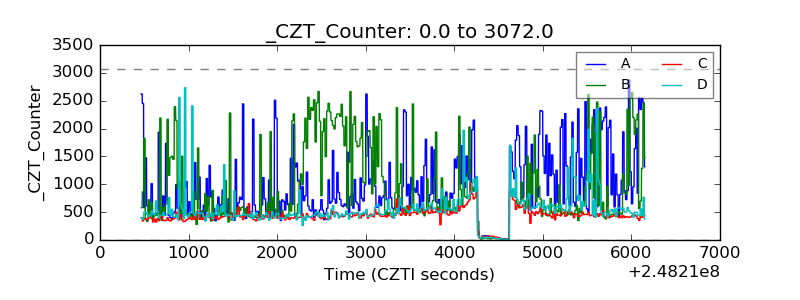 |
| +2.5 Volts monitor |  |
| +5 Volts monitor | 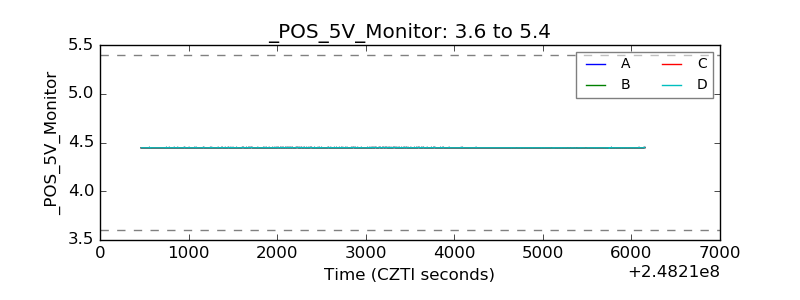 |
| _ROLL_ROT | 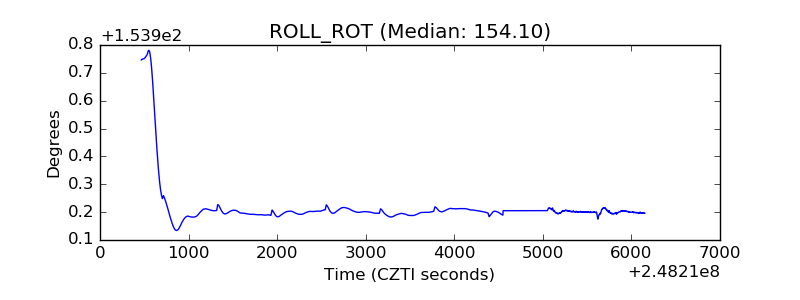 |
| _Roll_DEC | 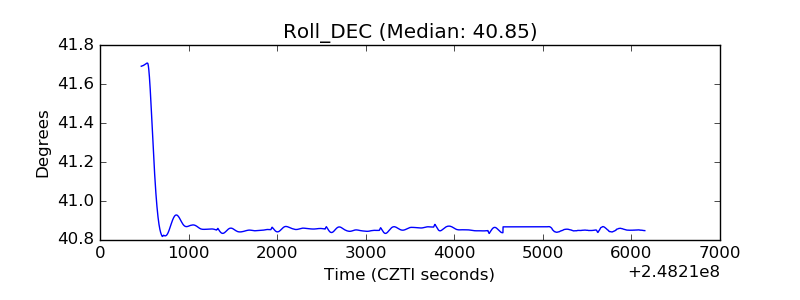 |
| _Roll_RA | 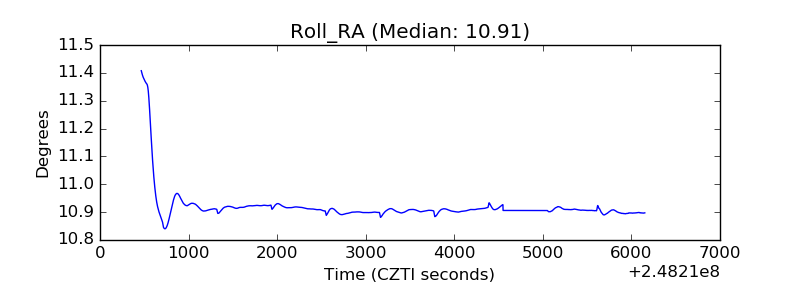 |
| Veto Counter | 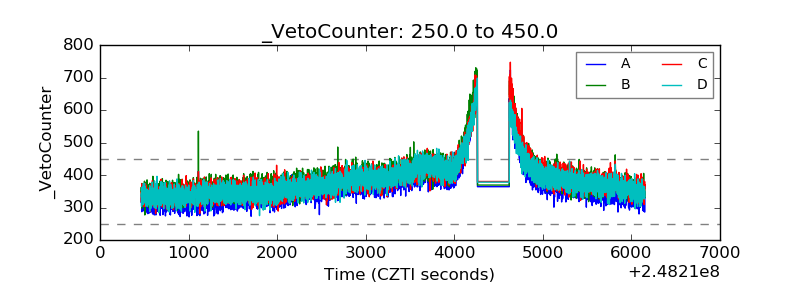 |