| Param | Original file | Final file |
|---|---|---|
| Filename | modeM0/AS1A04_021T05_9000001686_11497cztM0_level2.evt | modeM0/AS1A04_021T05_9000001686_11497cztM0_level2_quad_clean.evt |
| Size (bytes) | 963,529,920 | 112,550,400 |
| Size | 918.9 MB | 107.3 MB |
| Events in quadrant A | 10,312,291 | 649,973 |
| Events in quadrant B | 8,685,661 | 684,652 |
| Events in quadrant C | 3,811,537 | 799,564 |
| Events in quadrant D | 5,817,598 | 702,388 |
| Mode M9 | |||
|---|---|---|---|
| Quadrant | BADHDUFLAG | Total packets | Discarded packets |
| A | 0 | 6 | 0 |
| B | 0 | 6 | 0 |
| C | 0 | 6 | 0 |
| D | 0 | 6 | 0 |
| Mode SS | |||
|---|---|---|---|
| Quadrant | BADHDUFLAG | Total packets | Discarded packets |
| A | 0 | 170 | 0 |
| B | 0 | 170 | 0 |
| C | 0 | 170 | 0 |
| D | 0 | 170 | 0 |
| Mode M0 | |||
|---|---|---|---|
| Quadrant | BADHDUFLAG | Total packets | Discarded packets |
| A | 0 | 36390 | 4 |
| B | 0 | 31327 | 3 |
| C | 0 | 17104 | 3 |
| D | 0 | 22834 | 3 |
| Quadrant | Total seconds | Saturated seconds | Saturation percentage |
|---|---|---|---|
| A | 8211 | 2101 | 25.587626% |
| B | 8211 | 1693 | 20.618682% |
| C | 8211 | 40 | 0.487151% |
| D | 8211 | 651 | 7.928389% |
Noise dominated data is calculated using 1-second bins in cleaned event files. If a bin has >2000 counts, and if more than 50% of those come from <1% of pixels, then it is considered to be noise-dominated and hence unusable.
| Quadrant | # 1 sec bins | Bins with >0 counts | Bins with >2000 counts | High rate bins dominated by noise | Noise dominated (total time) | Noise dominated (detector-on time) | Marked lightcurve |
|---|---|---|---|---|---|---|---|
| A | 8752 | 8217 | 1290 | 1290 | 14.74% | 15.70% | 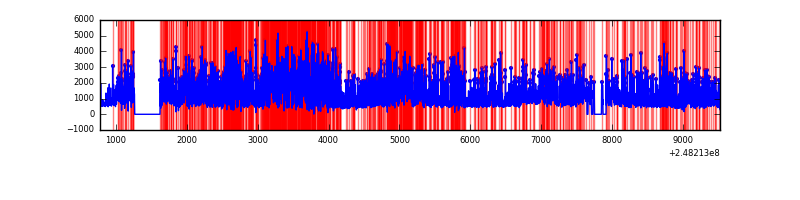 |
| B | 8752 | 8217 | 1264 | 1264 | 14.44% | 15.38% | 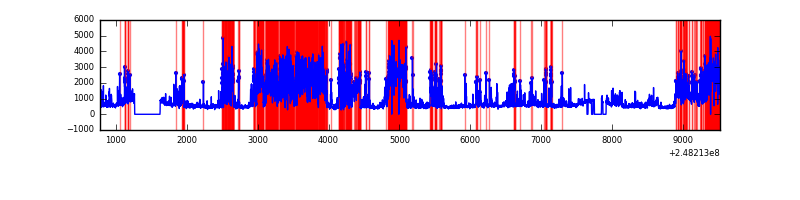 |
| C | 8752 | 8217 | 1 | 1 | 0.01% | 0.01% | 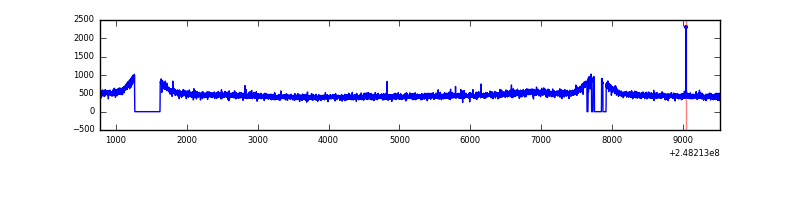 |
| D | 8752 | 8217 | 463 | 463 | 5.29% | 5.63% | 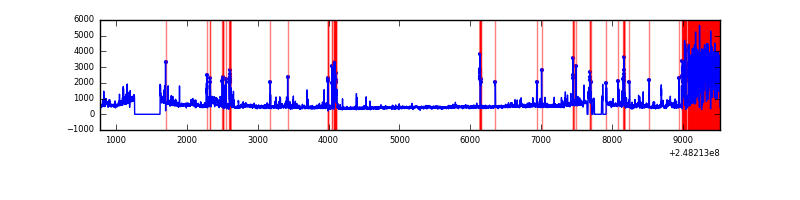 |
Top three noisy pixels from each quadrant. If the there are fewer than three noisy pixels in the level2.evt file, extra rows are filled as -1
| Pixel properties | Quadrant properties | ||||||
|---|---|---|---|---|---|---|---|
| Quadrant | DetID | PixID | Counts | Sigma | Mean | Median | Sigma |
| A | 8 | 5 | 6600768 | 36264.97 | 886 | 866 | 182.0 |
| A | 15 | 174 | 105418 | 574.49 | 886 | 866 | 182.0 |
| A | 9 | 143 | 57795 | 312.81 | 886 | 866 | 182.0 |
| B | 4 | 81 | 3914446 | 22498.3 | 905 | 882 | 173.9 |
| B | 4 | 239 | 808923 | 4645.27 | 905 | 882 | 173.9 |
| B | 11 | 51 | 307447 | 1762.38 | 905 | 882 | 173.9 |
| C | 13 | 61 | 7067 | 26.64 | 976 | 982 | 228.4 |
| C | 12 | 4 | 3939 | 12.95 | 976 | 982 | 228.4 |
| C | 14 | 67 | 2491 | 6.61 | 976 | 982 | 228.4 |
| D | 1 | 52 | 1527334 | 6774.01 | 931 | 905 | 225.3 |
| D | 2 | 120 | 237105 | 1048.21 | 931 | 905 | 225.3 |
| D | 8 | 195 | 187804 | 829.42 | 931 | 905 | 225.3 |
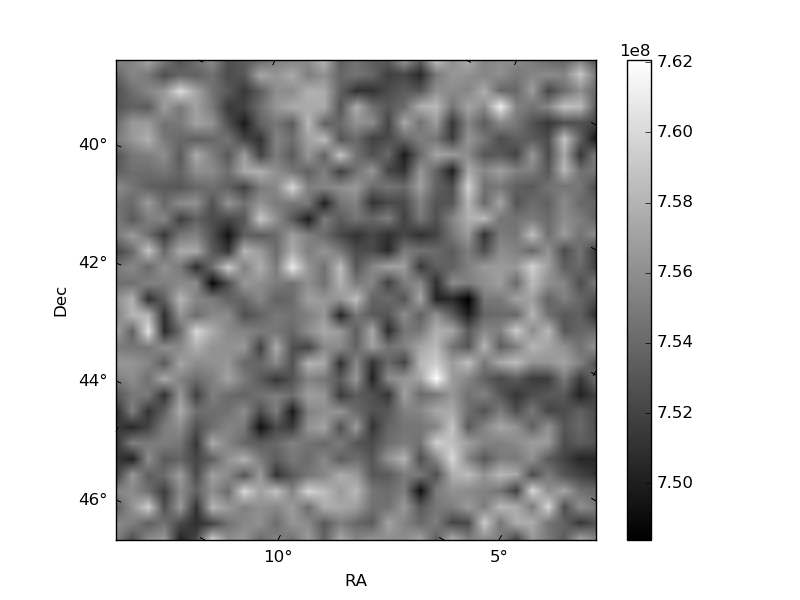
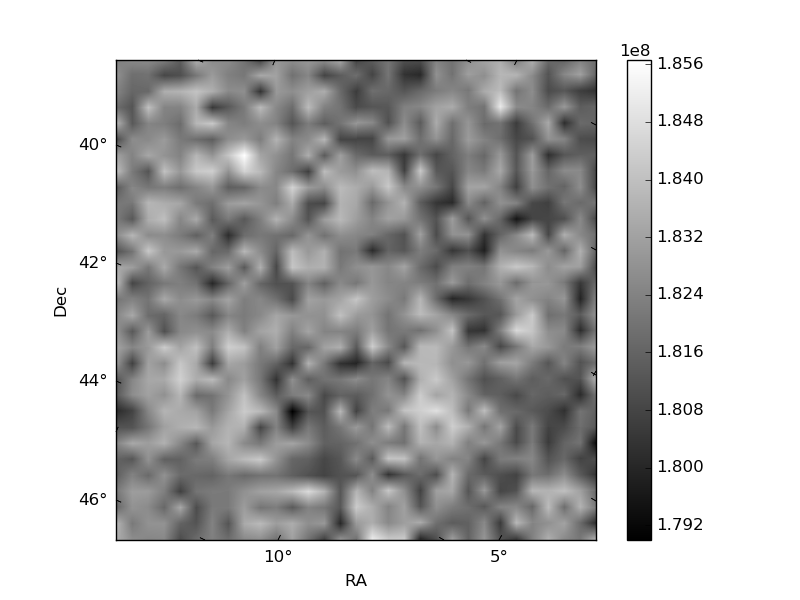
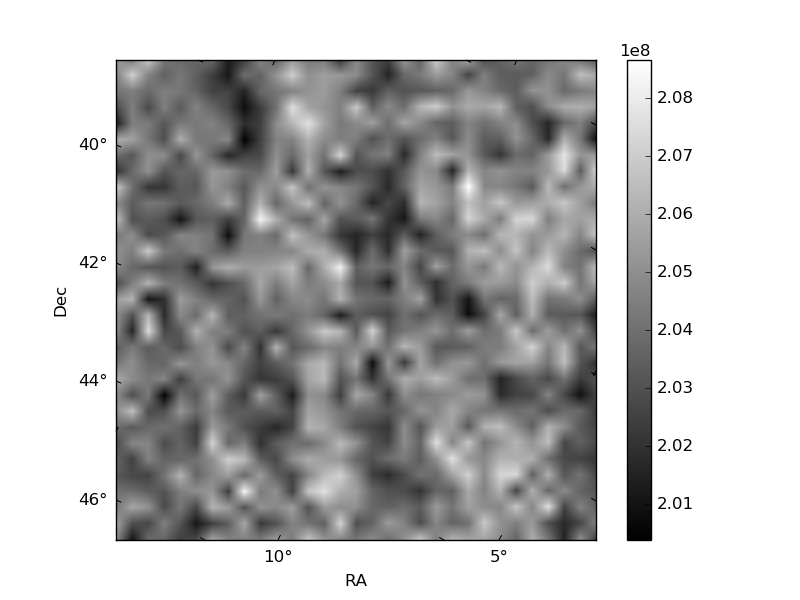
Histogram calculated using DETX and DETY for each event in the final _common_clean file
| Quadrant A | 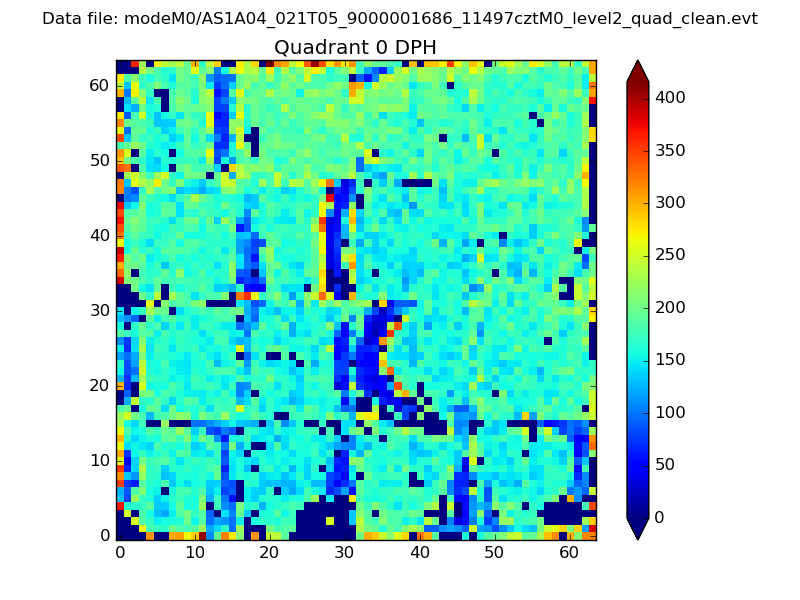 |
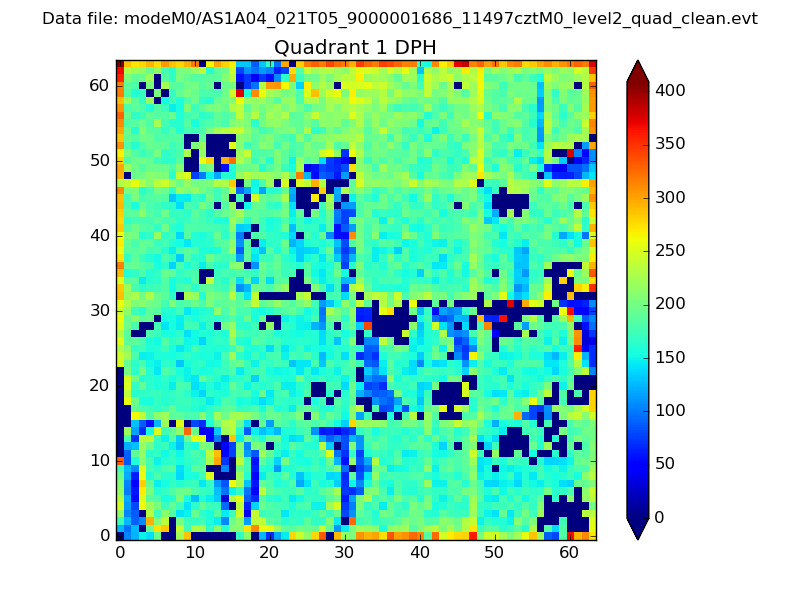 |
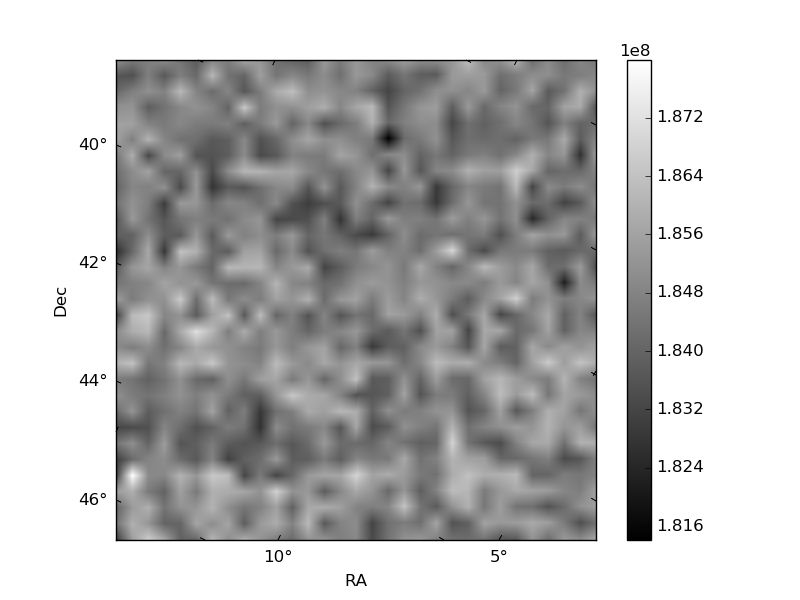
Quadrant B |
|---|---|---|---|
| Quadrant D | 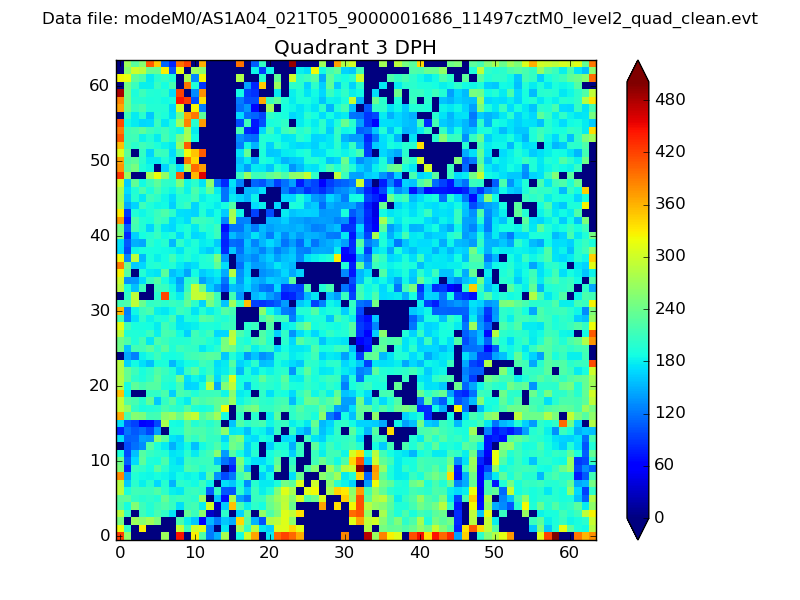 |
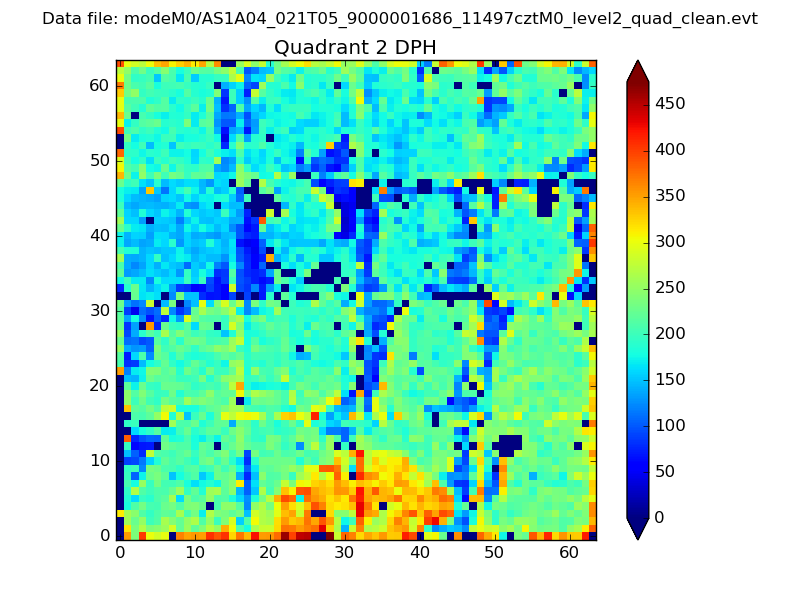 |
Quadrant C |
| Plot type | Count rate plots | Images |
|---|---|---|
| Comparison with Poisson distribution Blue bars denote a histogram of data divided into 1 sec bins. Red curve is a Poisson curve with rate = median count rate of data. |
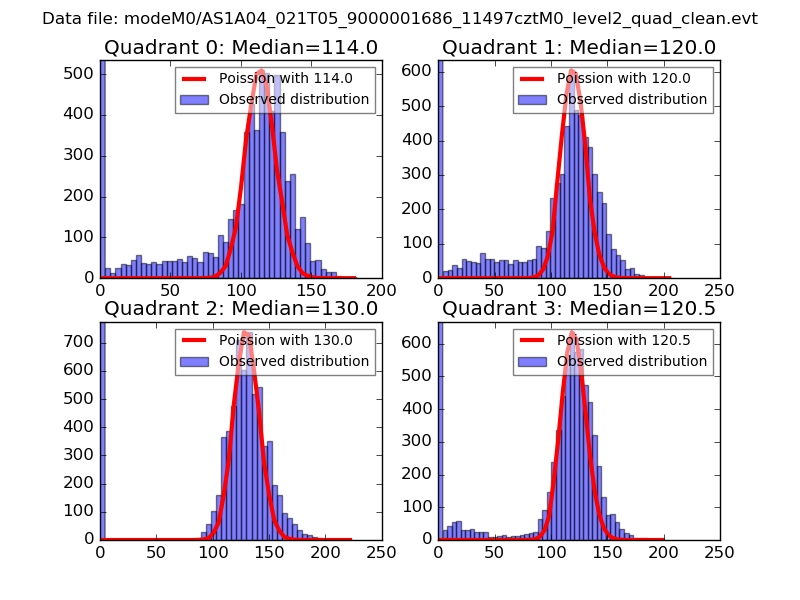 |
 |
| Quadrant-wise count rates Data is divided into 100 sec bins |
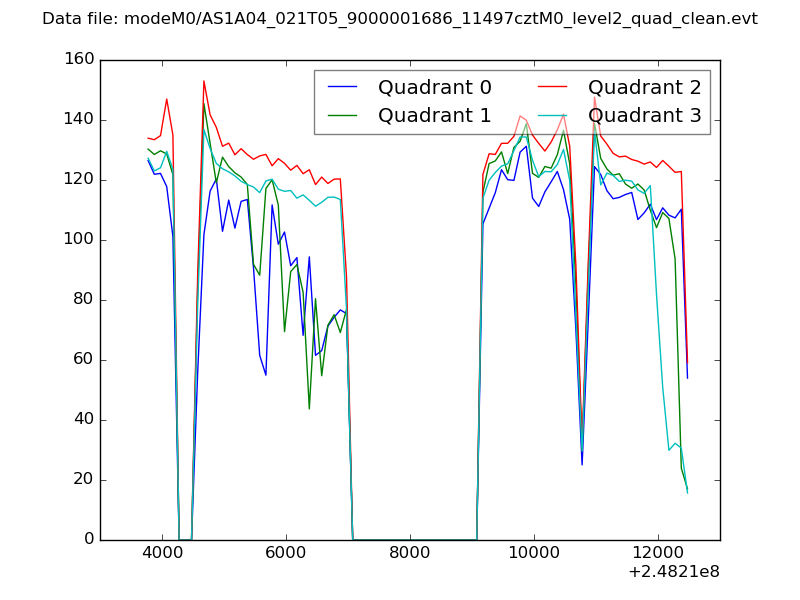 |
|
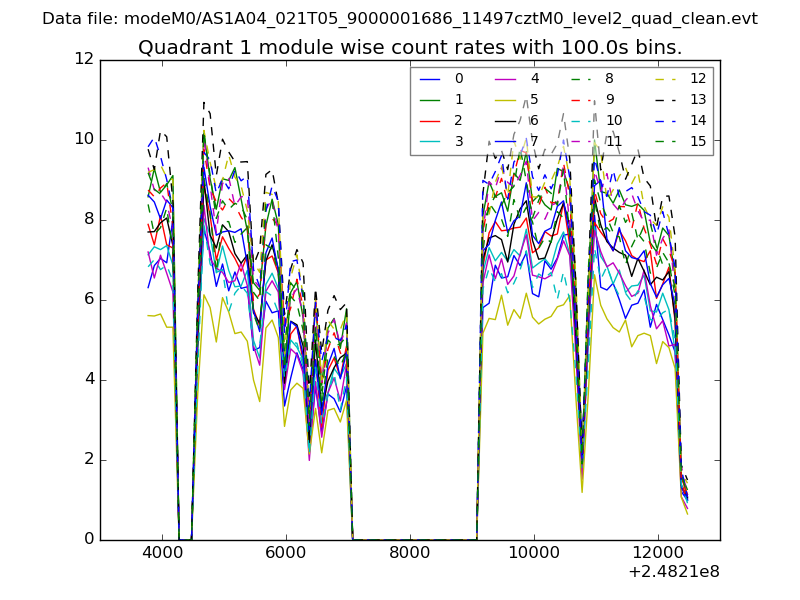
| Module-wise count rates for Quadrant A Data is divided into 100 sec bins |
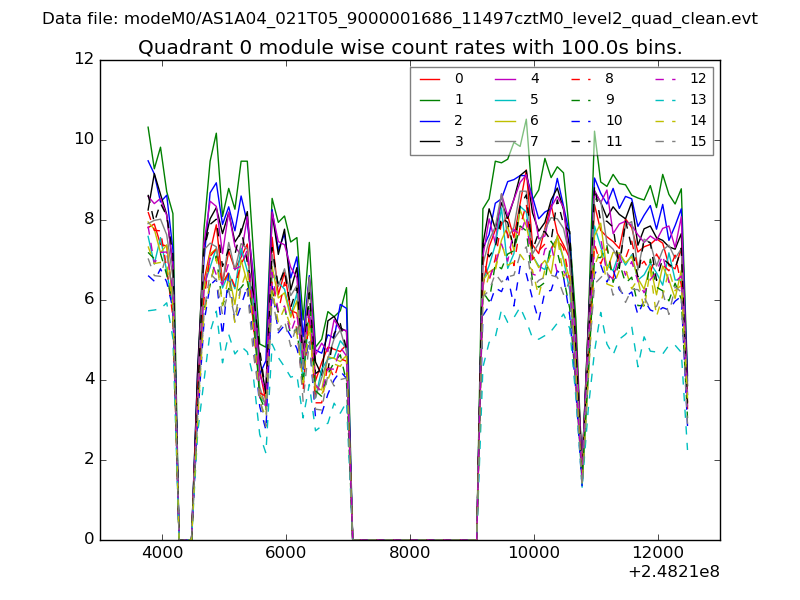 |
 |
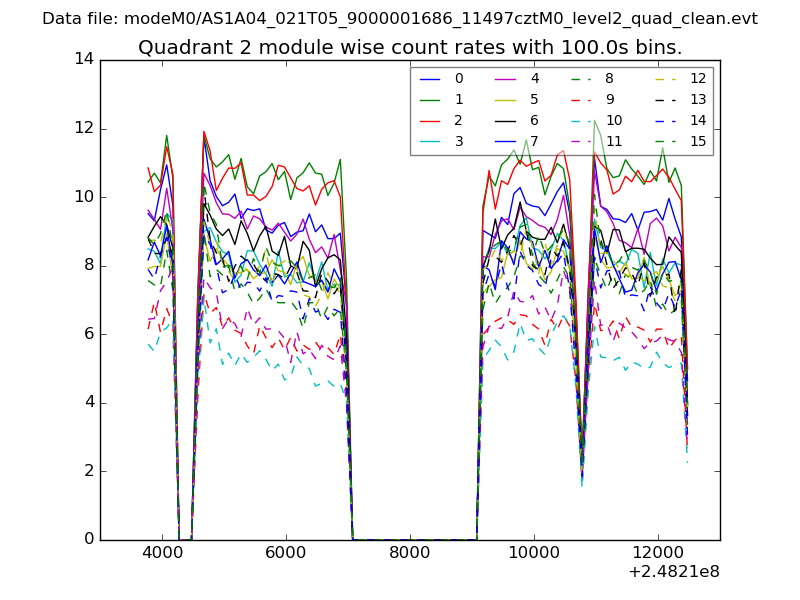
| Module-wise count rates for Quadrant B Data is divided into 100 sec bins |
 |
 |
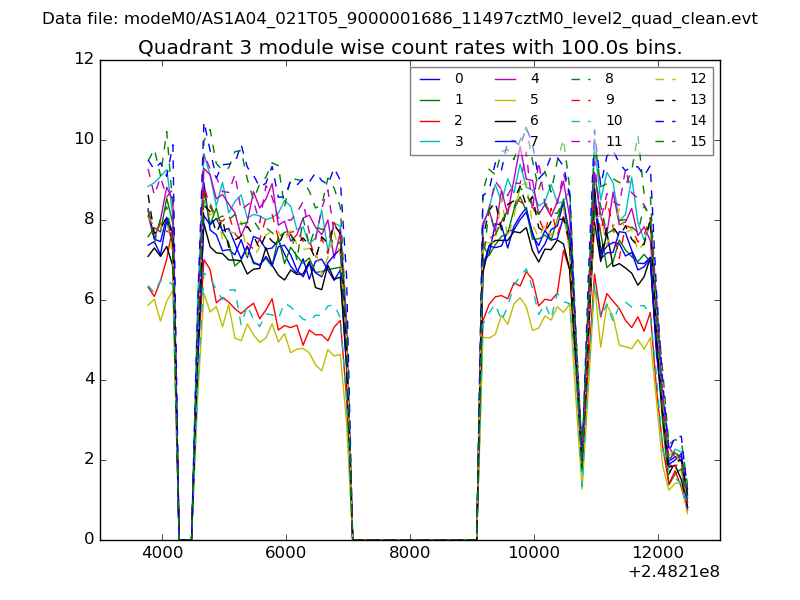
| Module-wise count rates for Quadrant C Data is divided into 100 sec bins |
 |
 |
| Module-wise count rates for Quadrant D Data is divided into 100 sec bins |
 |
 |
| Parameter | Plot |
|---|---|
| CZT HV Monitor |  |
| D_VDD | 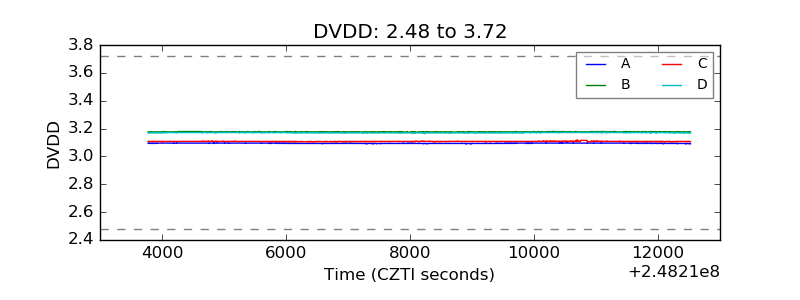 |
| Temperature 1 | 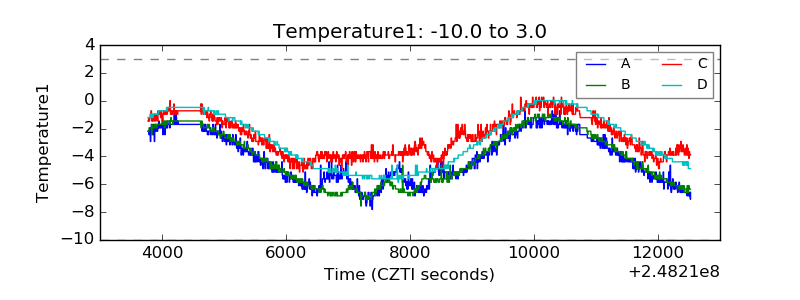 |
| Veto HV Monitor | 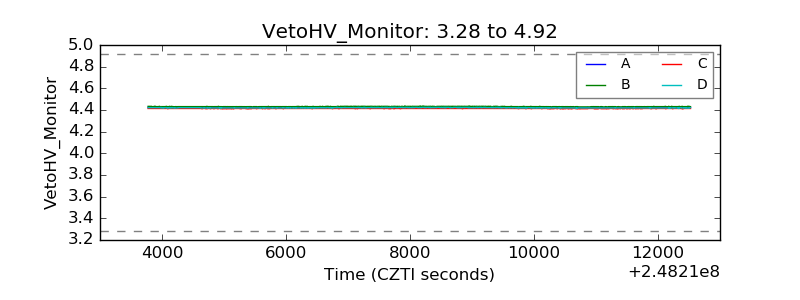 |
| Veto LLD | 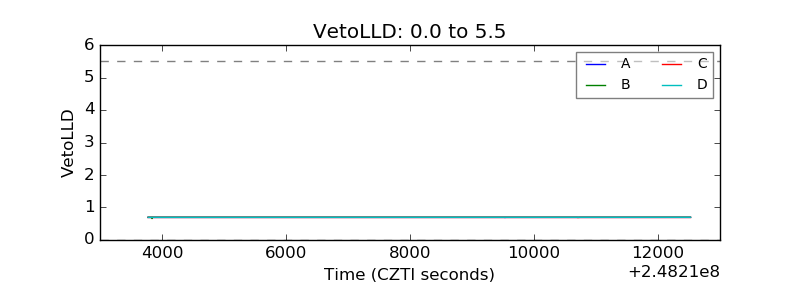 |
| Alpha Counter | 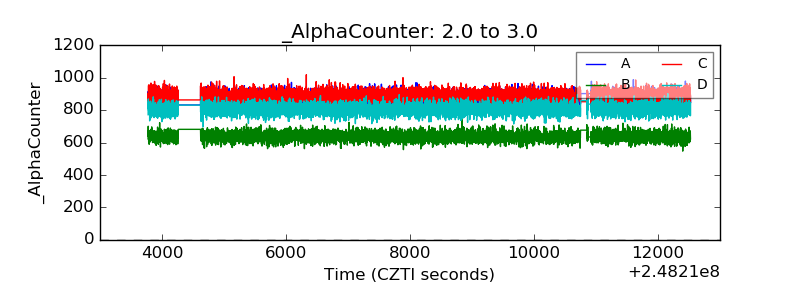 |
| _CPM_Rate | 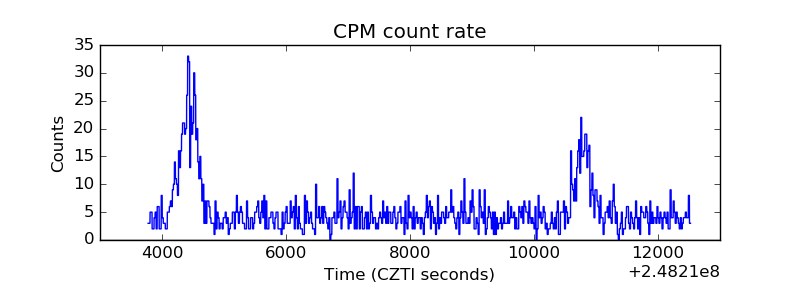 |
| CZT Counter | 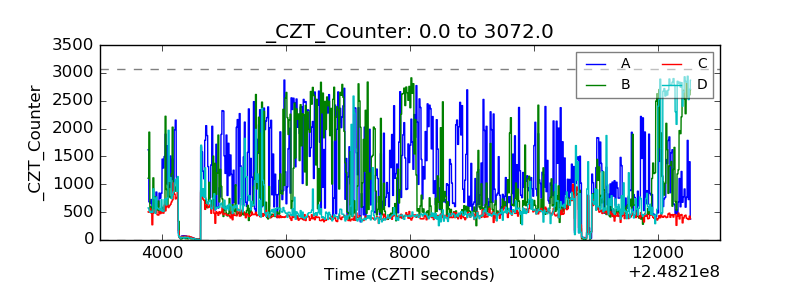 |
| +2.5 Volts monitor |  |
| +5 Volts monitor |  |
| _ROLL_ROT | 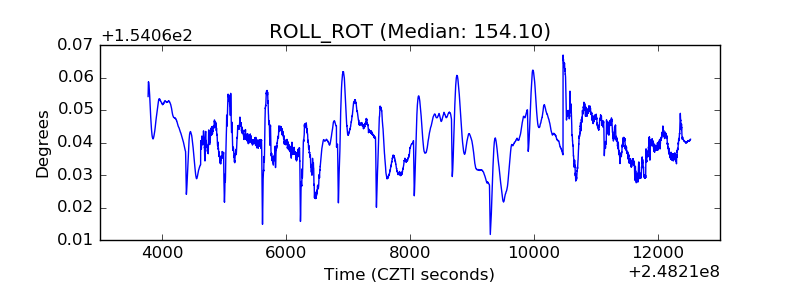 |
| _Roll_DEC | 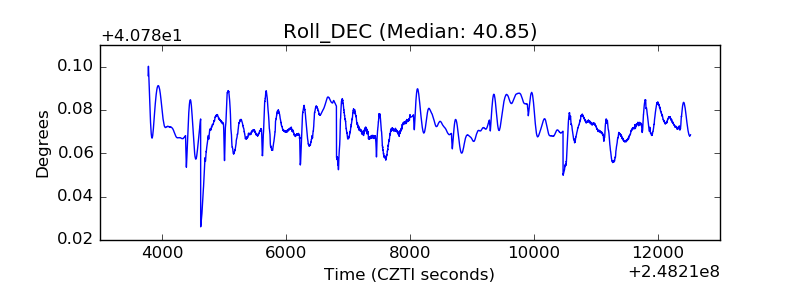 |
| _Roll_RA | 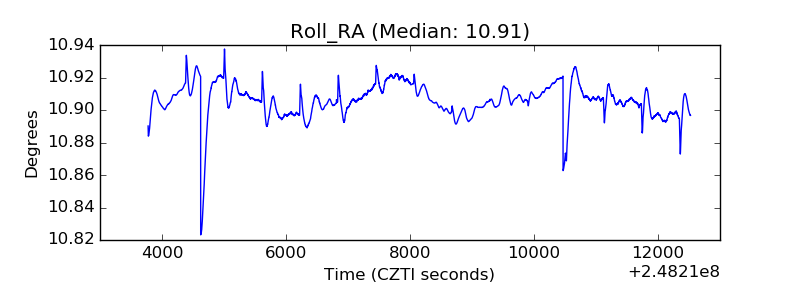 |
| Veto Counter |  |