| Param | Original file | Final file |
|---|---|---|
| Filename | modeM0/AS1A04_021T05_9000001686_11498cztM0_level2.evt | modeM0/AS1A04_021T05_9000001686_11498cztM0_level2_quad_clean.evt |
| Size (bytes) | 920,839,680 | 99,812,160 |
| Size | 878.2 MB | 95.2 MB |
| Events in quadrant A | 7,672,940 | 609,841 |
| Events in quadrant B | 9,458,309 | 582,656 |
| Events in quadrant C | 3,433,277 | 697,852 |
| Events in quadrant D | 6,807,337 | 598,664 |
| Mode M9 | |||
|---|---|---|---|
| Quadrant | BADHDUFLAG | Total packets | Discarded packets |
| A | 0 | 5 | 0 |
| B | 0 | 5 | 0 |
| C | 0 | 5 | 0 |
| D | 0 | 5 | 0 |
| Mode SS | |||
|---|---|---|---|
| Quadrant | BADHDUFLAG | Total packets | Discarded packets |
| A | 0 | 158 | 0 |
| B | 0 | 158 | 0 |
| C | 0 | 158 | 0 |
| D | 0 | 158 | 0 |
| Mode M0 | |||
|---|---|---|---|
| Quadrant | BADHDUFLAG | Total packets | Discarded packets |
| A | 0 | 28166 | 4 |
| B | 0 | 33286 | 3 |
| C | 0 | 15685 | 3 |
| D | 0 | 25480 | 3 |
| Quadrant | Total seconds | Saturated seconds | Saturation percentage |
|---|---|---|---|
| A | 7660 | 941 | 12.284595% |
| B | 7660 | 2021 | 26.383812% |
| C | 7660 | 39 | 0.509138% |
| D | 7660 | 1067 | 13.929504% |
Noise dominated data is calculated using 1-second bins in cleaned event files. If a bin has >2000 counts, and if more than 50% of those come from <1% of pixels, then it is considered to be noise-dominated and hence unusable.
| Quadrant | # 1 sec bins | Bins with >0 counts | Bins with >2000 counts | High rate bins dominated by noise | Noise dominated (total time) | Noise dominated (detector-on time) | Marked lightcurve |
|---|---|---|---|---|---|---|---|
| A | 8156 | 7665 | 578 | 578 | 7.09% | 7.54% | 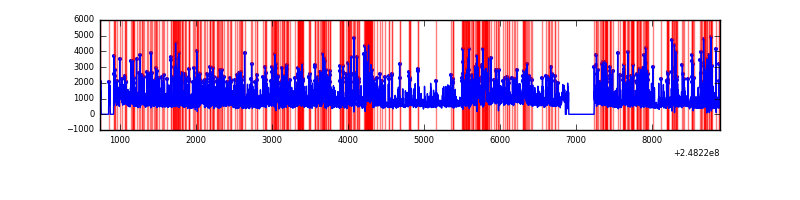 |
| B | 8156 | 7665 | 1667 | 1667 | 20.44% | 21.75% | 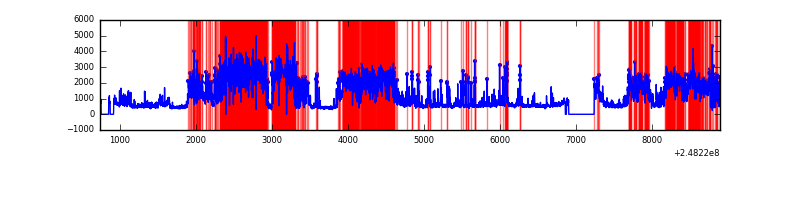 |
| C | 8156 | 7665 | 1 | 1 | 0.01% | 0.01% | 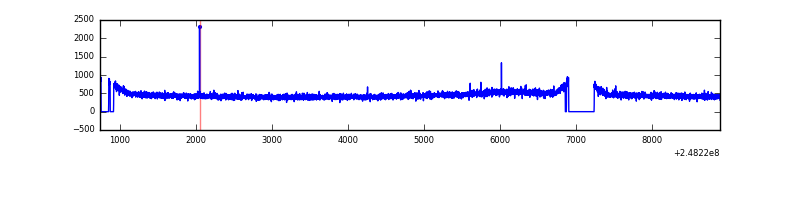 |
| D | 8156 | 7665 | 1000 | 1000 | 12.26% | 13.05% | 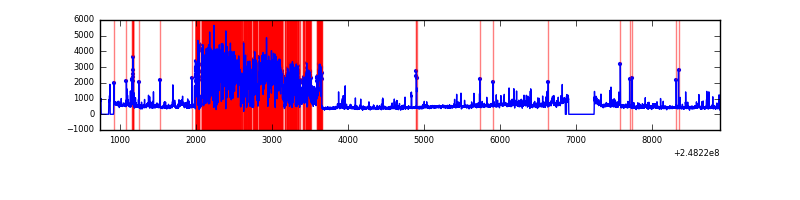 |
Top three noisy pixels from each quadrant. If the there are fewer than three noisy pixels in the level2.evt file, extra rows are filled as -1
| Pixel properties | Quadrant properties | ||||||
|---|---|---|---|---|---|---|---|
| Quadrant | DetID | PixID | Counts | Sigma | Mean | Median | Sigma |
| A | 8 | 5 | 4094016 | 23723.39 | 843 | 824 | 172.5 |
| A | 15 | 223 | 116998 | 673.32 | 843 | 824 | 172.5 |
| A | 15 | 239 | 55653 | 317.78 | 843 | 824 | 172.5 |
| B | 4 | 81 | 5209371 | 34516.23 | 791 | 771 | 150.9 |
| B | 4 | 239 | 770741 | 5102.42 | 791 | 771 | 150.9 |
| B | 11 | 51 | 198117 | 1307.77 | 791 | 771 | 150.9 |
| C | 13 | 61 | 6311 | 26.48 | 880 | 886 | 204.8 |
| C | 12 | 4 | 3761 | 14.03 | 880 | 886 | 204.8 |
| C | 3 | 202 | 2121 | 6.03 | 880 | 886 | 204.8 |
| D | 1 | 52 | 3107317 | 15600.8 | 817 | 792 | 199.1 |
| D | 2 | 120 | 245849 | 1230.66 | 817 | 792 | 199.1 |
| D | 8 | 195 | 173139 | 865.52 | 817 | 792 | 199.1 |
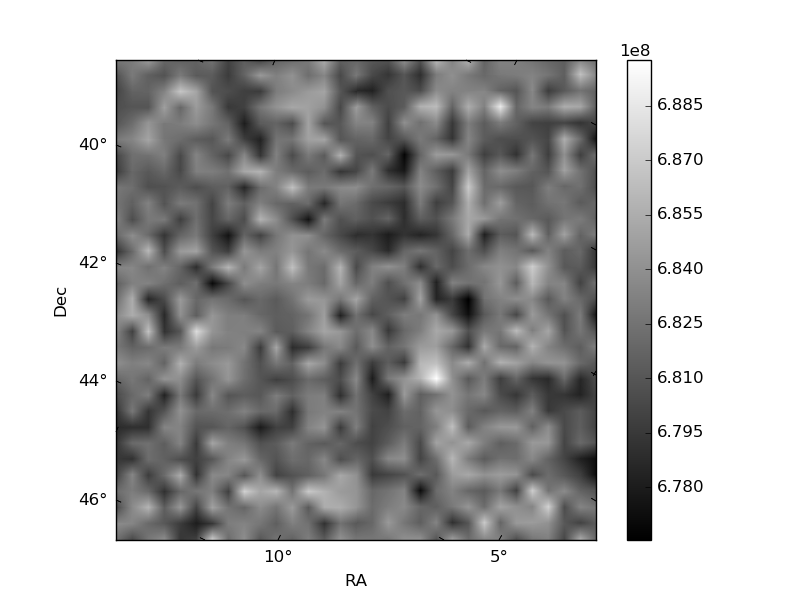
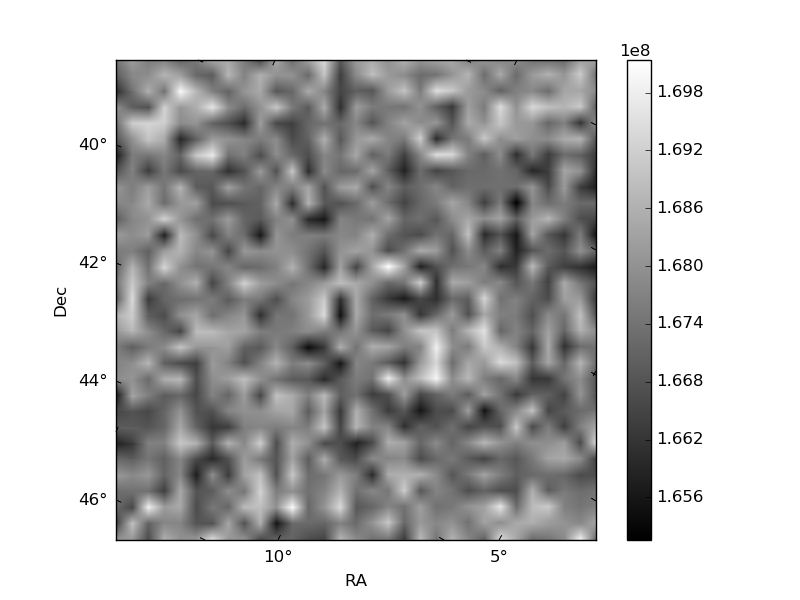
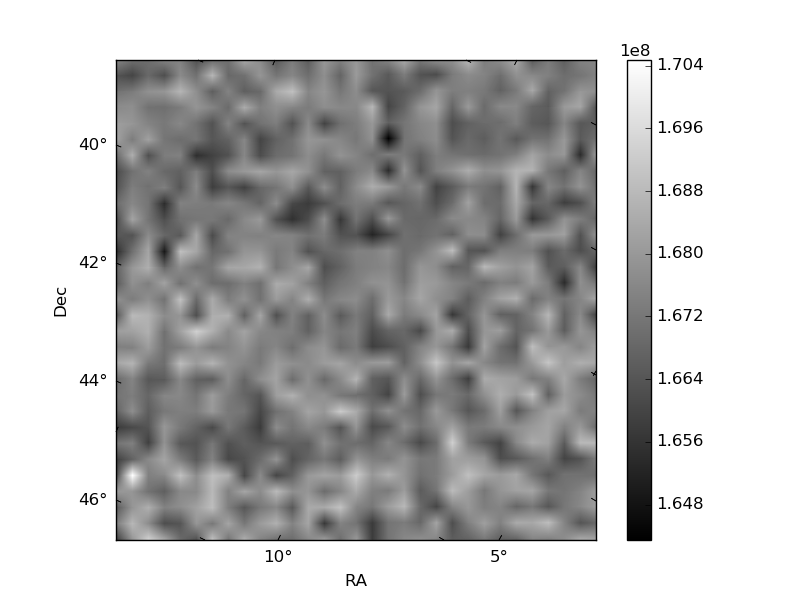
Histogram calculated using DETX and DETY for each event in the final _common_clean file
| Quadrant A | 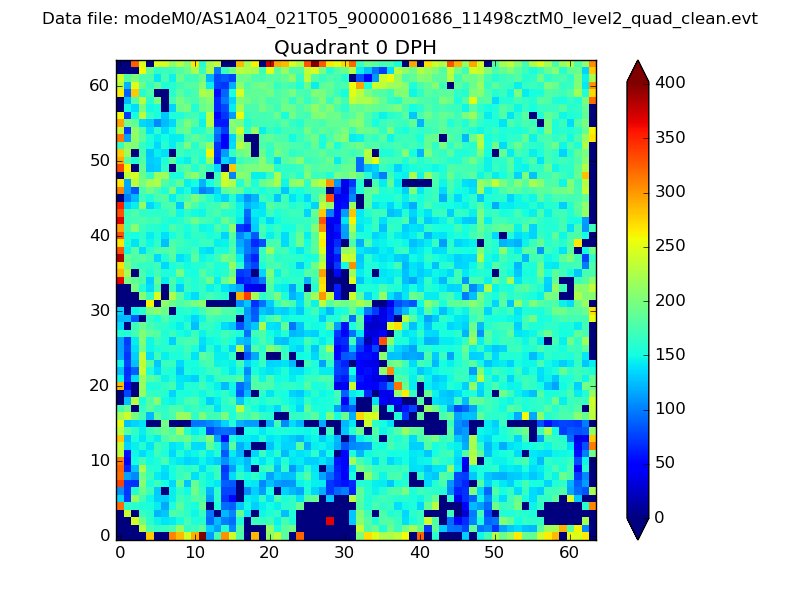 |
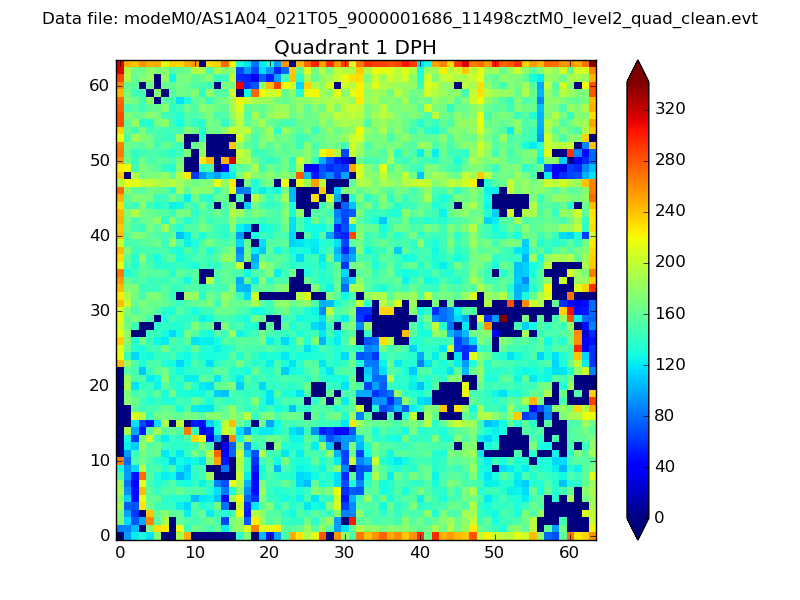 |
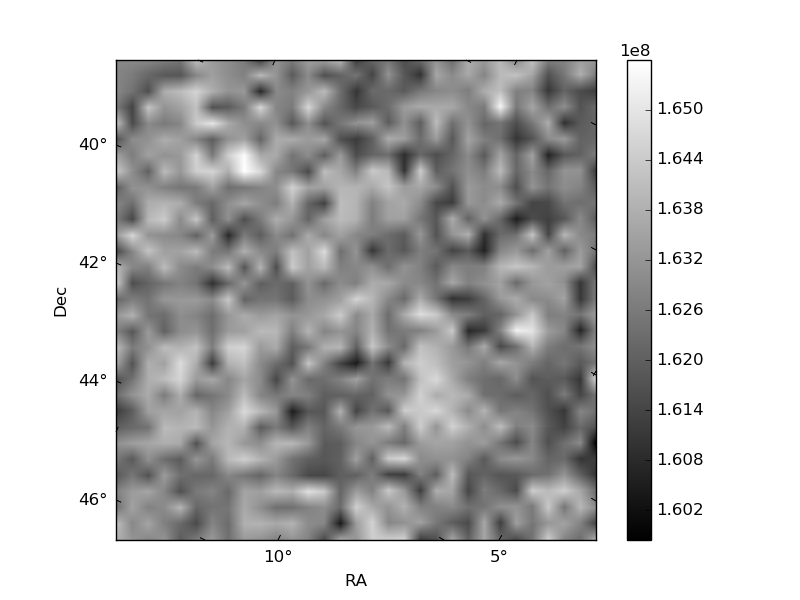
Quadrant B |
|---|---|---|---|
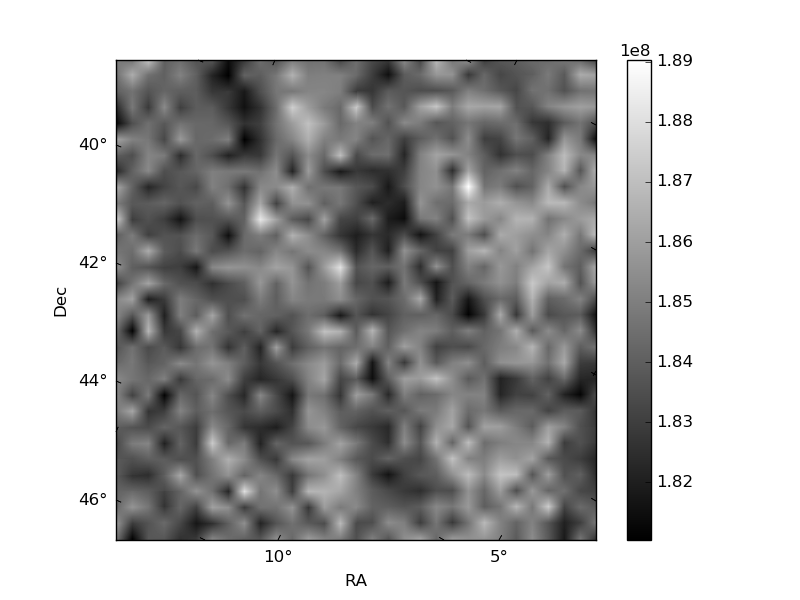
| Quadrant D | 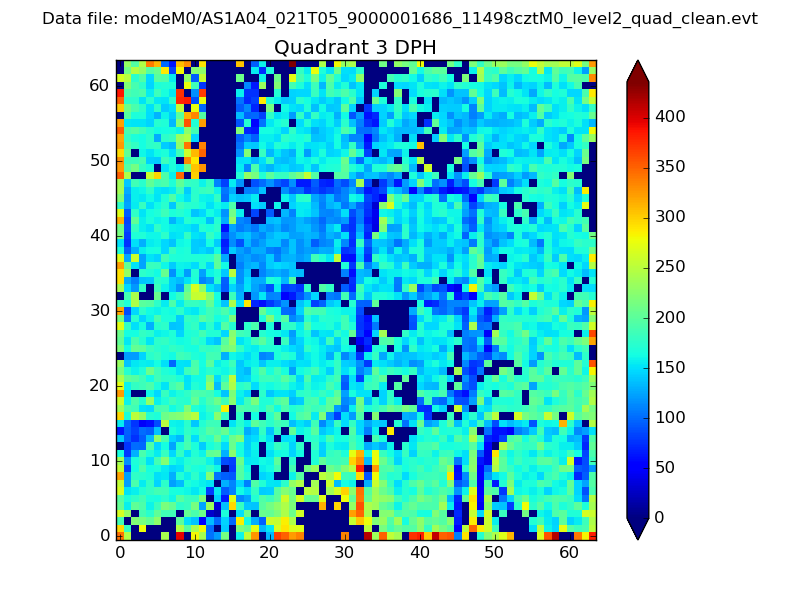 |
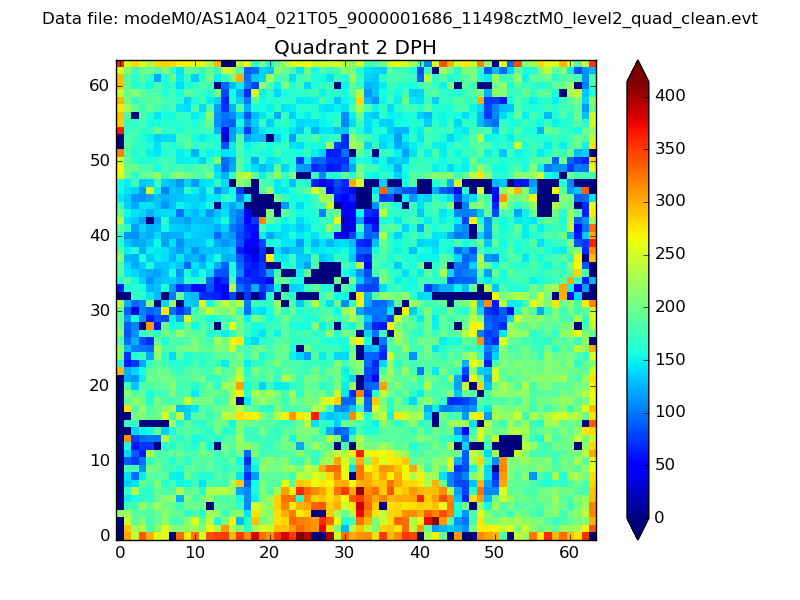 |
Quadrant C |
| Plot type | Count rate plots | Images |
|---|---|---|
| Comparison with Poisson distribution Blue bars denote a histogram of data divided into 1 sec bins. Red curve is a Poisson curve with rate = median count rate of data. |
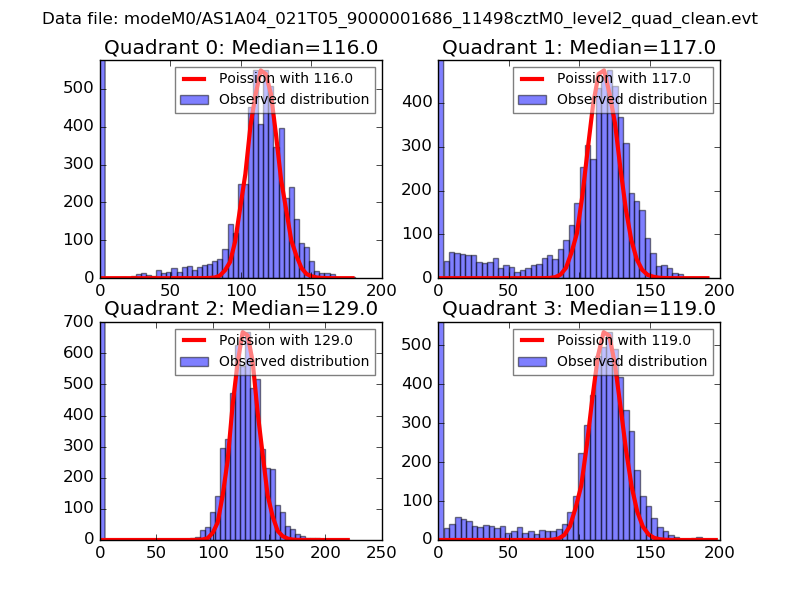 |
 |
| Quadrant-wise count rates Data is divided into 100 sec bins |
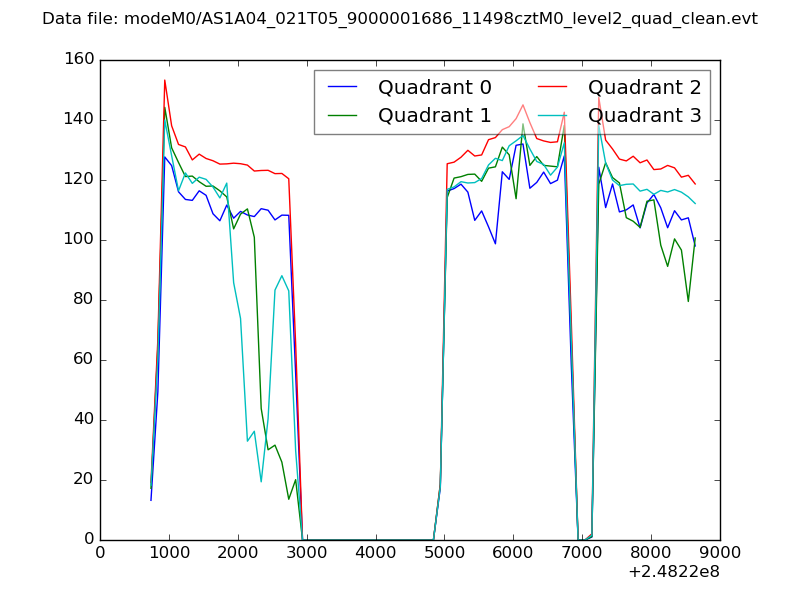 |
|
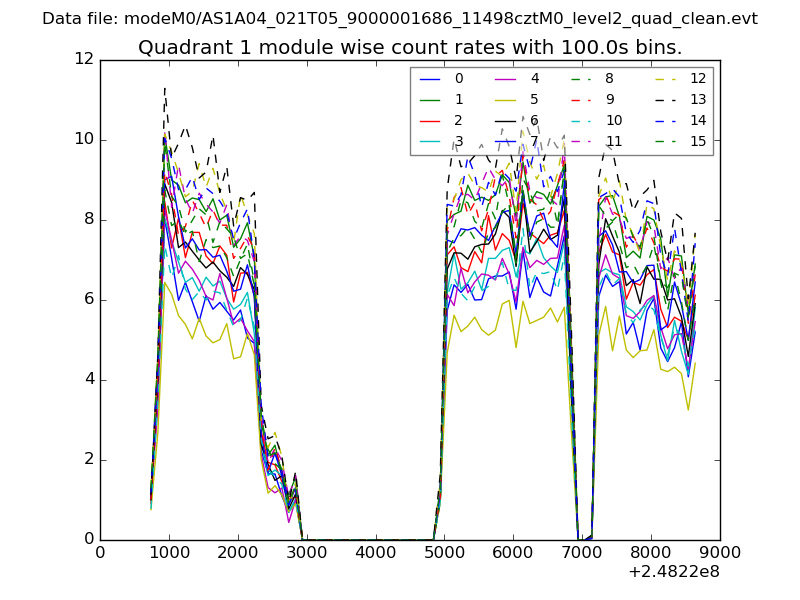
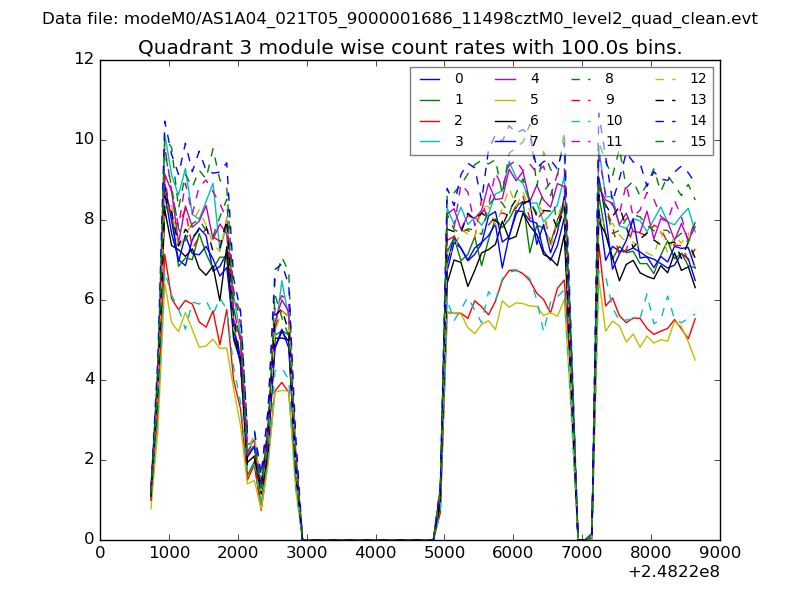
| Module-wise count rates for Quadrant A Data is divided into 100 sec bins |
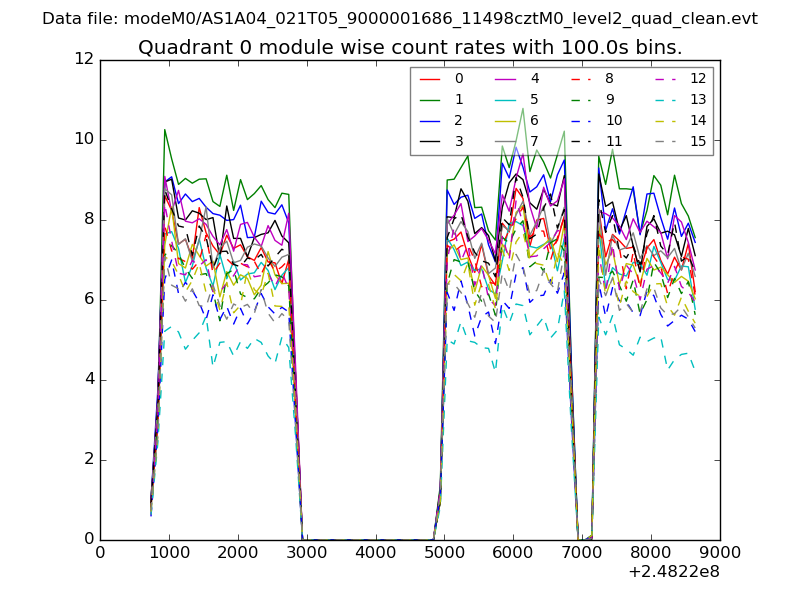 |
 |
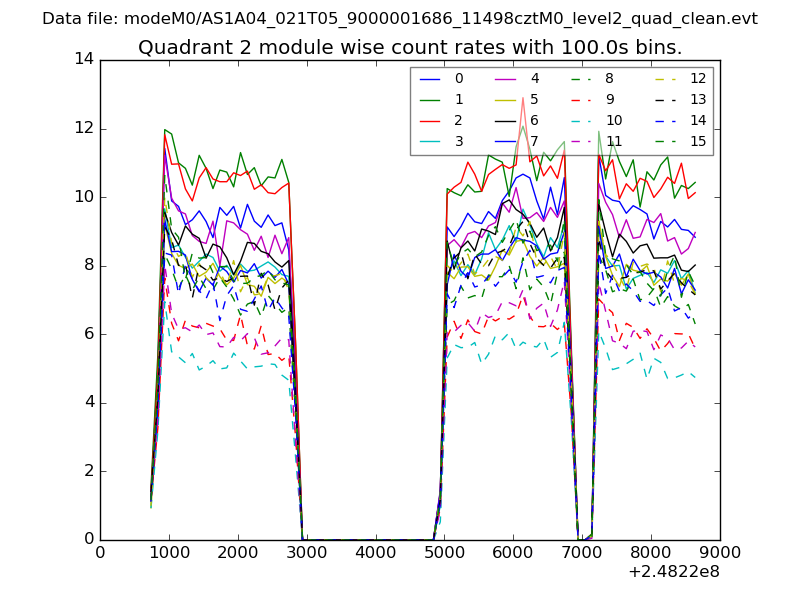
| Module-wise count rates for Quadrant B Data is divided into 100 sec bins |
 |
 |
| Module-wise count rates for Quadrant C Data is divided into 100 sec bins |
 |
 |
| Module-wise count rates for Quadrant D Data is divided into 100 sec bins |
 |
 |
| Parameter | Plot |
|---|---|
| CZT HV Monitor | 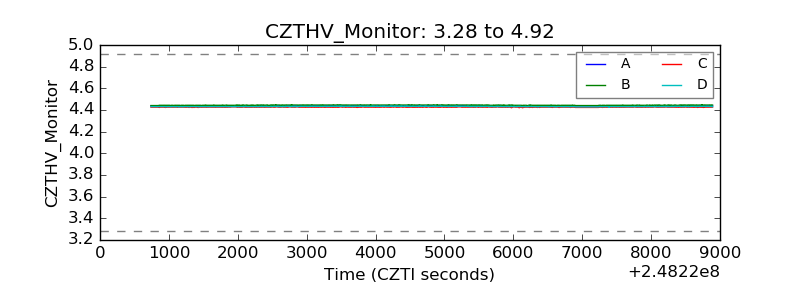 |
| D_VDD | 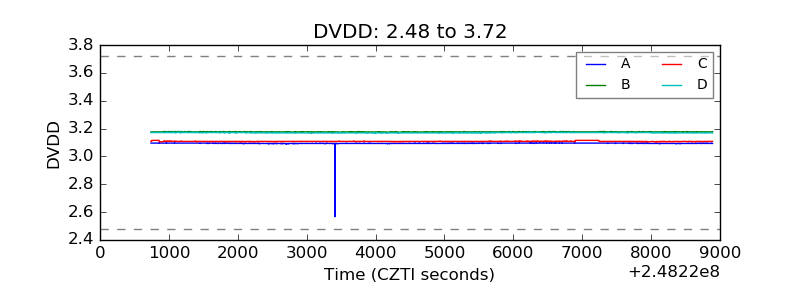 |
| Temperature 1 | 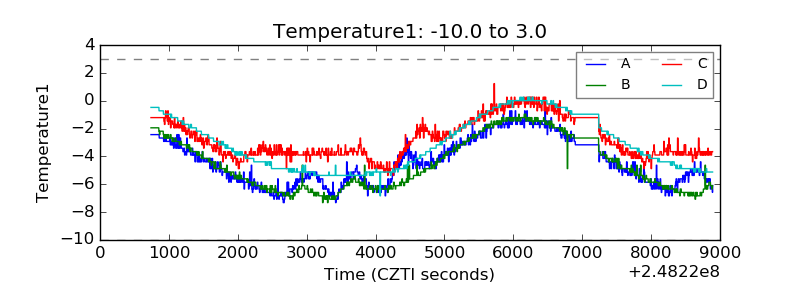 |
| Veto HV Monitor | 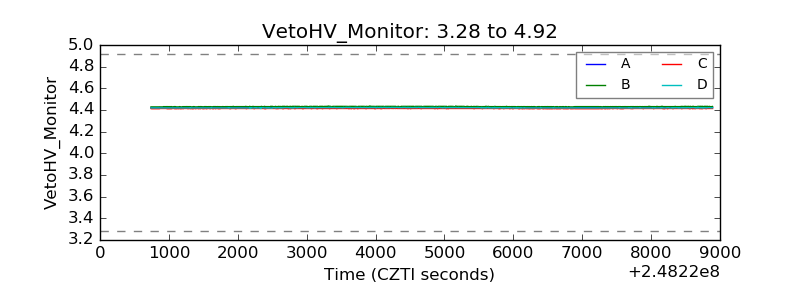 |
| Veto LLD | 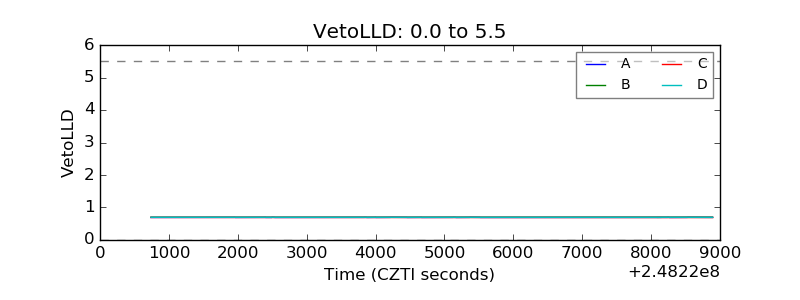 |
| Alpha Counter | 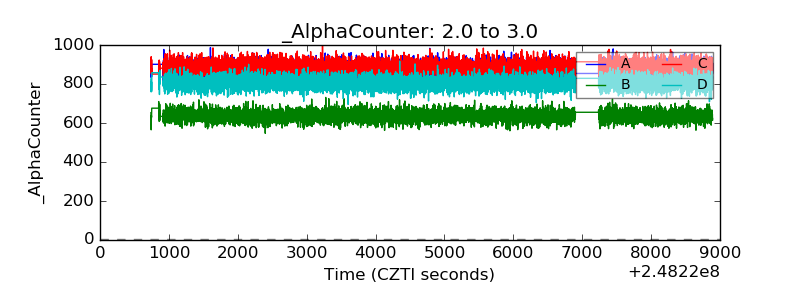 |
| _CPM_Rate | 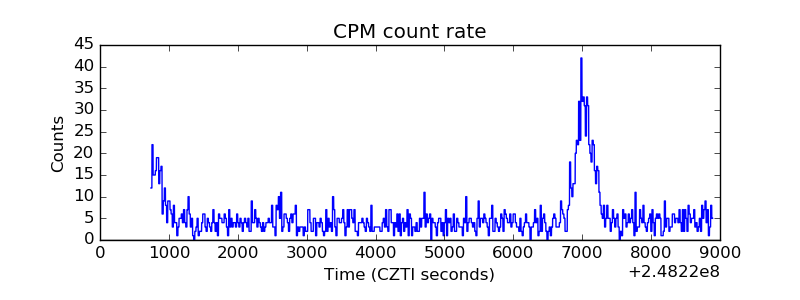 |
| CZT Counter | 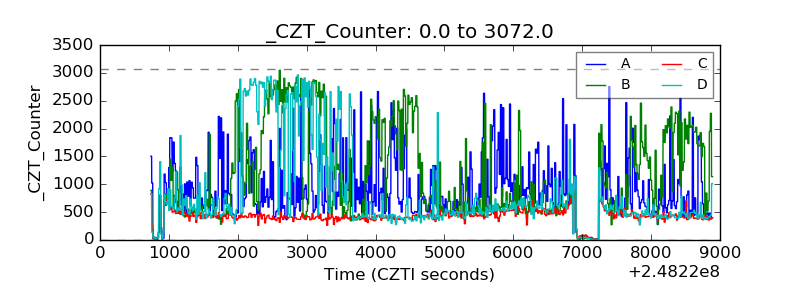 |
| +2.5 Volts monitor |  |
| +5 Volts monitor |  |
| _ROLL_ROT | 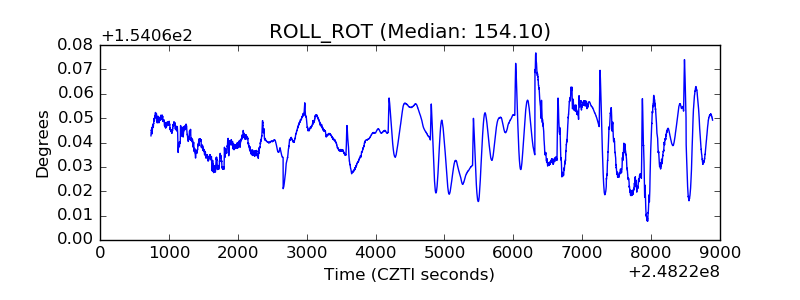 |
| _Roll_DEC | 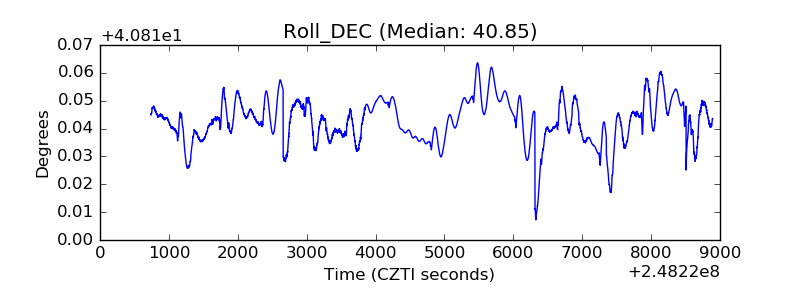 |
| _Roll_RA | 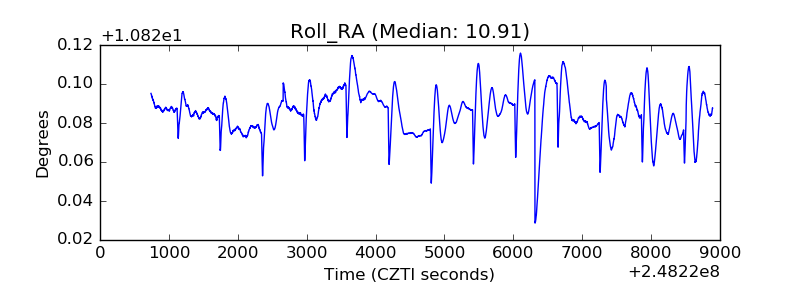 |
| Veto Counter | 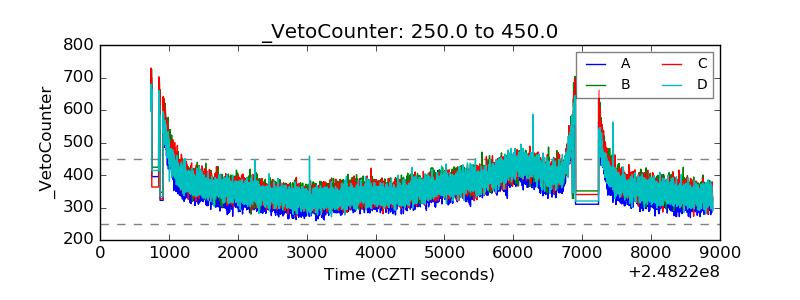 |