| Param | Original file | Final file |
|---|---|---|
| Filename | modeM0/AS1A04_021T05_9000001686_11500cztM0_level2.evt | modeM0/AS1A04_021T05_9000001686_11500cztM0_level2_quad_clean.evt |
| Size (bytes) | 1,345,360,320 | 159,289,920 |
| Size | 1.3 GB | 151.9 MB |
| Events in quadrant A | 14,381,953 | 873,756 |
| Events in quadrant B | 12,164,337 | 957,933 |
| Events in quadrant C | 6,016,231 | 1,068,986 |
| Events in quadrant D | 7,277,669 | 995,239 |
| Mode M9 | |||
|---|---|---|---|
| Quadrant | BADHDUFLAG | Total packets | Discarded packets |
| A | 0 | 15 | 0 |
| B | 0 | 15 | 0 |
| C | 0 | 15 | 0 |
| D | 0 | 15 | 0 |
| Mode SS | |||
|---|---|---|---|
| Quadrant | BADHDUFLAG | Total packets | Discarded packets |
| A | 0 | 276 | 0 |
| B | 0 | 276 | 0 |
| C | 0 | 276 | 0 |
| D | 0 | 276 | 0 |
| Mode M0 | |||
|---|---|---|---|
| Quadrant | BADHDUFLAG | Total packets | Discarded packets |
| A | 0 | 51916 | 5 |
| B | 0 | 45109 | 4 |
| C | 0 | 27276 | 4 |
| D | 0 | 30826 | 4 |
| Quadrant | Total seconds | Saturated seconds | Saturation percentage |
|---|---|---|---|
| A | 13411 | 2625 | 19.573484% |
| B | 13411 | 1566 | 11.676982% |
| C | 13411 | 50 | 0.372828% |
| D | 13411 | 172 | 1.282529% |
Noise dominated data is calculated using 1-second bins in cleaned event files. If a bin has >2000 counts, and if more than 50% of those come from <1% of pixels, then it is considered to be noise-dominated and hence unusable.
| Quadrant | # 1 sec bins | Bins with >0 counts | Bins with >2000 counts | High rate bins dominated by noise | Noise dominated (total time) | Noise dominated (detector-on time) | Marked lightcurve |
|---|---|---|---|---|---|---|---|
| A | 15007 | 13416 | 1782 | 1782 | 11.87% | 13.28% | 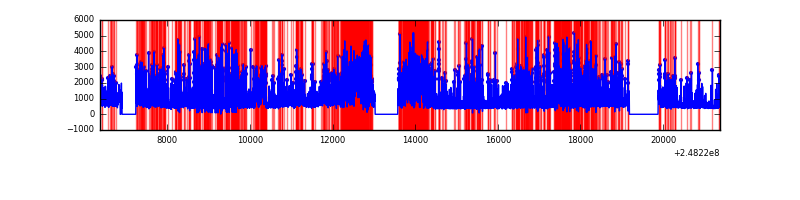 |
| B | 15007 | 13416 | 1077 | 1077 | 7.18% | 8.03% | 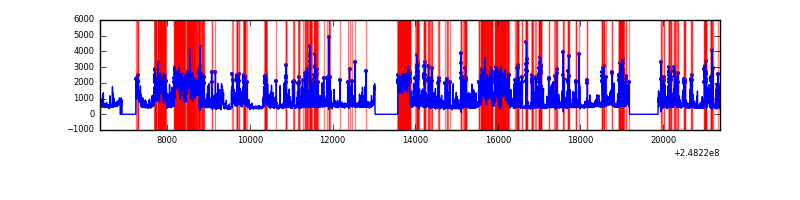 |
| C | 15007 | 13416 | 0 | 0 | 0.00% | 0.00% | 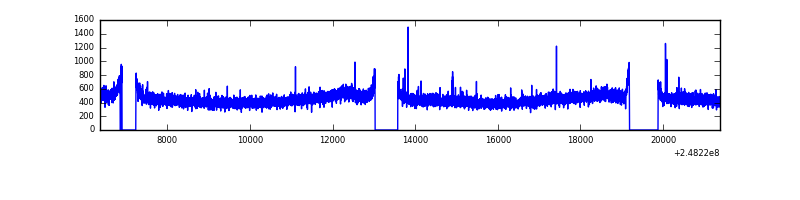 |
| D | 15007 | 13415 | 98 | 98 | 0.65% | 0.73% | 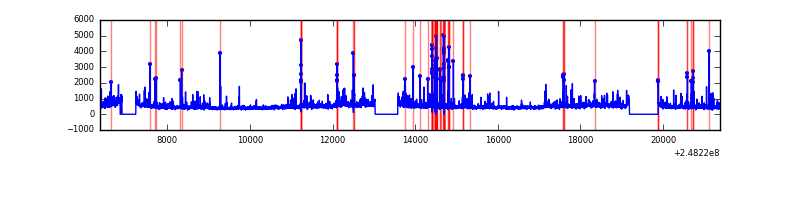 |
Top three noisy pixels from each quadrant. If the there are fewer than three noisy pixels in the level2.evt file, extra rows are filled as -1
| Pixel properties | Quadrant properties | ||||||
|---|---|---|---|---|---|---|---|
| Quadrant | DetID | PixID | Counts | Sigma | Mean | Median | Sigma |
| A | 8 | 5 | 8597834 | 29602.29 | 1418 | 1389 | 290.4 |
| A | 1 | 162 | 71708 | 242.15 | 1418 | 1389 | 290.4 |
| A | 9 | 143 | 56427 | 189.53 | 1418 | 1389 | 290.4 |
| B | 4 | 81 | 3124915 | 10974.98 | 1499 | 1457 | 284.6 |
| B | 4 | 239 | 1633755 | 5735.45 | 1499 | 1457 | 284.6 |
| B | 3 | 64 | 1112738 | 3904.74 | 1499 | 1457 | 284.6 |
| C | 12 | 4 | 25691 | 68.0 | 1537 | 1549 | 355.0 |
| C | 13 | 61 | 11102 | 26.91 | 1537 | 1549 | 355.0 |
| C | 3 | 202 | 3633 | 5.87 | 1537 | 1549 | 355.0 |
| D | 2 | 120 | 383887 | 1054.98 | 1516 | 1474 | 362.5 |
| D | 8 | 195 | 300312 | 824.42 | 1516 | 1474 | 362.5 |
| D | 10 | 253 | 168773 | 461.54 | 1516 | 1474 | 362.5 |
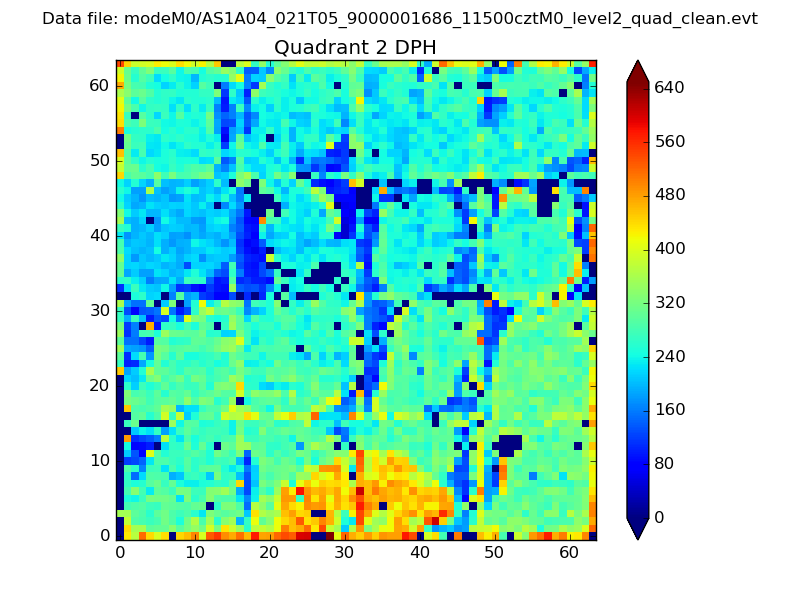
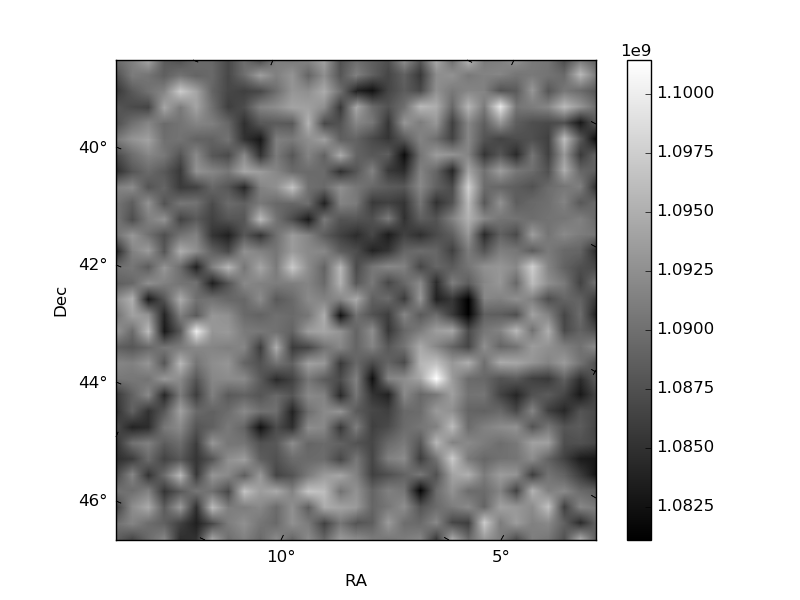
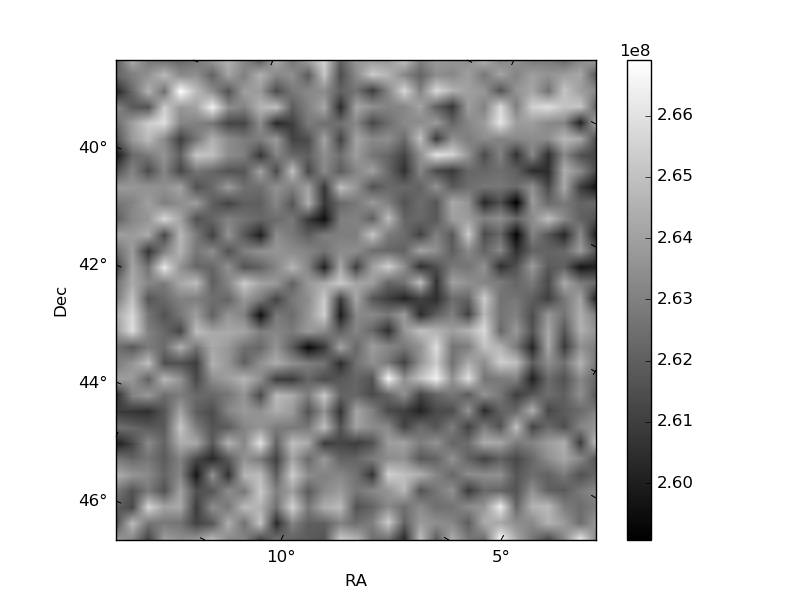
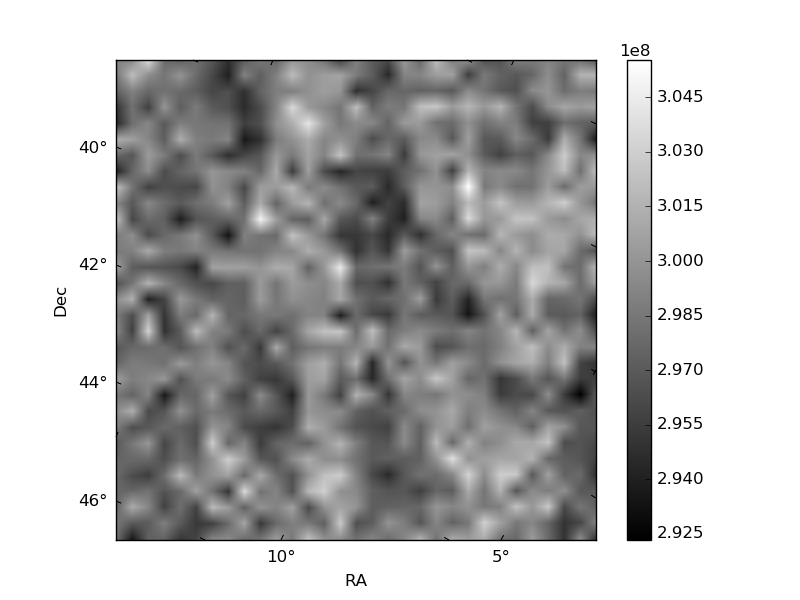
Histogram calculated using DETX and DETY for each event in the final _common_clean file
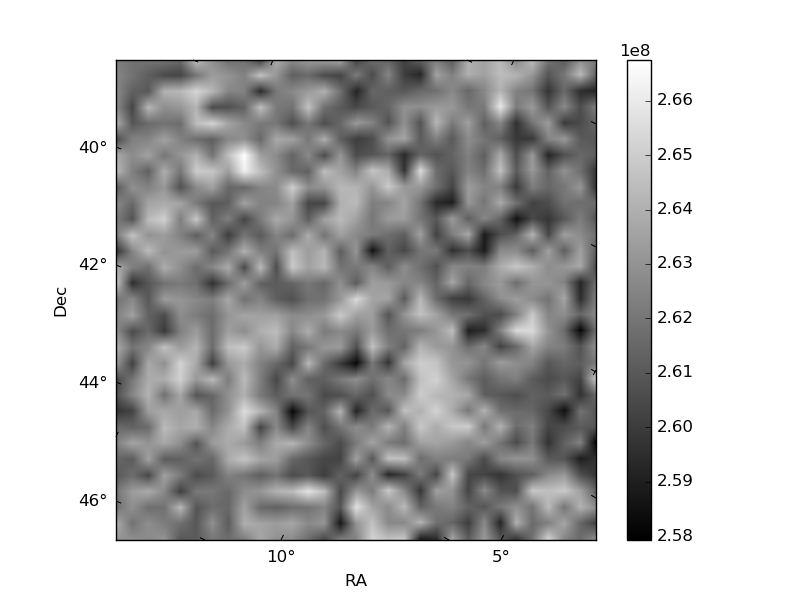
| Quadrant A | 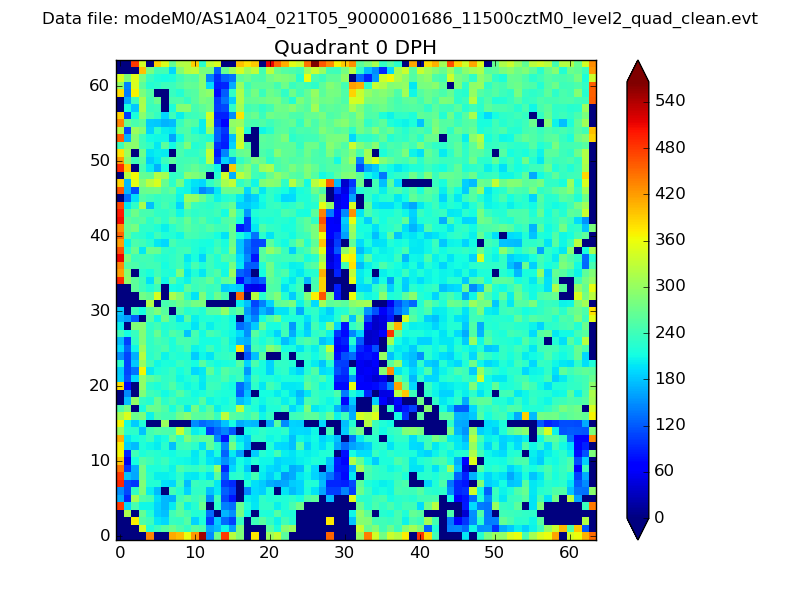 |
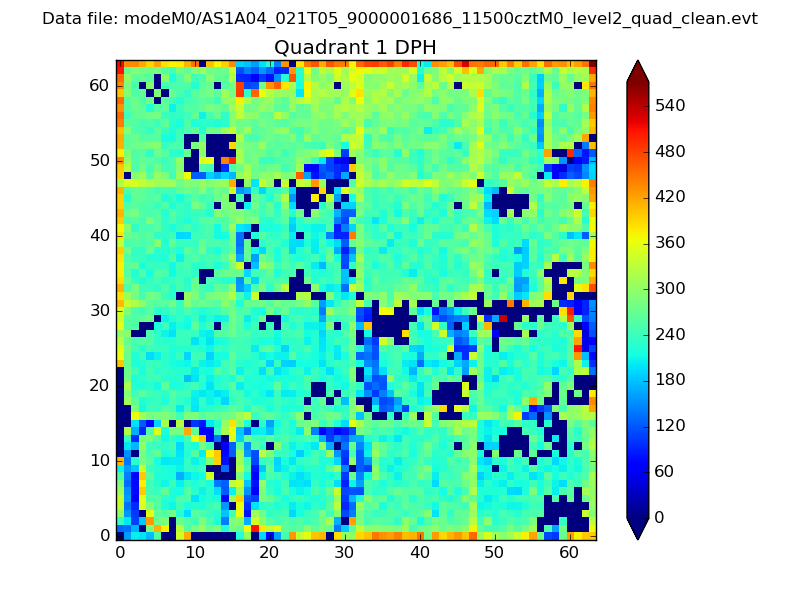 |
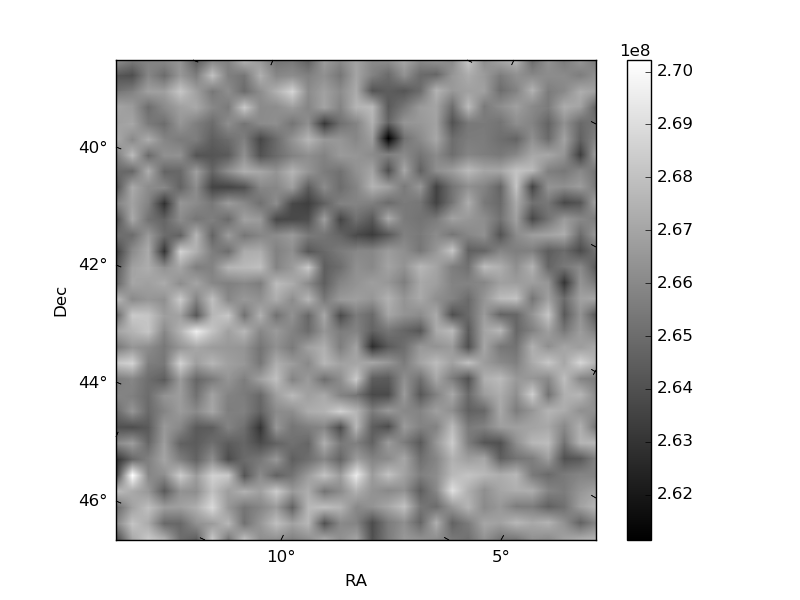
Quadrant B |
|---|---|---|---|
| Quadrant D | 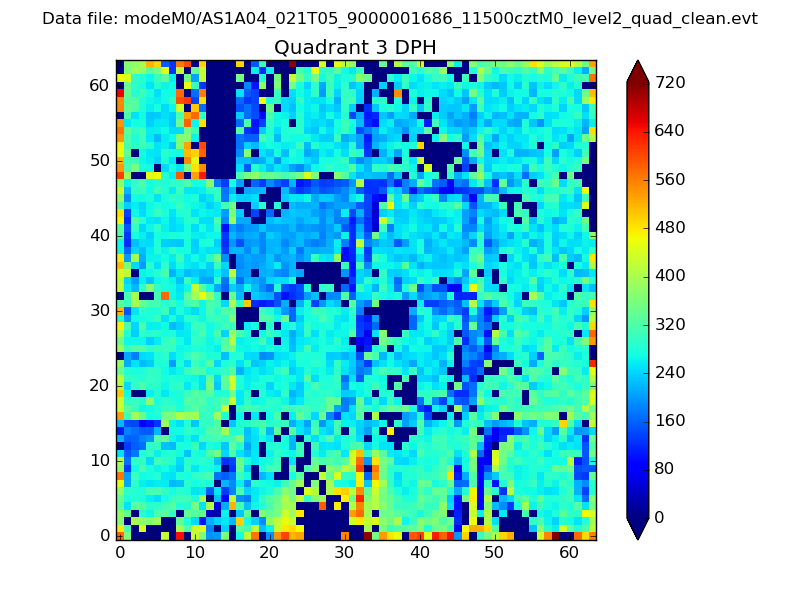 |
 |
Quadrant C |
| Plot type | Count rate plots | Images |
|---|---|---|
| Comparison with Poisson distribution Blue bars denote a histogram of data divided into 1 sec bins. Red curve is a Poisson curve with rate = median count rate of data. |
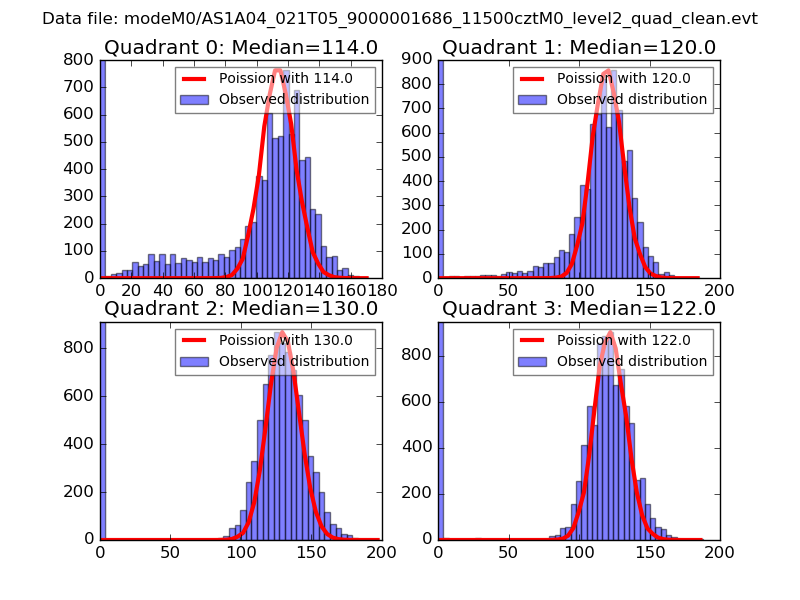 |
 |
| Quadrant-wise count rates Data is divided into 100 sec bins |
 |
|
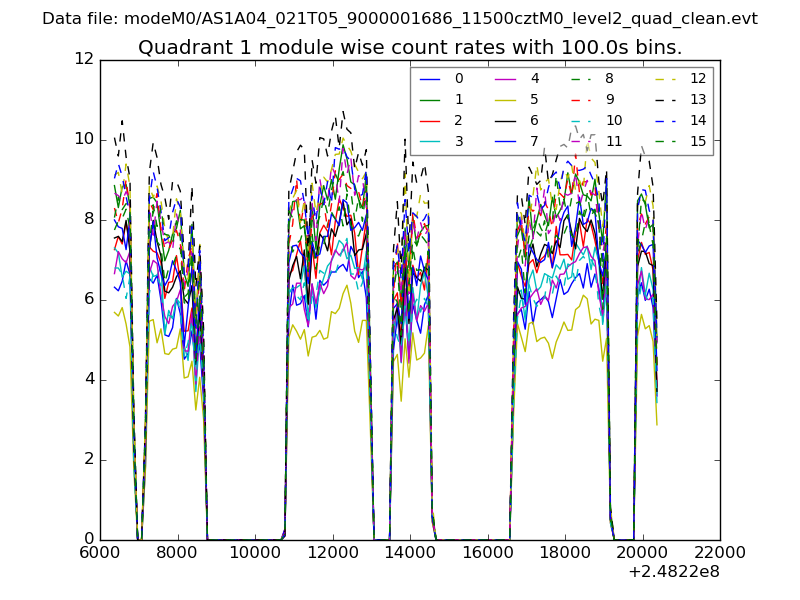
| Module-wise count rates for Quadrant A Data is divided into 100 sec bins |
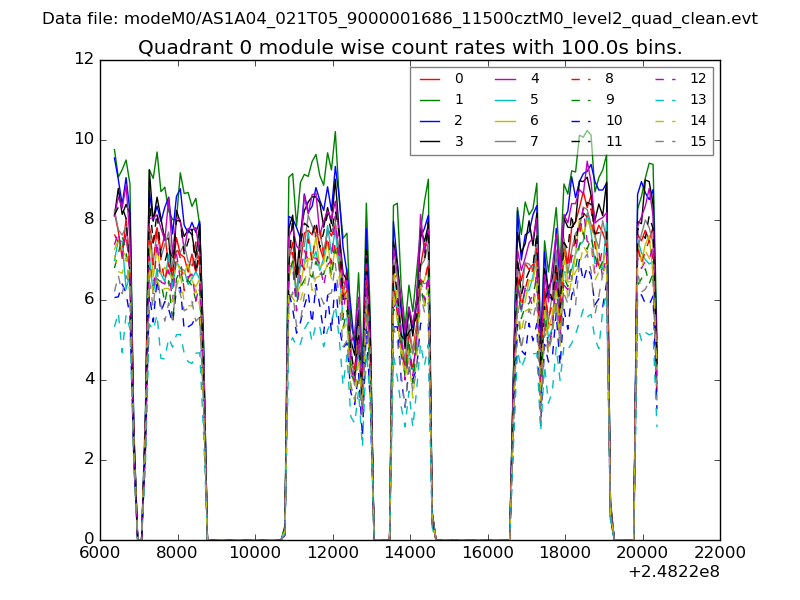 |
 |
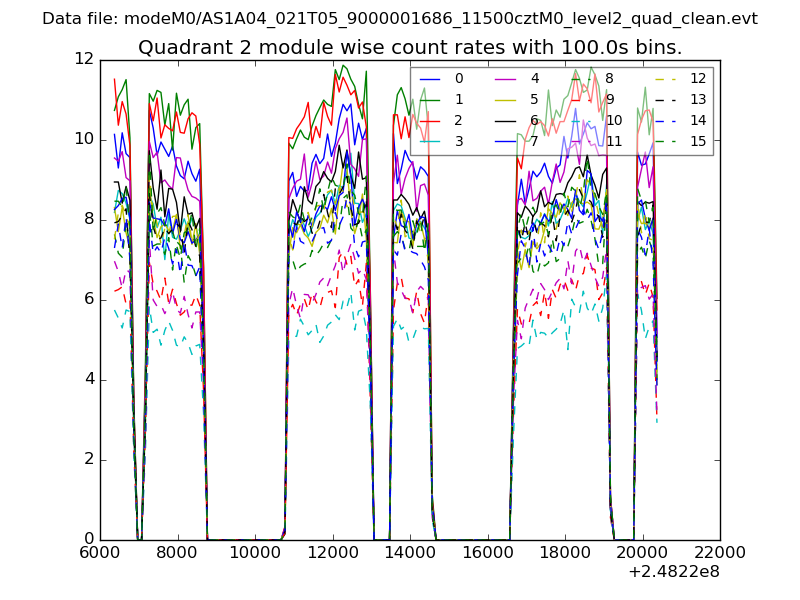
| Module-wise count rates for Quadrant B Data is divided into 100 sec bins |
 |
 |
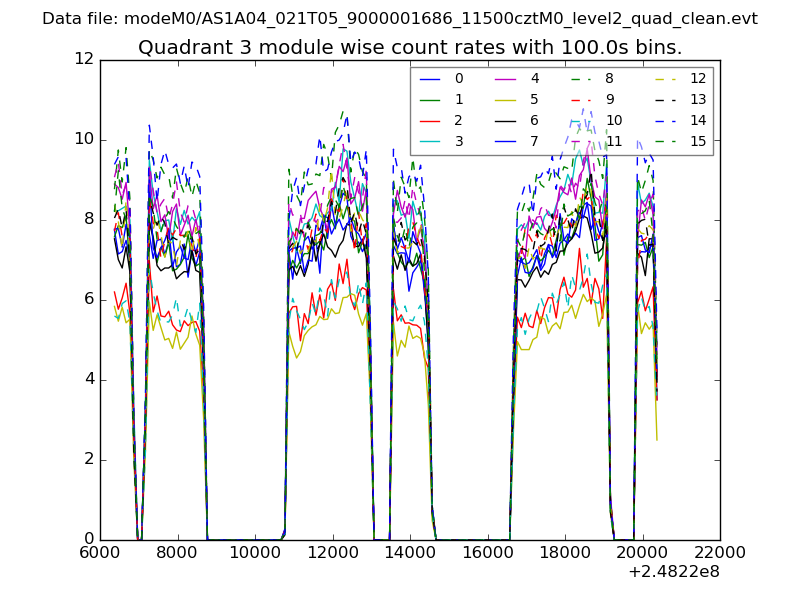
| Module-wise count rates for Quadrant C Data is divided into 100 sec bins |
 |
 |
| Module-wise count rates for Quadrant D Data is divided into 100 sec bins |
 |
 |
| Parameter | Plot |
|---|---|
| CZT HV Monitor | 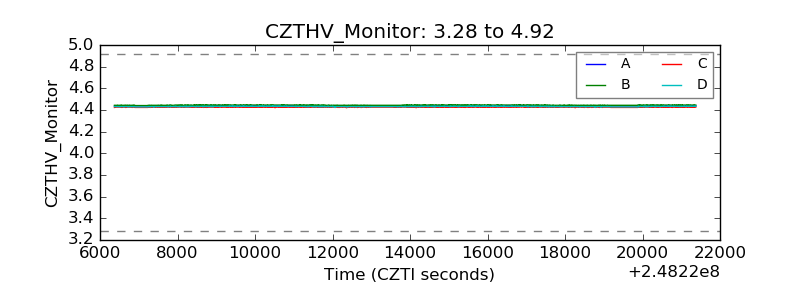 |
| D_VDD | 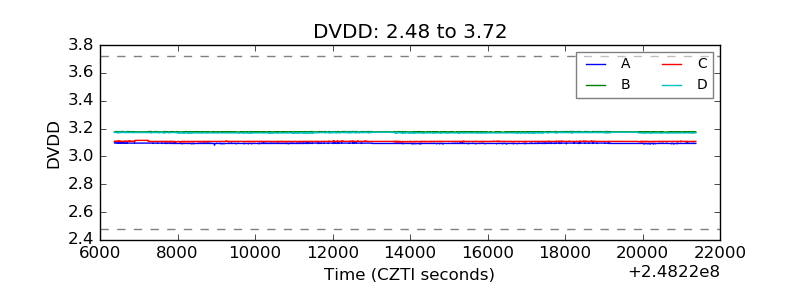 |
| Temperature 1 | 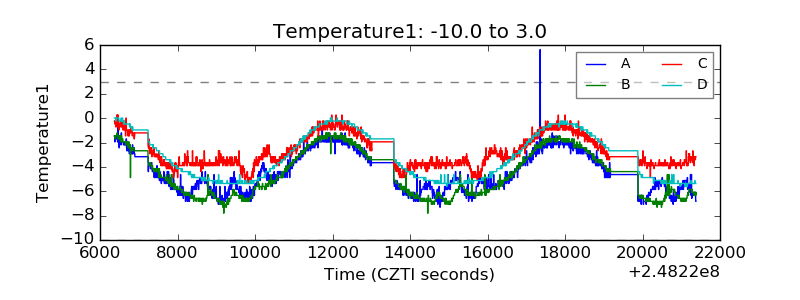 |
| Veto HV Monitor | 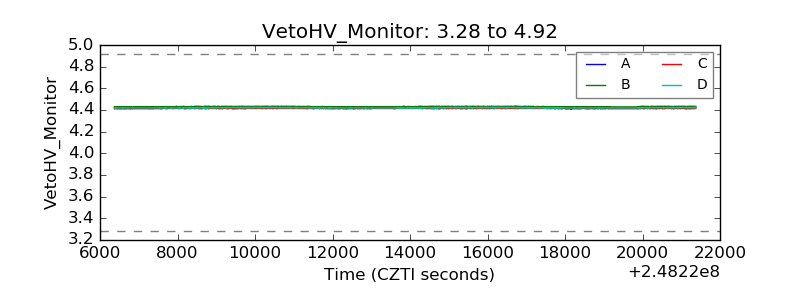 |
| Veto LLD | 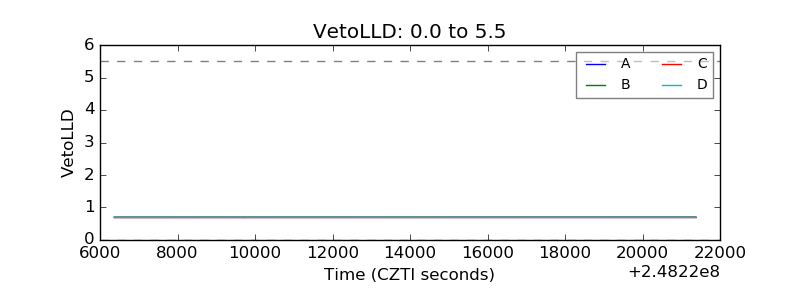 |
| Alpha Counter | 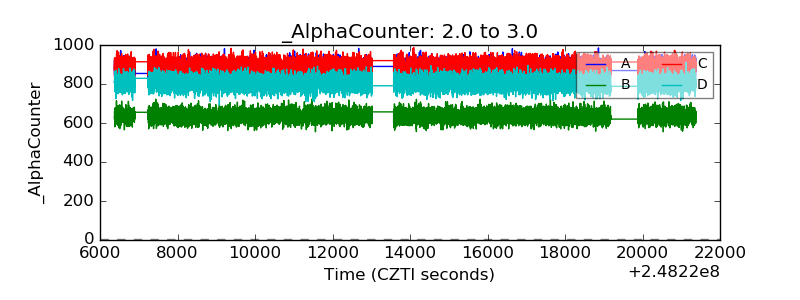 |
| _CPM_Rate | 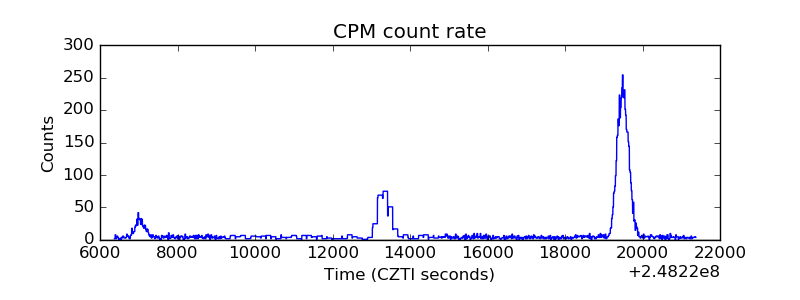 |
| CZT Counter | 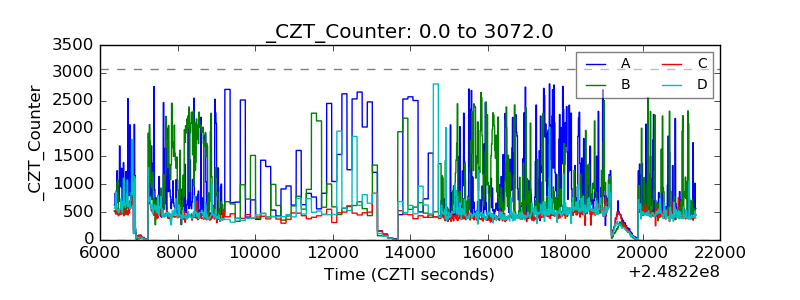 |
| +2.5 Volts monitor |  |
| +5 Volts monitor |  |
| _ROLL_ROT | 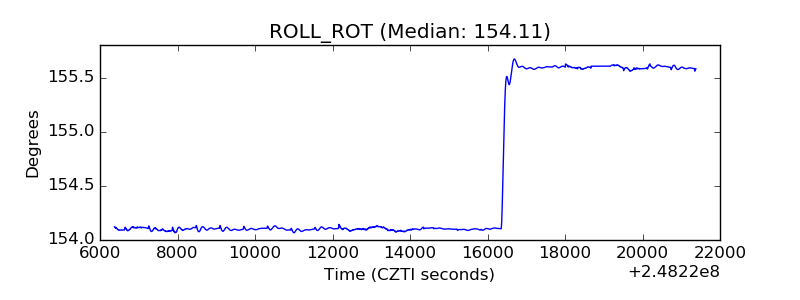 |
| _Roll_DEC | 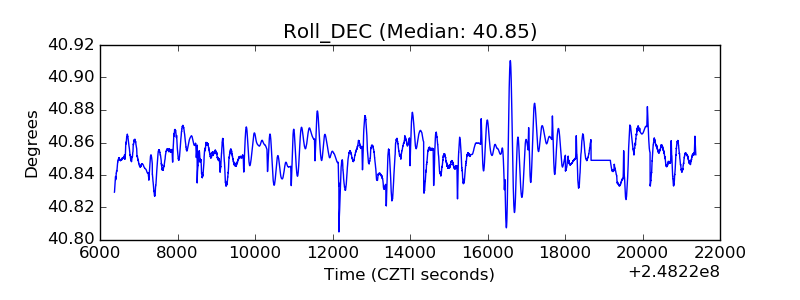 |
| _Roll_RA | 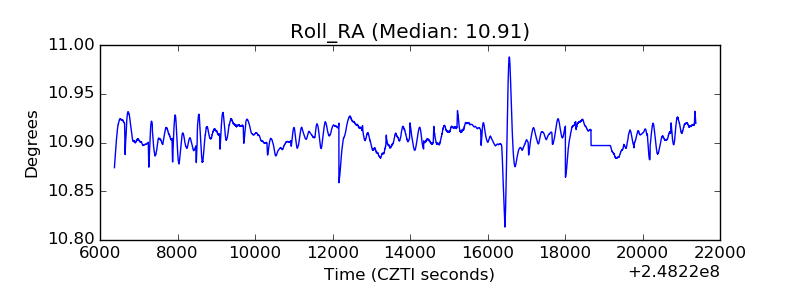 |
| Veto Counter | 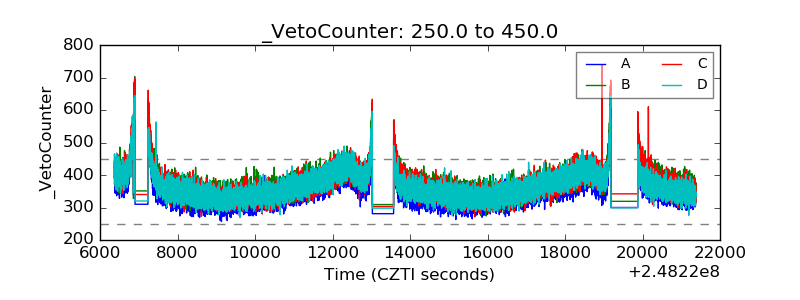 |