| Param | Original file | Final file |
|---|---|---|
| Filename | modeM0/AS1A04_021T05_9000001686_11501cztM0_level2.evt | modeM0/AS1A04_021T05_9000001686_11501cztM0_level2_quad_clean.evt |
| Size (bytes) | 705,147,840 | 75,847,680 |
| Size | 672.5 MB | 72.3 MB |
| Events in quadrant A | 6,372,211 | 420,099 |
| Events in quadrant B | 7,300,793 | 439,251 |
| Events in quadrant C | 3,327,393 | 478,026 |
| Events in quadrant D | 3,859,303 | 448,692 |
| Mode M9 | |||
|---|---|---|---|
| Quadrant | BADHDUFLAG | Total packets | Discarded packets |
| A | 0 | 15 | 0 |
| B | 0 | 15 | 0 |
| C | 0 | 15 | 0 |
| D | 0 | 15 | 0 |
| Mode SS | |||
|---|---|---|---|
| Quadrant | BADHDUFLAG | Total packets | Discarded packets |
| A | 0 | 152 | 0 |
| B | 0 | 152 | 0 |
| C | 0 | 152 | 0 |
| D | 0 | 152 | 0 |
| Mode M0 | |||
|---|---|---|---|
| Quadrant | BADHDUFLAG | Total packets | Discarded packets |
| A | 0 | 23891 | 3 |
| B | 0 | 26491 | 2 |
| C | 0 | 14929 | 2 |
| D | 0 | 16441 | 2 |
| Quadrant | Total seconds | Saturated seconds | Saturation percentage |
|---|---|---|---|
| A | 7324 | 813 | 11.100492% |
| B | 7324 | 1309 | 17.872747% |
| C | 7324 | 51 | 0.696341% |
| D | 7324 | 99 | 1.351720% |
Noise dominated data is calculated using 1-second bins in cleaned event files. If a bin has >2000 counts, and if more than 50% of those come from <1% of pixels, then it is considered to be noise-dominated and hence unusable.
| Quadrant | # 1 sec bins | Bins with >0 counts | Bins with >2000 counts | High rate bins dominated by noise | Noise dominated (total time) | Noise dominated (detector-on time) | Marked lightcurve |
|---|---|---|---|---|---|---|---|
| A | 8860 | 7327 | 461 | 461 | 5.20% | 6.29% | 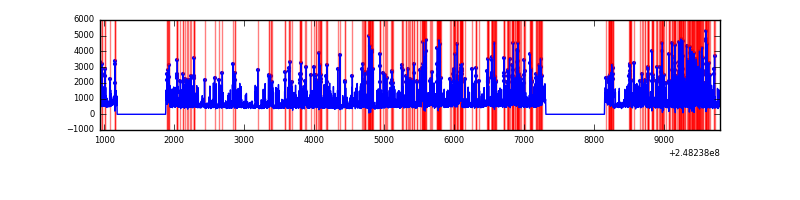 |
| B | 8860 | 7327 | 920 | 920 | 10.38% | 12.56% | 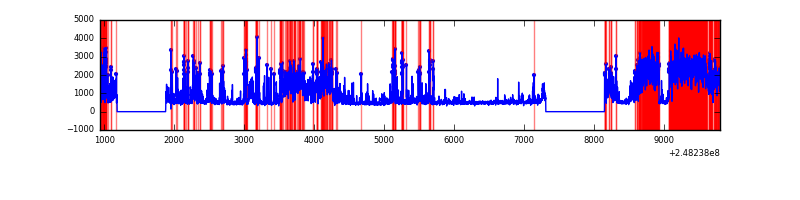 |
| C | 8860 | 7327 | 0 | 0 | 0.00% | 0.00% | 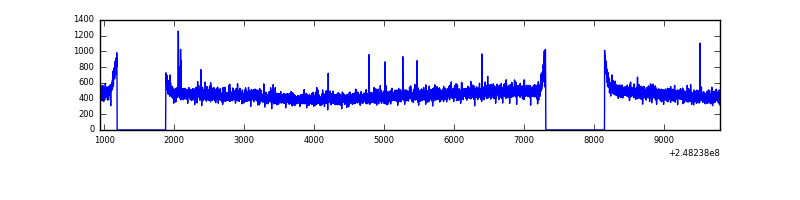 |
| D | 8860 | 7327 | 49 | 49 | 0.55% | 0.67% | 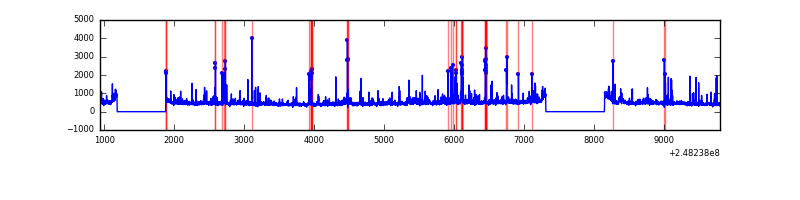 |
Top three noisy pixels from each quadrant. If the there are fewer than three noisy pixels in the level2.evt file, extra rows are filled as -1
| Pixel properties | Quadrant properties | ||||||
|---|---|---|---|---|---|---|---|
| Quadrant | DetID | PixID | Counts | Sigma | Mean | Median | Sigma |
| A | 8 | 5 | 3037624 | 17915.06 | 821 | 802 | 169.5 |
| A | 1 | 162 | 50032 | 290.42 | 821 | 802 | 169.5 |
| A | 9 | 143 | 25243 | 144.18 | 821 | 802 | 169.5 |
| B | 4 | 81 | 2860928 | 18519.02 | 806 | 784 | 154.4 |
| B | 4 | 239 | 811512 | 5249.35 | 806 | 784 | 154.4 |
| B | 3 | 64 | 362323 | 2340.91 | 806 | 784 | 154.4 |
| C | 12 | 4 | 16155 | 77.28 | 849 | 854 | 198.0 |
| C | 13 | 61 | 6269 | 27.35 | 849 | 854 | 198.0 |
| C | 3 | 202 | 2017 | 5.87 | 849 | 854 | 198.0 |
| D | 6 | 219 | 221281 | 1097.48 | 836 | 813 | 200.9 |
| D | 1 | 52 | 172593 | 855.11 | 836 | 813 | 200.9 |
| D | 2 | 120 | 76222 | 375.38 | 836 | 813 | 200.9 |
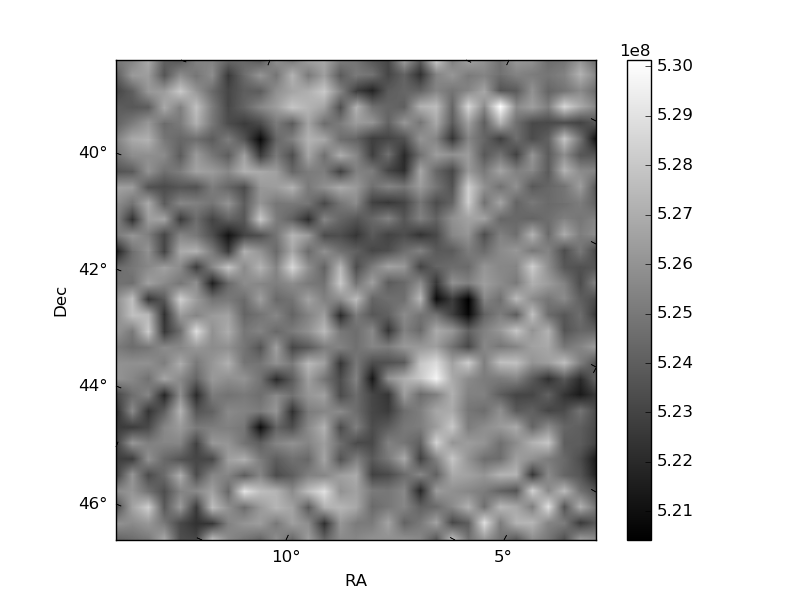
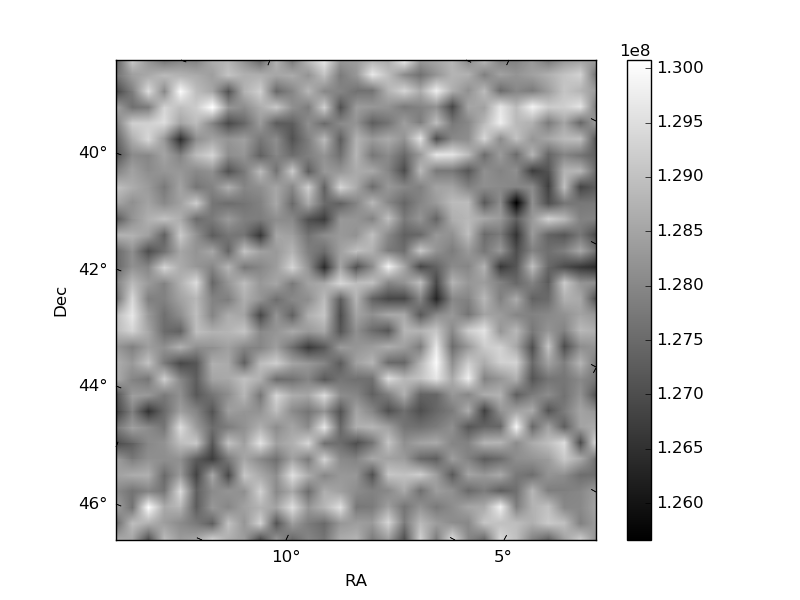
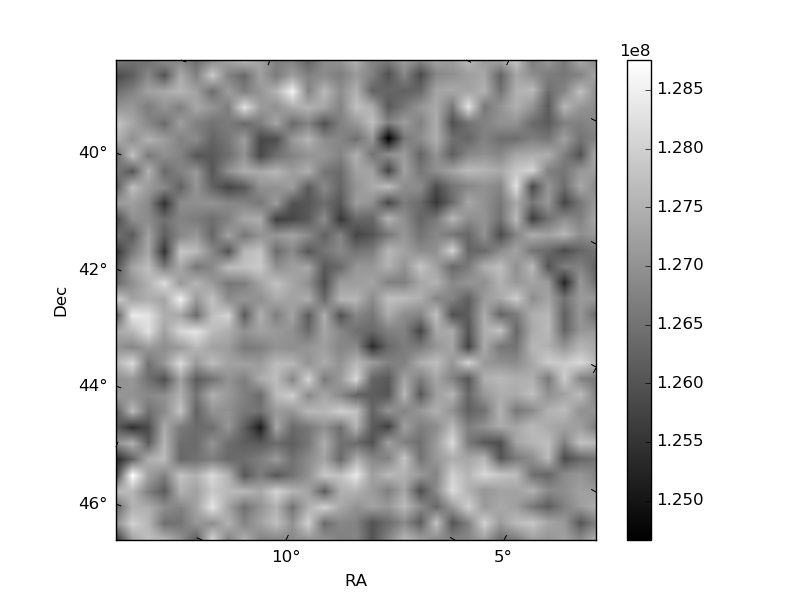
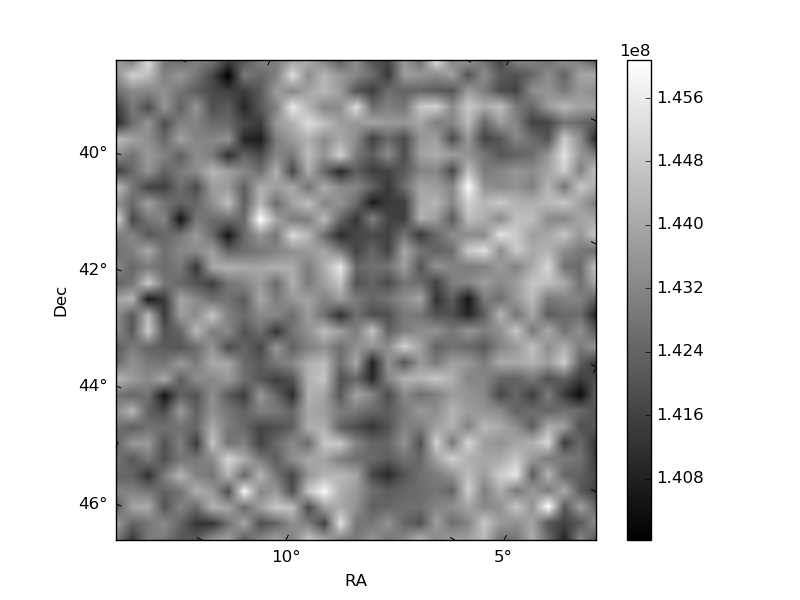
Histogram calculated using DETX and DETY for each event in the final _common_clean file
| Quadrant A | 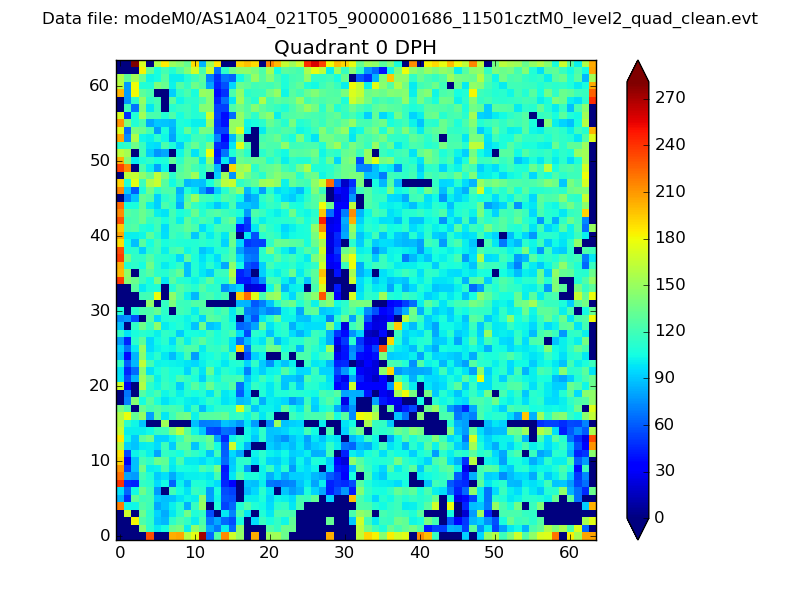 |
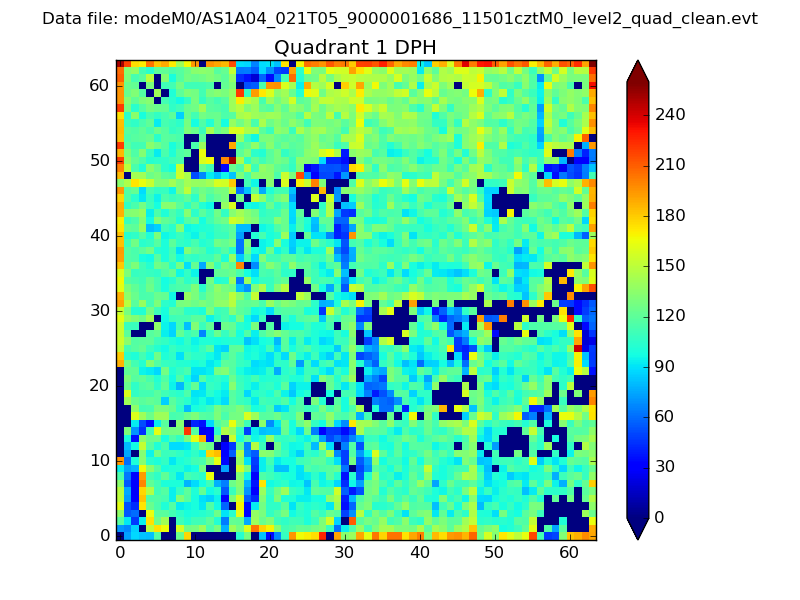 |
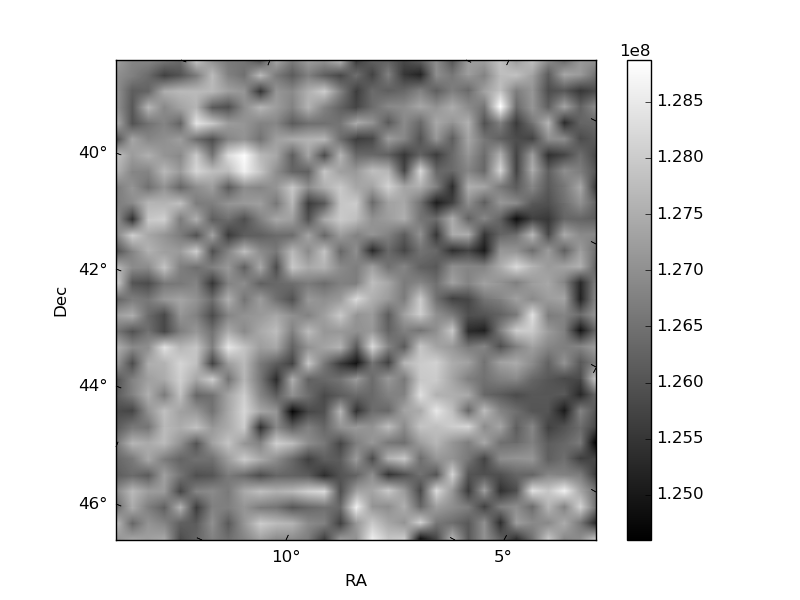
Quadrant B |
|---|---|---|---|
| Quadrant D | 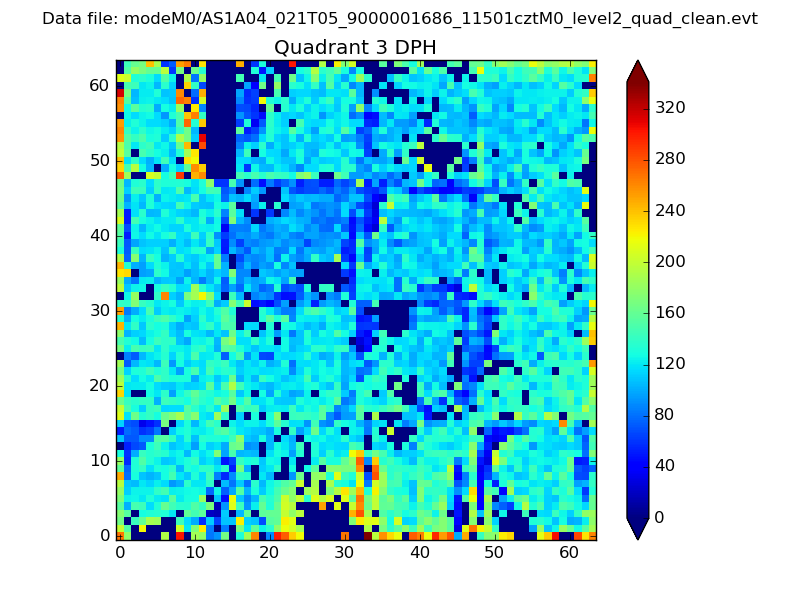 |
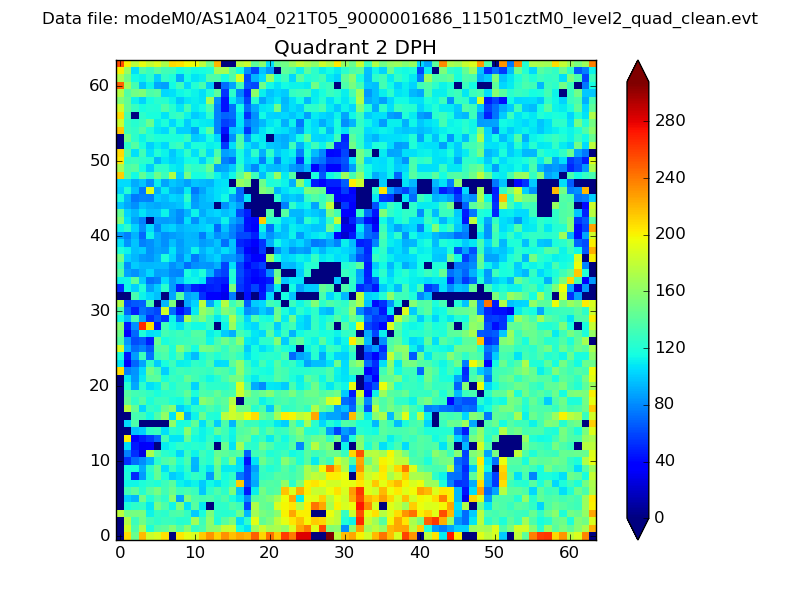 |
Quadrant C |
| Plot type | Count rate plots | Images |
|---|---|---|
| Comparison with Poisson distribution Blue bars denote a histogram of data divided into 1 sec bins. Red curve is a Poisson curve with rate = median count rate of data. |
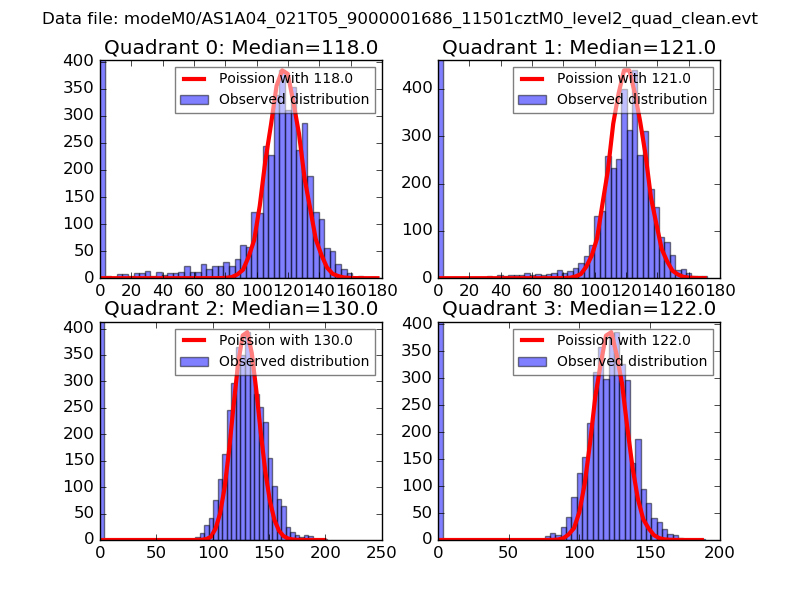 |
 |
| Quadrant-wise count rates Data is divided into 100 sec bins |
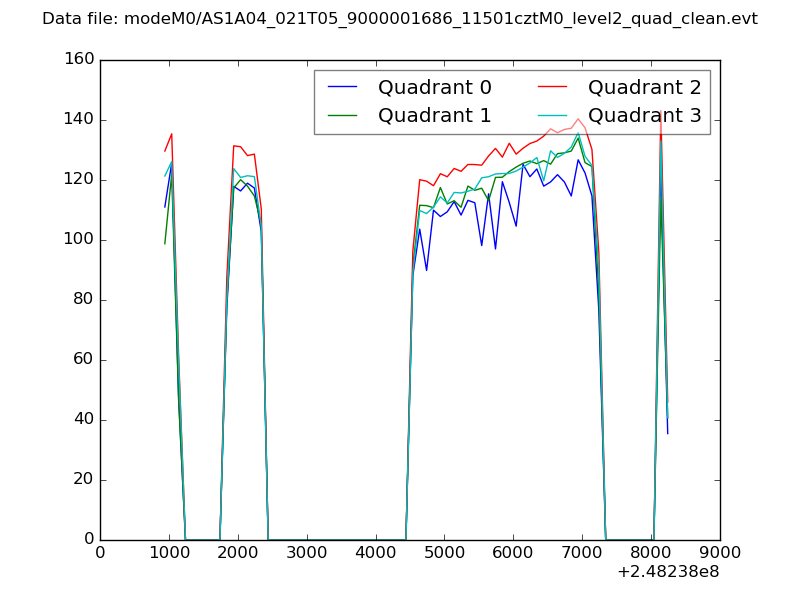 |
|
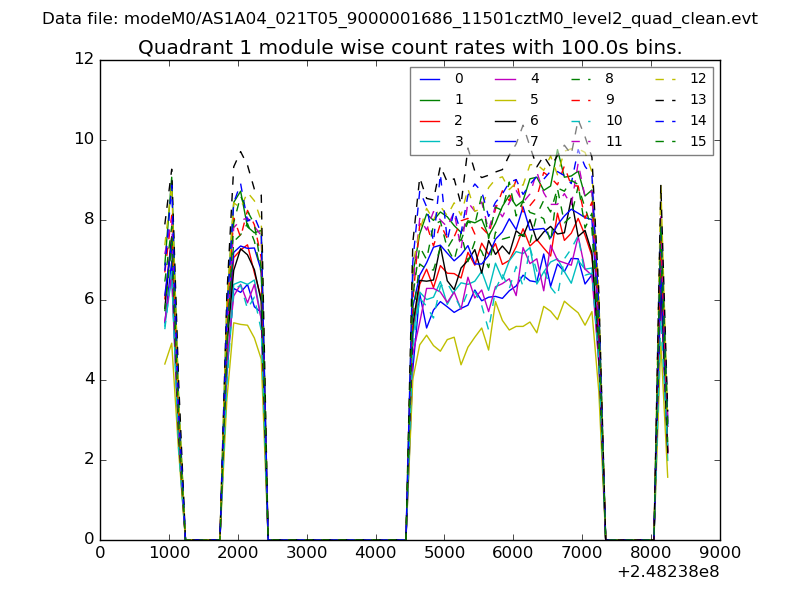
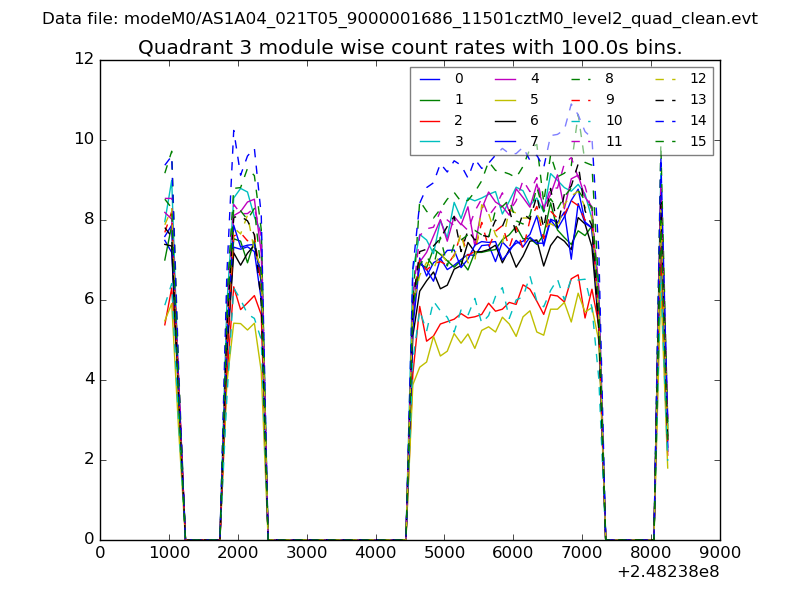
| Module-wise count rates for Quadrant A Data is divided into 100 sec bins |
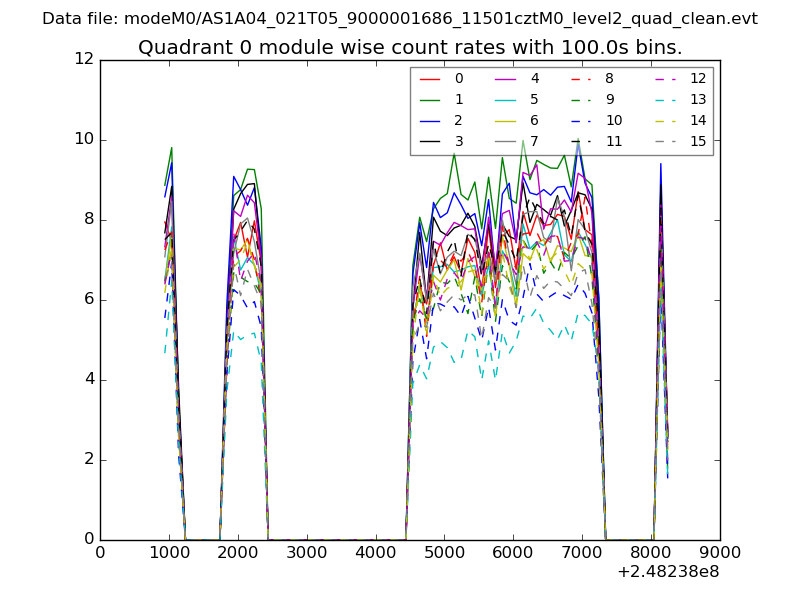 |
 |
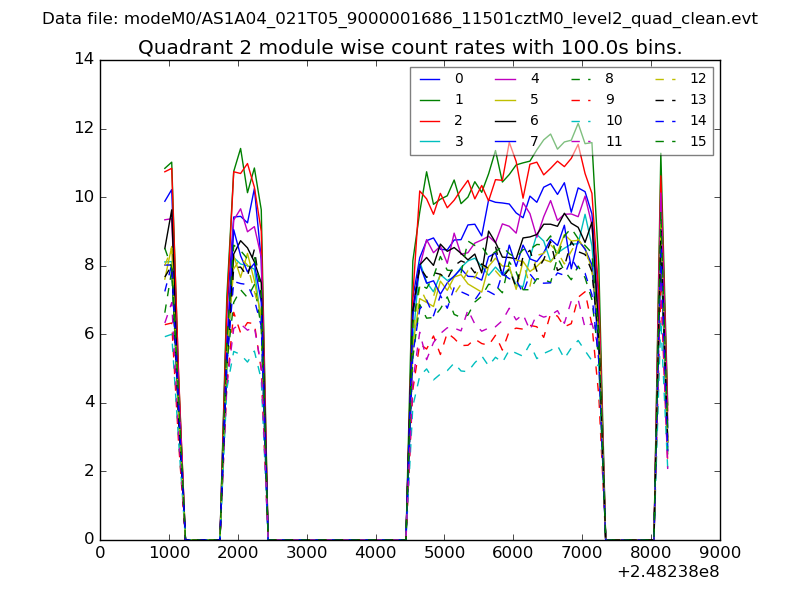
| Module-wise count rates for Quadrant B Data is divided into 100 sec bins |
 |
 |
| Module-wise count rates for Quadrant C Data is divided into 100 sec bins |
 |
 |
| Module-wise count rates for Quadrant D Data is divided into 100 sec bins |
 |
 |
| Parameter | Plot |
|---|---|
| CZT HV Monitor | 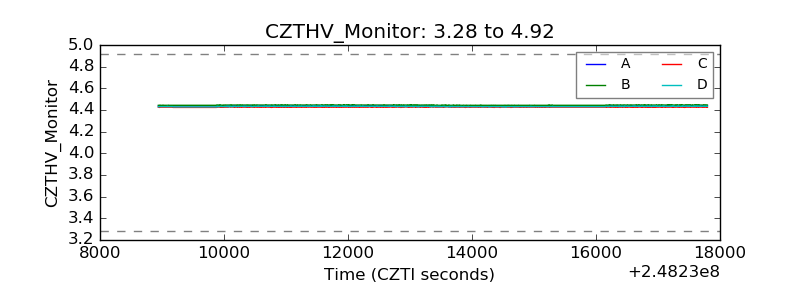 |
| D_VDD | 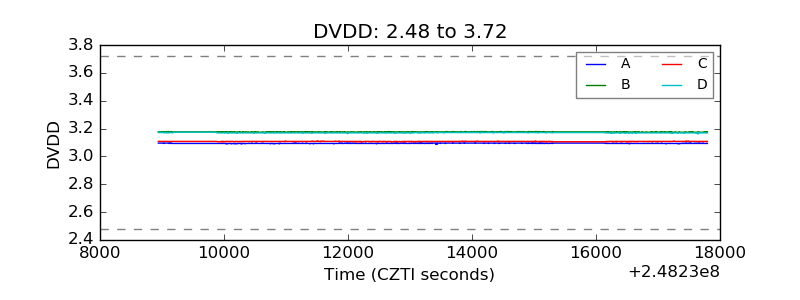 |
| Temperature 1 | 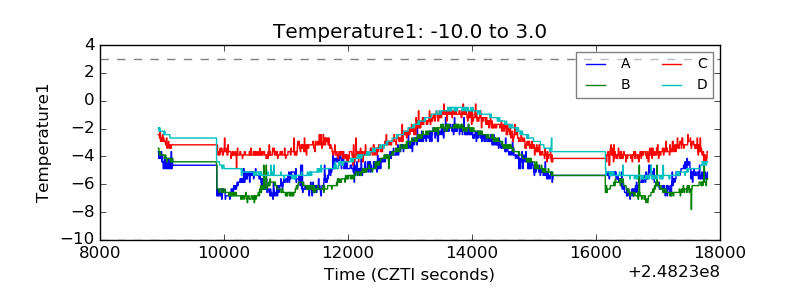 |
| Veto HV Monitor | 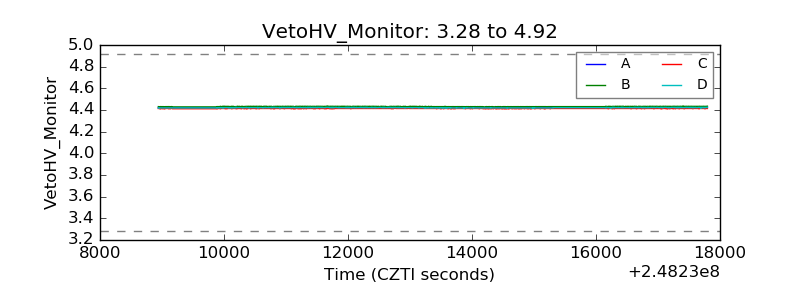 |
| Veto LLD | 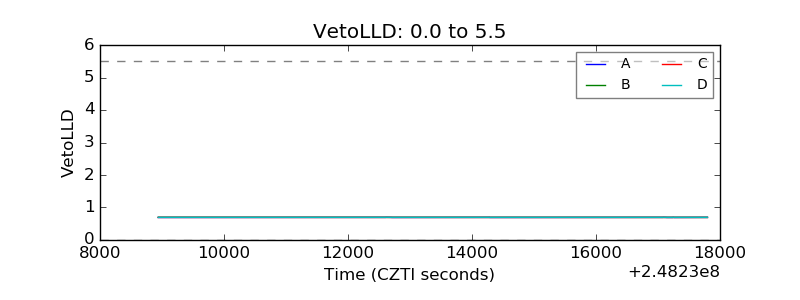 |
| Alpha Counter | 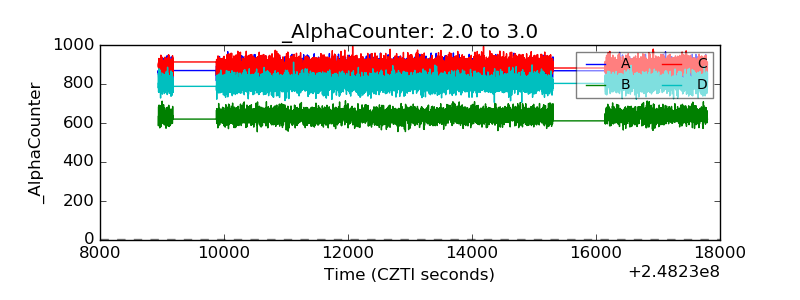 |
| _CPM_Rate | 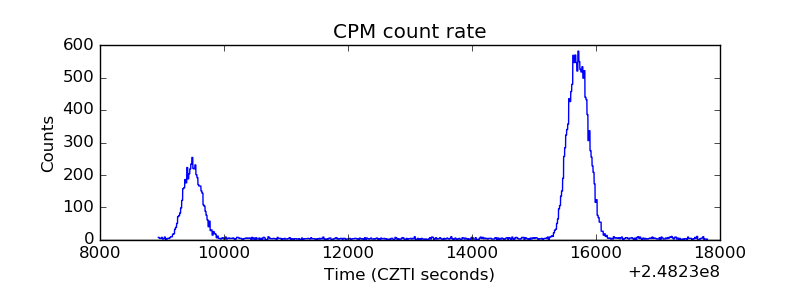 |
| CZT Counter | 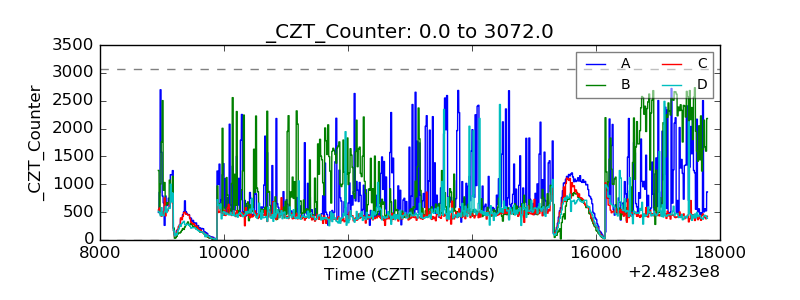 |
| +2.5 Volts monitor | 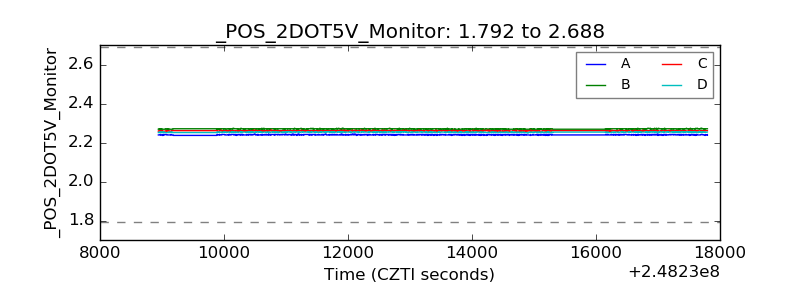 |
| +5 Volts monitor | 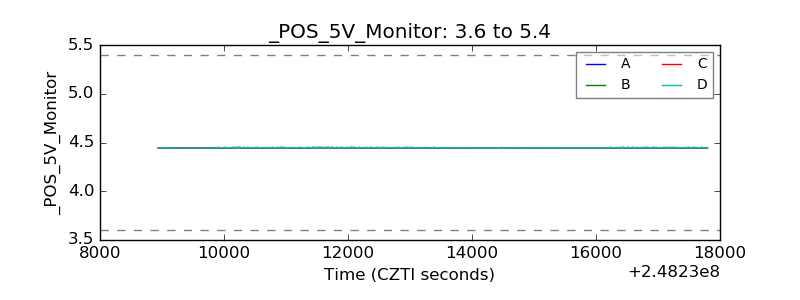 |
| _ROLL_ROT | 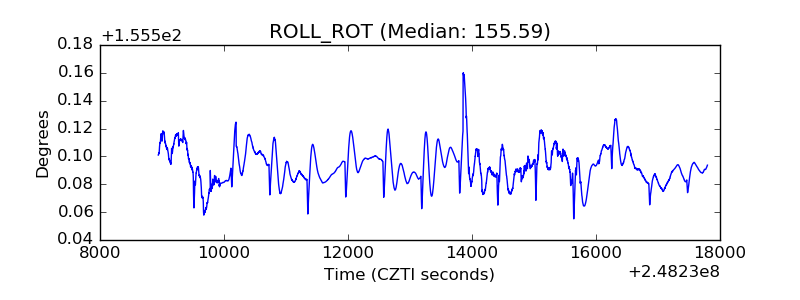 |
| _Roll_DEC | 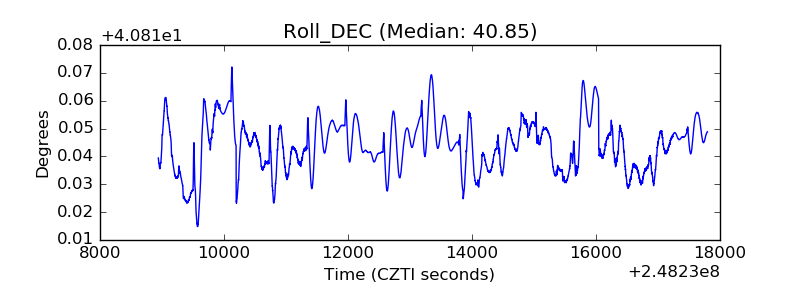 |
| _Roll_RA | 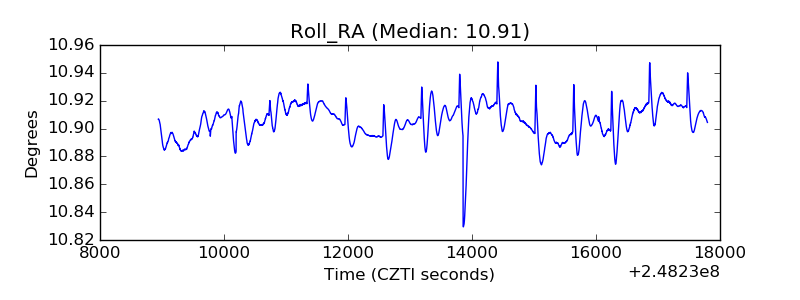 |
| Veto Counter | 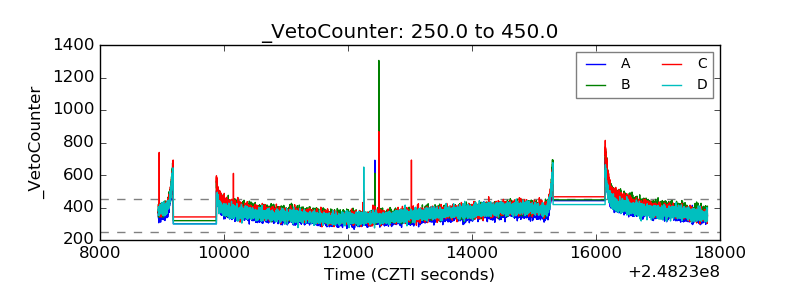 |