| Param | Original file | Final file |
|---|---|---|
| Filename | modeM0/AS1A04_021T05_9000001686_11502cztM0_level2.evt | modeM0/AS1A04_021T05_9000001686_11502cztM0_level2_quad_clean.evt |
| Size (bytes) | 2,248,231,680 | 252,457,920 |
| Size | 2.1 GB | 240.8 MB |
| Events in quadrant A | 23,012,581 | 1,378,193 |
| Events in quadrant B | 20,839,983 | 1,501,093 |
| Events in quadrant C | 10,202,606 | 1,655,025 |
| Events in quadrant D | 12,499,479 | 1,541,865 |
| Mode M9 | |||
|---|---|---|---|
| Quadrant | BADHDUFLAG | Total packets | Discarded packets |
| A | 0 | 30 | 0 |
| B | 0 | 30 | 0 |
| C | 0 | 30 | 0 |
| D | 0 | 30 | 0 |
| Mode SS | |||
|---|---|---|---|
| Quadrant | BADHDUFLAG | Total packets | Discarded packets |
| A | 0 | 466 | 0 |
| B | 0 | 466 | 0 |
| C | 0 | 466 | 0 |
| D | 0 | 466 | 0 |
| Mode M0 | |||
|---|---|---|---|
| Quadrant | BADHDUFLAG | Total packets | Discarded packets |
| A | 0 | 83785 | 5 |
| B | 0 | 76939 | 4 |
| C | 0 | 46179 | 4 |
| D | 0 | 52642 | 4 |
| Quadrant | Total seconds | Saturated seconds | Saturation percentage |
|---|---|---|---|
| A | 22775 | 4002 | 17.571899% |
| B | 22775 | 3077 | 13.510428% |
| C | 22775 | 93 | 0.408342% |
| D | 22775 | 351 | 1.541164% |
Noise dominated data is calculated using 1-second bins in cleaned event files. If a bin has >2000 counts, and if more than 50% of those come from <1% of pixels, then it is considered to be noise-dominated and hence unusable.
| Quadrant | # 1 sec bins | Bins with >0 counts | Bins with >2000 counts | High rate bins dominated by noise | Noise dominated (total time) | Noise dominated (detector-on time) | Marked lightcurve |
|---|---|---|---|---|---|---|---|
| A | 25861 | 22780 | 2642 | 2642 | 10.22% | 11.60% | 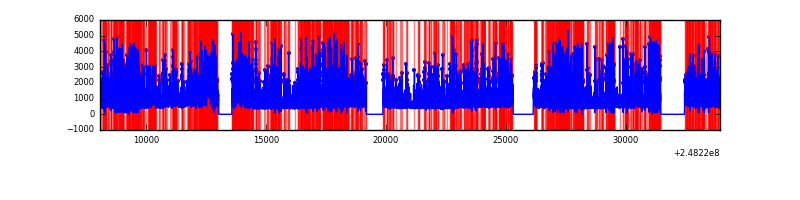 |
| B | 25861 | 22780 | 2214 | 2214 | 8.56% | 9.72% | 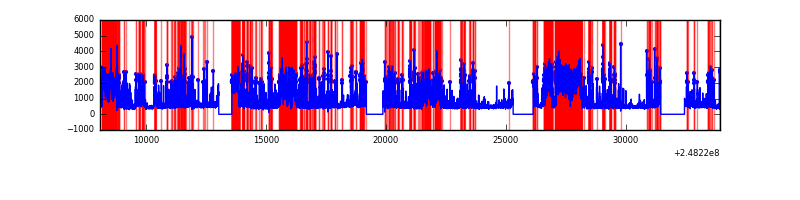 |
| C | 25861 | 22780 | 0 | 0 | 0.00% | 0.00% | 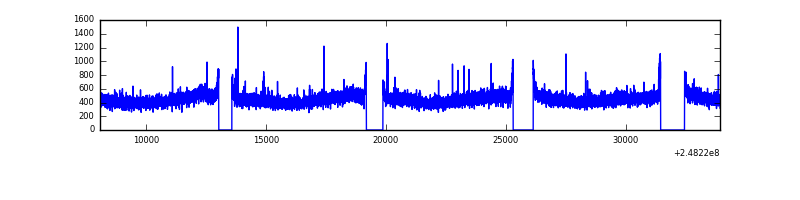 |
| D | 25861 | 22779 | 205 | 205 | 0.79% | 0.90% | 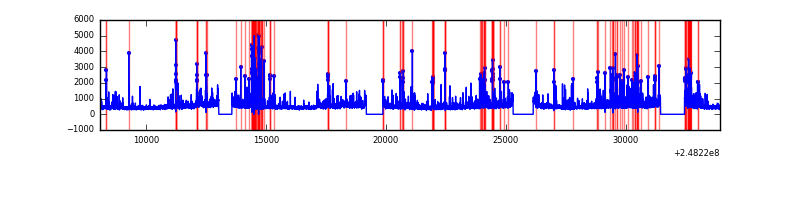 |
Top three noisy pixels from each quadrant. If the there are fewer than three noisy pixels in the level2.evt file, extra rows are filled as -1
| Pixel properties | Quadrant properties | ||||||
|---|---|---|---|---|---|---|---|
| Quadrant | DetID | PixID | Counts | Sigma | Mean | Median | Sigma |
| A | 8 | 5 | 13129690 | 26376.31 | 2442 | 2389 | 497.7 |
| A | 1 | 162 | 110472 | 217.17 | 2442 | 2389 | 497.7 |
| A | 9 | 143 | 92303 | 180.66 | 2442 | 2389 | 497.7 |
| B | 4 | 81 | 6117623 | 12808.78 | 2531 | 2462 | 477.4 |
| B | 4 | 239 | 2780431 | 5818.72 | 2531 | 2462 | 477.4 |
| B | 3 | 64 | 1587147 | 3319.27 | 2531 | 2462 | 477.4 |
| C | 12 | 4 | 33787 | 51.77 | 2610 | 2630 | 601.8 |
| C | 13 | 61 | 18948 | 27.11 | 2610 | 2630 | 601.8 |
| C | 3 | 202 | 6238 | 6.0 | 2610 | 2630 | 601.8 |
| D | 1 | 52 | 669069 | 1085.49 | 2576 | 2502 | 614.1 |
| D | 6 | 219 | 537674 | 871.52 | 2576 | 2502 | 614.1 |
| D | 2 | 120 | 463585 | 750.87 | 2576 | 2502 | 614.1 |
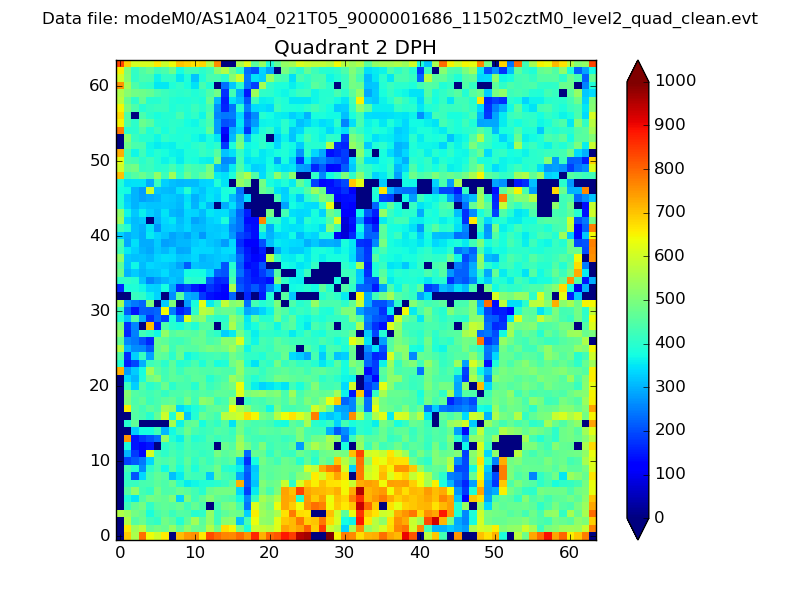
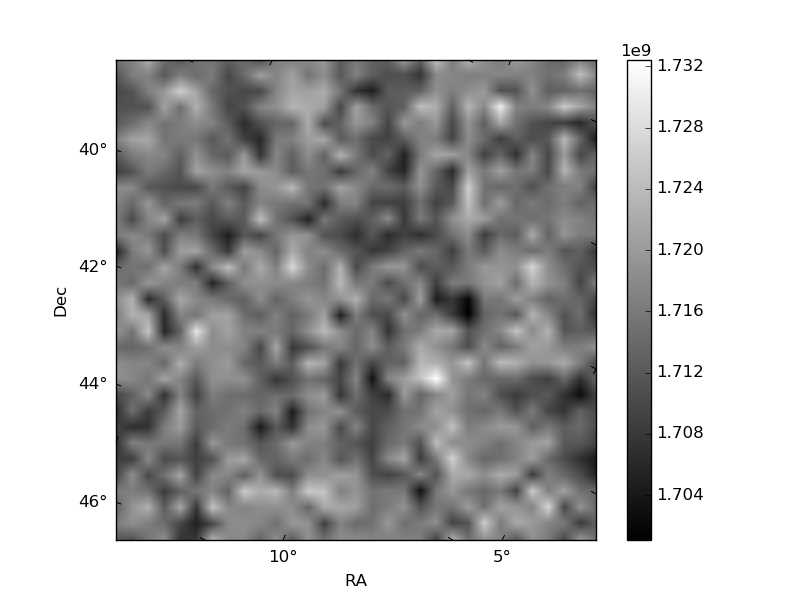
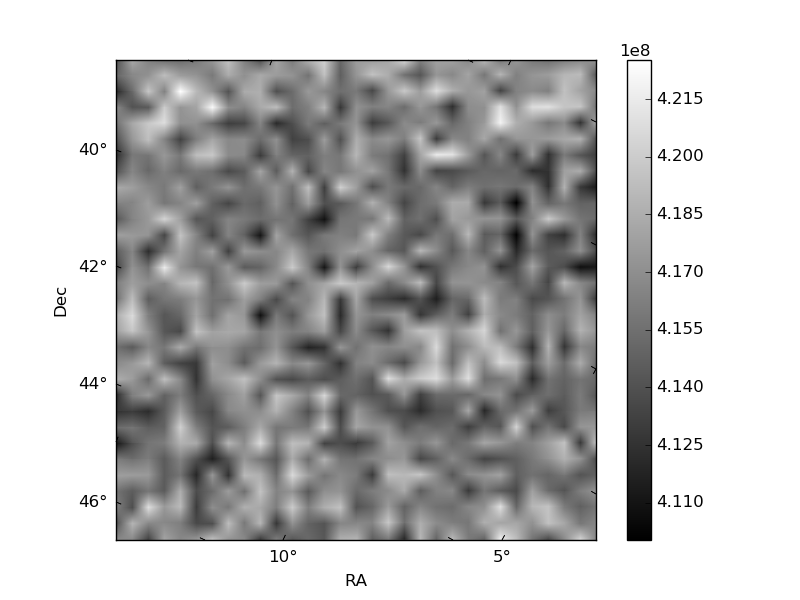
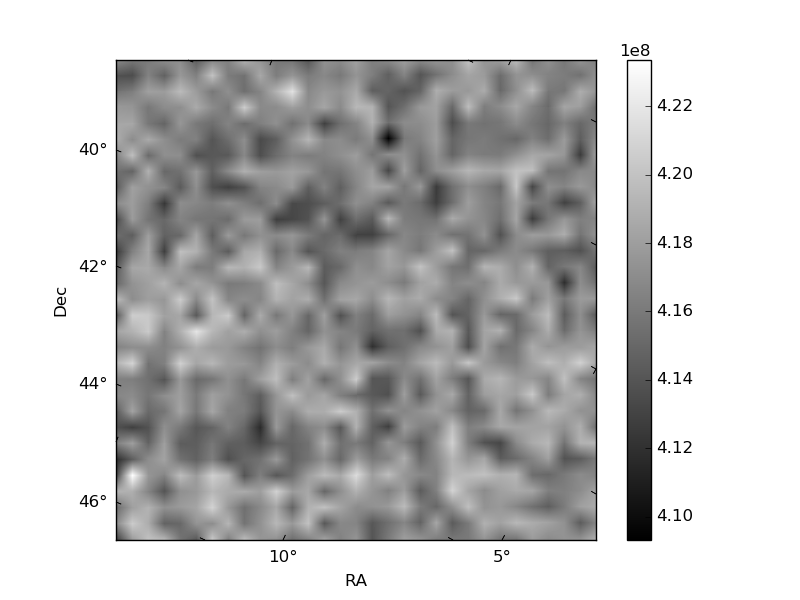
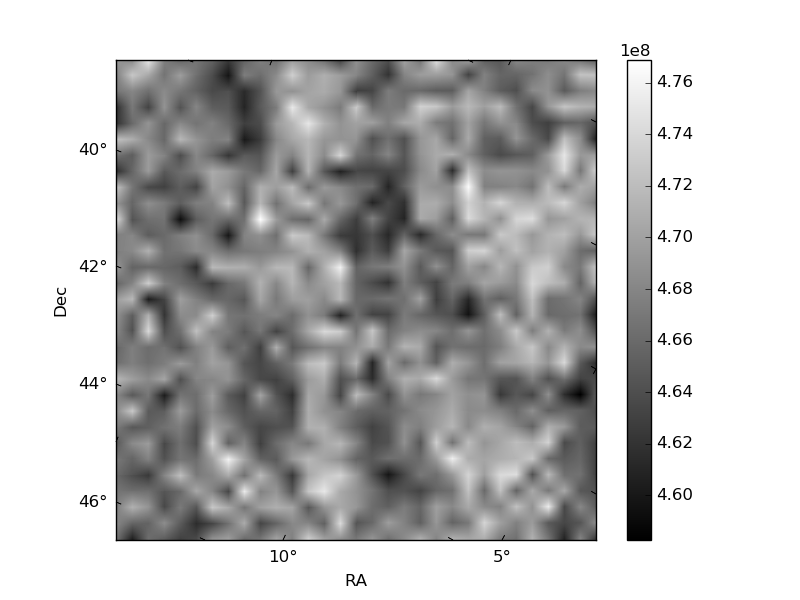
Histogram calculated using DETX and DETY for each event in the final _common_clean file
| Quadrant A | 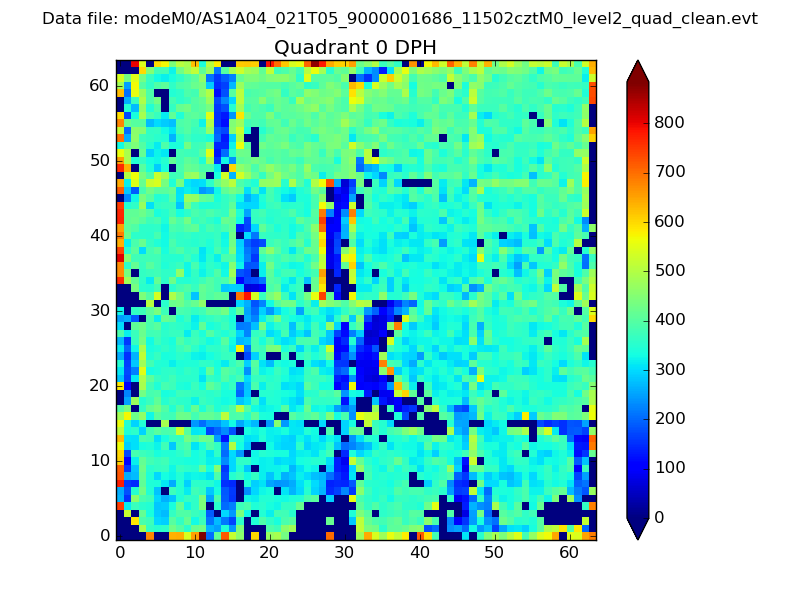 |
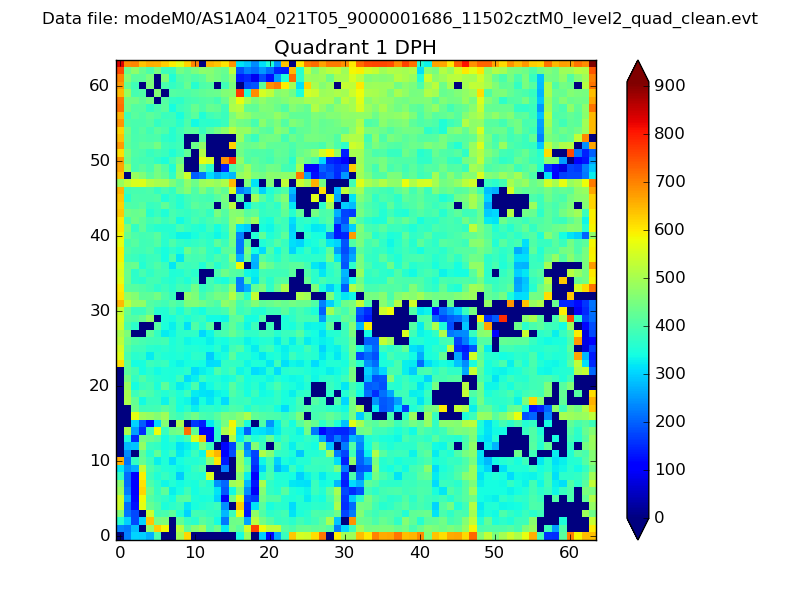 |
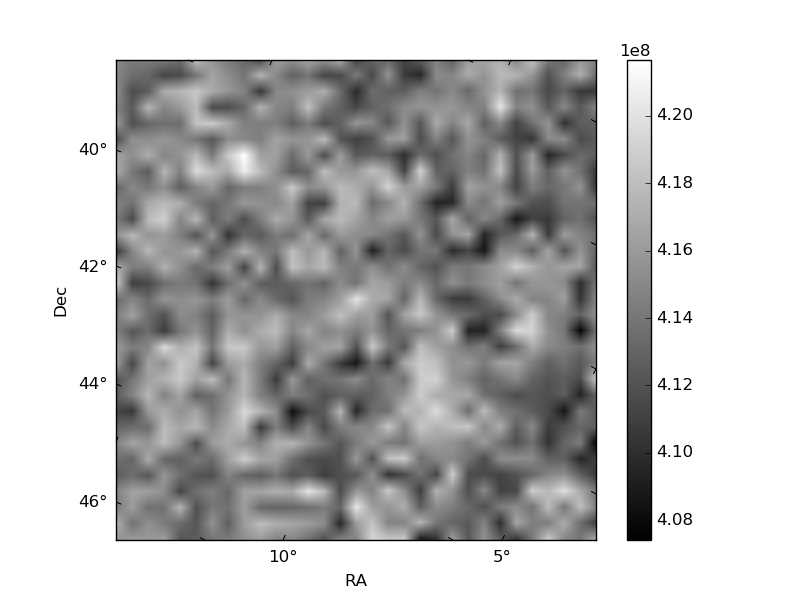
Quadrant B |
|---|---|---|---|
| Quadrant D | 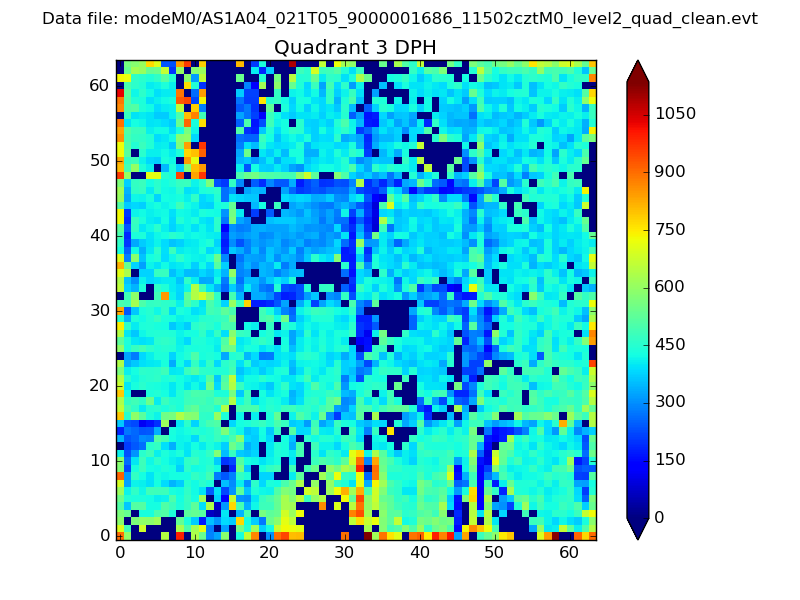 |
 |
Quadrant C |
| Plot type | Count rate plots | Images |
|---|---|---|
| Comparison with Poisson distribution Blue bars denote a histogram of data divided into 1 sec bins. Red curve is a Poisson curve with rate = median count rate of data. |
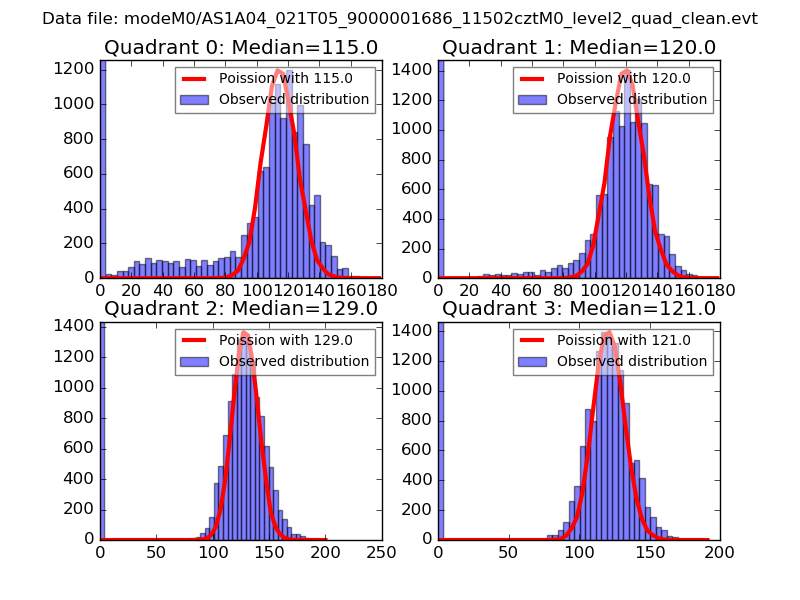 |
 |
| Quadrant-wise count rates Data is divided into 100 sec bins |
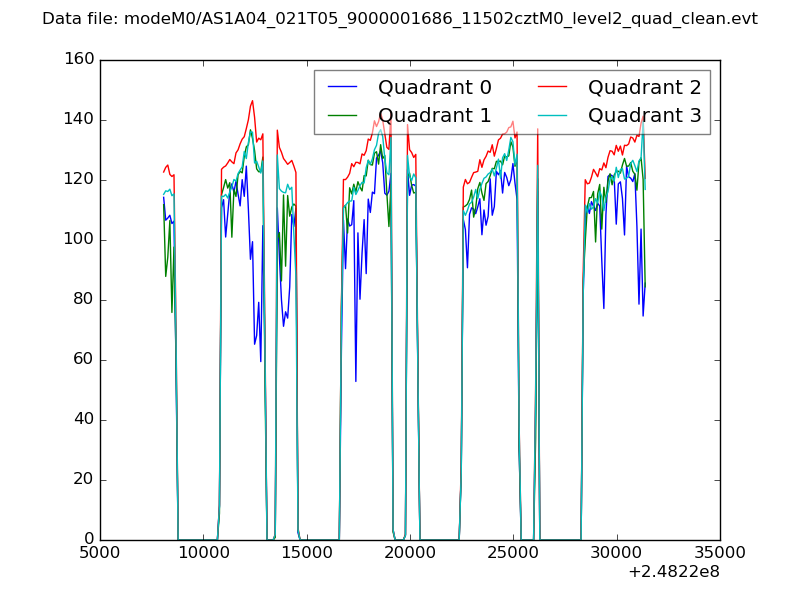 |
|
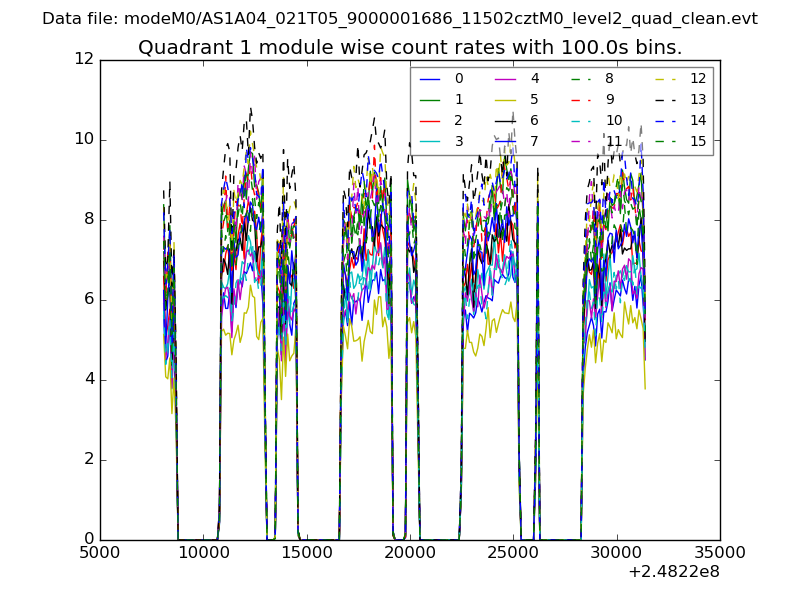
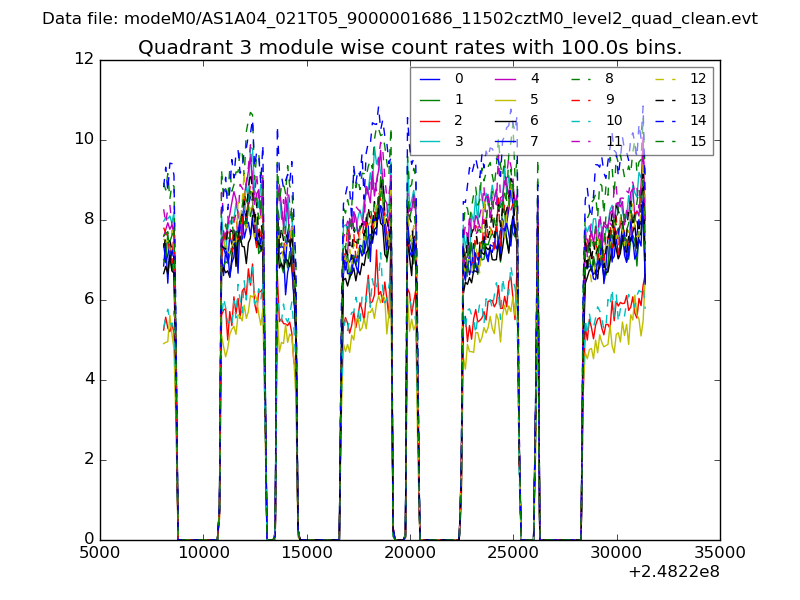
| Module-wise count rates for Quadrant A Data is divided into 100 sec bins |
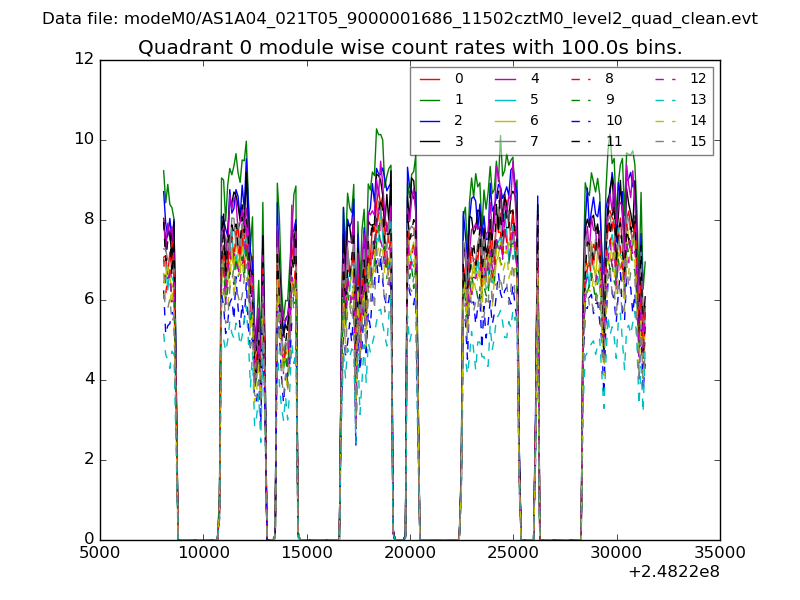 |
 |
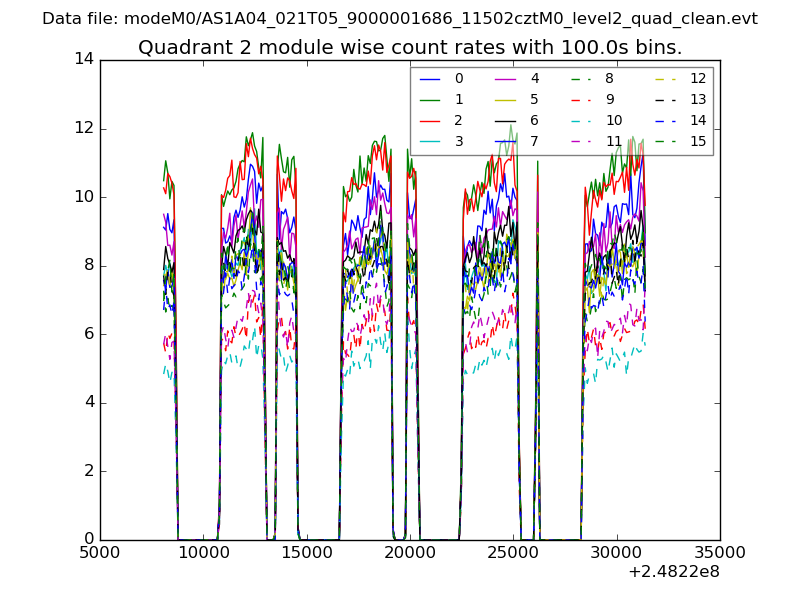
| Module-wise count rates for Quadrant B Data is divided into 100 sec bins |
 |
 |
| Module-wise count rates for Quadrant C Data is divided into 100 sec bins |
 |
 |
| Module-wise count rates for Quadrant D Data is divided into 100 sec bins |
 |
 |
| Parameter | Plot |
|---|---|
| CZT HV Monitor | 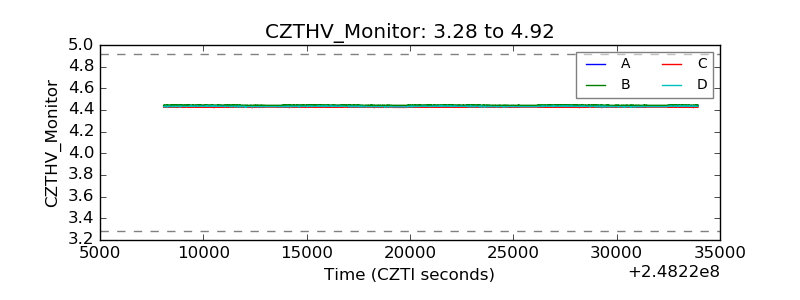 |
| D_VDD | 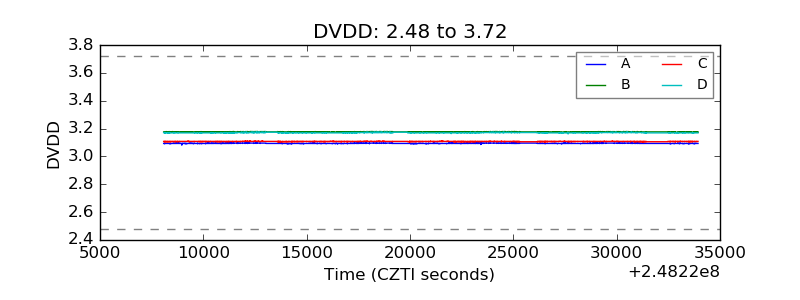 |
| Temperature 1 | 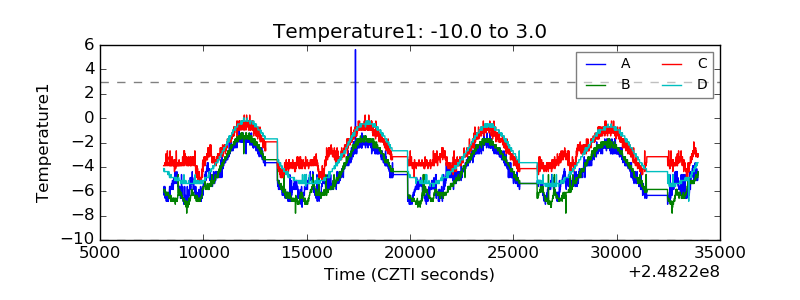 |
| Veto HV Monitor | 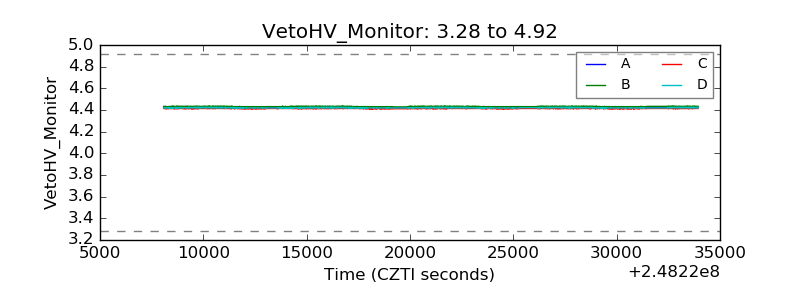 |
| Veto LLD | 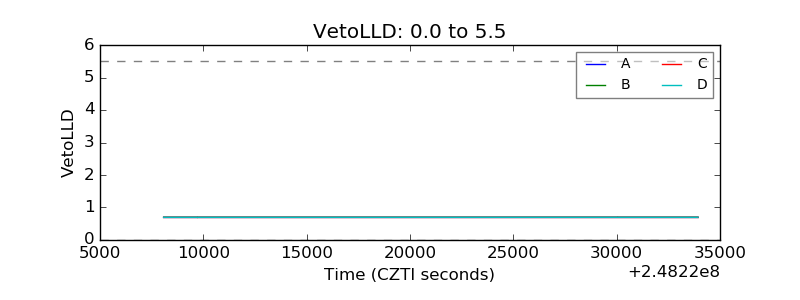 |
| Alpha Counter | 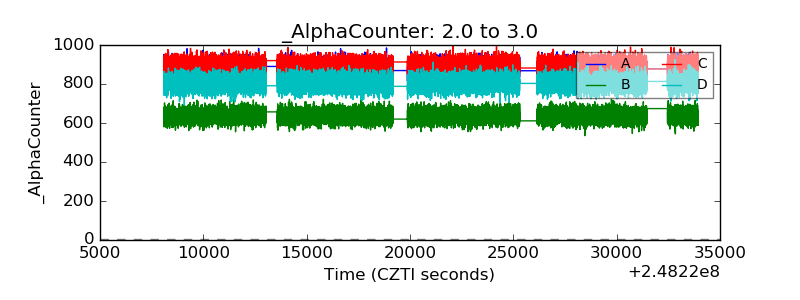 |
| _CPM_Rate | 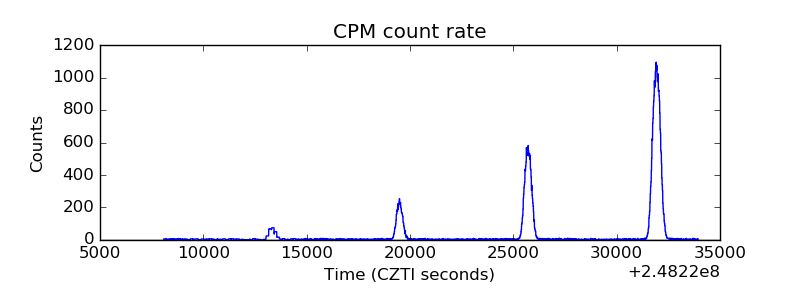 |
| CZT Counter | 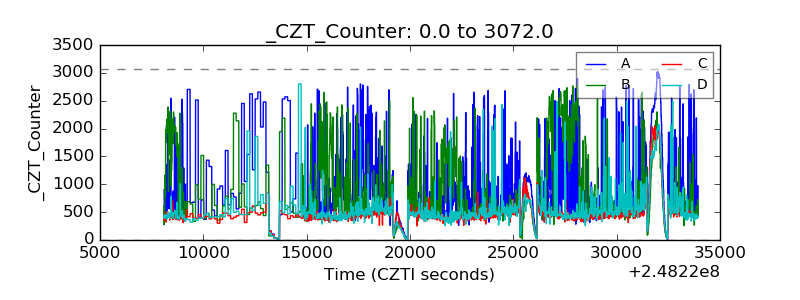 |
| +2.5 Volts monitor |  |
| +5 Volts monitor | 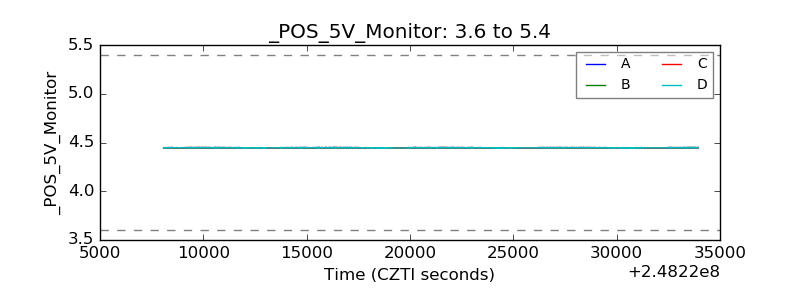 |
| _ROLL_ROT | 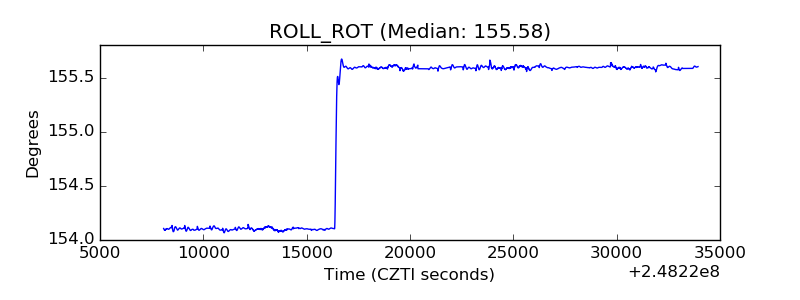 |
| _Roll_DEC | 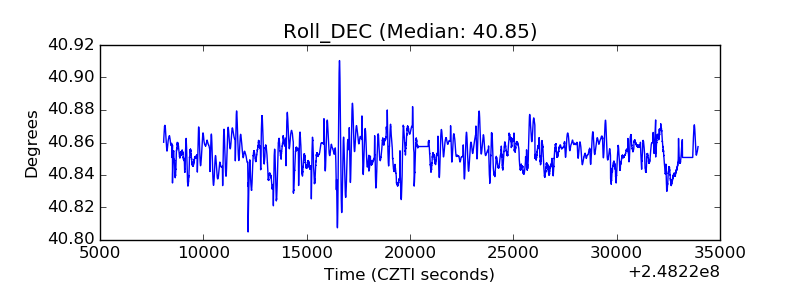 |
| _Roll_RA | 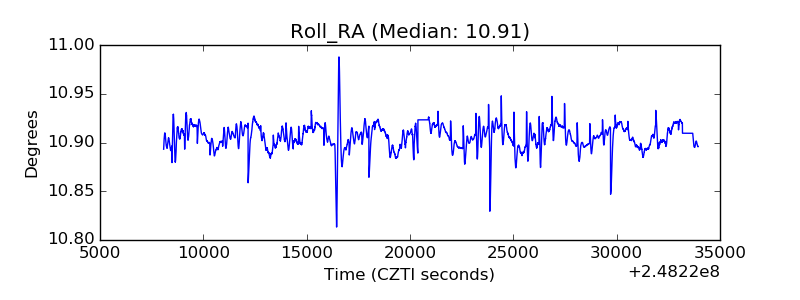 |
| Veto Counter | 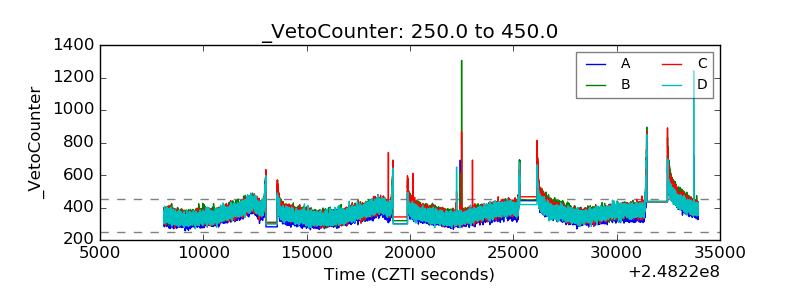 |