| Param | Original file | Final file |
|---|---|---|
| Filename | modeM0/AS1A04_021T05_9000001686_11505cztM0_level2.evt | modeM0/AS1A04_021T05_9000001686_11505cztM0_level2_quad_clean.evt |
| Size (bytes) | 661,377,600 | 82,702,080 |
| Size | 630.7 MB | 78.9 MB |
| Events in quadrant A | 7,826,808 | 475,788 |
| Events in quadrant B | 4,360,160 | 524,198 |
| Events in quadrant C | 3,109,980 | 551,760 |
| Events in quadrant D | 4,302,512 | 507,814 |
| Mode M9 | |||
|---|---|---|---|
| Quadrant | BADHDUFLAG | Total packets | Discarded packets |
| A | 0 | 17 | 0 |
| B | 0 | 17 | 0 |
| C | 0 | 17 | 0 |
| D | 0 | 18 | 0 |
| Mode SS | |||
|---|---|---|---|
| Quadrant | BADHDUFLAG | Total packets | Discarded packets |
| A | 0 | 130 | 0 |
| B | 0 | 130 | 0 |
| C | 0 | 130 | 0 |
| D | 0 | 130 | 0 |
| Mode M0 | |||
|---|---|---|---|
| Quadrant | BADHDUFLAG | Total packets | Discarded packets |
| A | 0 | 27731 | 3 |
| B | 0 | 17073 | 2 |
| C | 0 | 13244 | 2 |
| D | 0 | 16891 | 2 |
| Quadrant | Total seconds | Saturated seconds | Saturation percentage |
|---|---|---|---|
| A | 6363 | 1393 | 21.892189% |
| B | 6363 | 288 | 4.526167% |
| C | 6363 | 40 | 0.628634% |
| D | 6363 | 226 | 3.551784% |
Noise dominated data is calculated using 1-second bins in cleaned event files. If a bin has >2000 counts, and if more than 50% of those come from <1% of pixels, then it is considered to be noise-dominated and hence unusable.
| Quadrant | # 1 sec bins | Bins with >0 counts | Bins with >2000 counts | High rate bins dominated by noise | Noise dominated (total time) | Noise dominated (detector-on time) | Marked lightcurve |
|---|---|---|---|---|---|---|---|
| A | 7579 | 6365 | 1016 | 1016 | 13.41% | 15.96% | 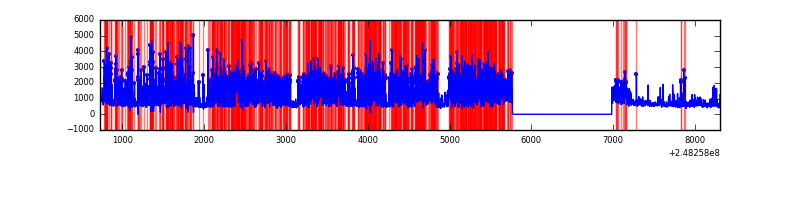 |
| B | 7579 | 6365 | 116 | 116 | 1.53% | 1.82% | 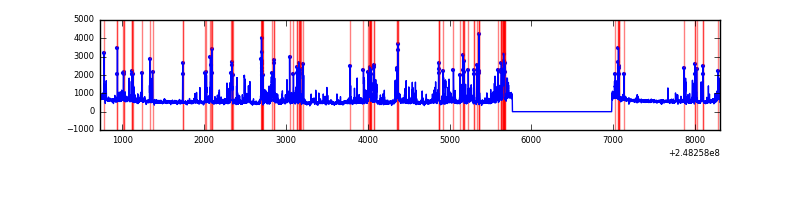 |
| C | 7579 | 6365 | 0 | 0 | 0.00% | 0.00% | 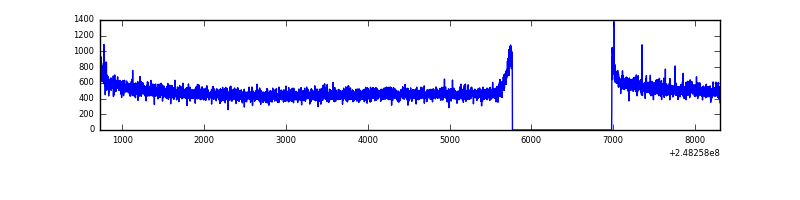 |
| D | 7579 | 6365 | 158 | 158 | 2.08% | 2.48% | 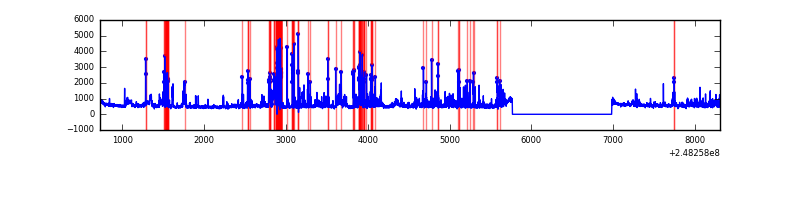 |
Top three noisy pixels from each quadrant. If the there are fewer than three noisy pixels in the level2.evt file, extra rows are filled as -1
| Pixel properties | Quadrant properties | ||||||
|---|---|---|---|---|---|---|---|
| Quadrant | DetID | PixID | Counts | Sigma | Mean | Median | Sigma |
| A | 8 | 5 | 4603510 | 29472.38 | 774 | 760 | 156.2 |
| A | 15 | 223 | 104300 | 662.99 | 774 | 760 | 156.2 |
| A | 15 | 239 | 51041 | 321.96 | 774 | 760 | 156.2 |
| B | 4 | 239 | 692584 | 4561.48 | 815 | 798 | 151.7 |
| B | 3 | 64 | 206270 | 1354.84 | 815 | 798 | 151.7 |
| B | 11 | 51 | 134594 | 882.22 | 815 | 798 | 151.7 |
| C | 12 | 4 | 8983 | 44.97 | 795 | 802 | 181.9 |
| C | 13 | 61 | 5770 | 27.31 | 795 | 802 | 181.9 |
| C | 14 | 234 | 2818 | 11.08 | 795 | 802 | 181.9 |
| D | 1 | 52 | 772435 | 4143.7 | 789 | 771 | 186.2 |
| D | 2 | 120 | 142475 | 760.93 | 789 | 771 | 186.2 |
| D | 13 | 137 | 128189 | 684.21 | 789 | 771 | 186.2 |
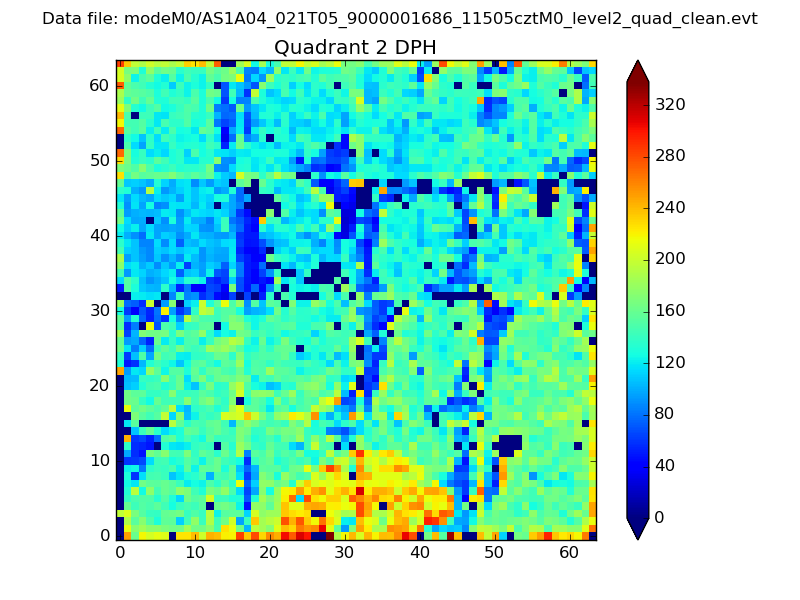
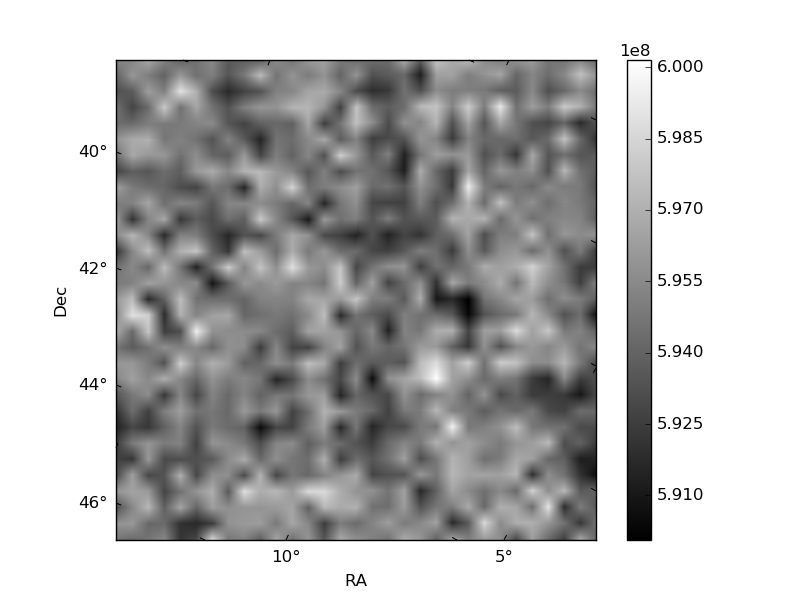
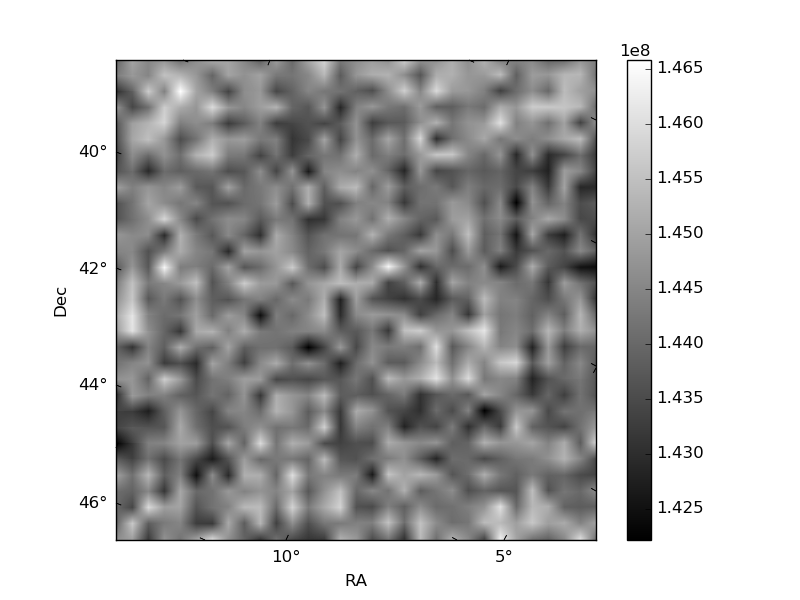
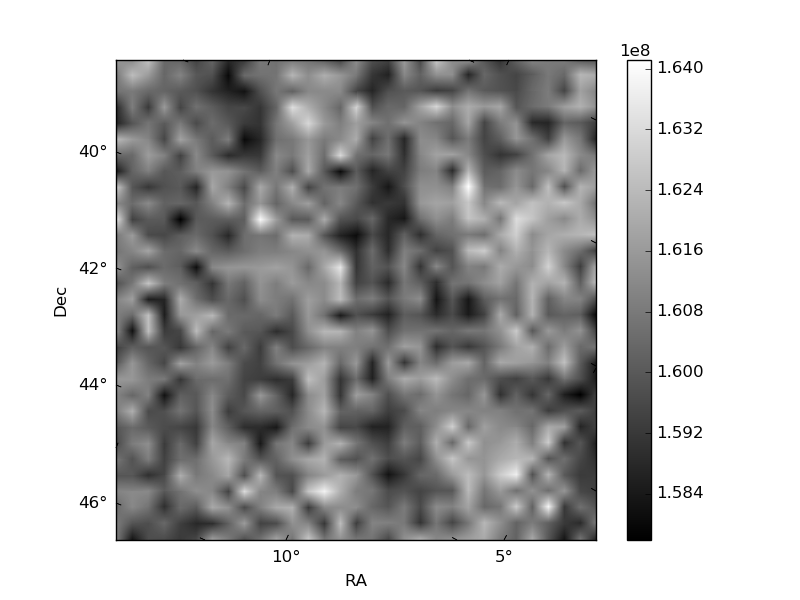
Histogram calculated using DETX and DETY for each event in the final _common_clean file
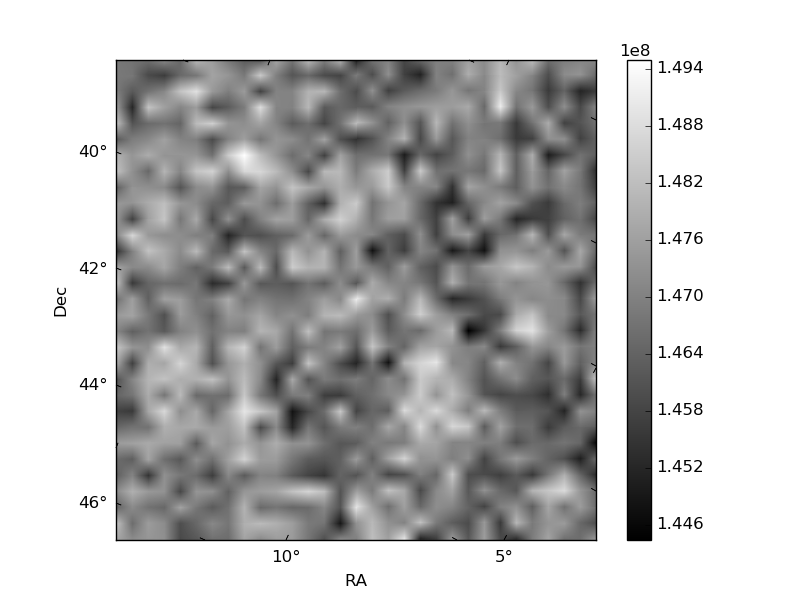
| Quadrant A | 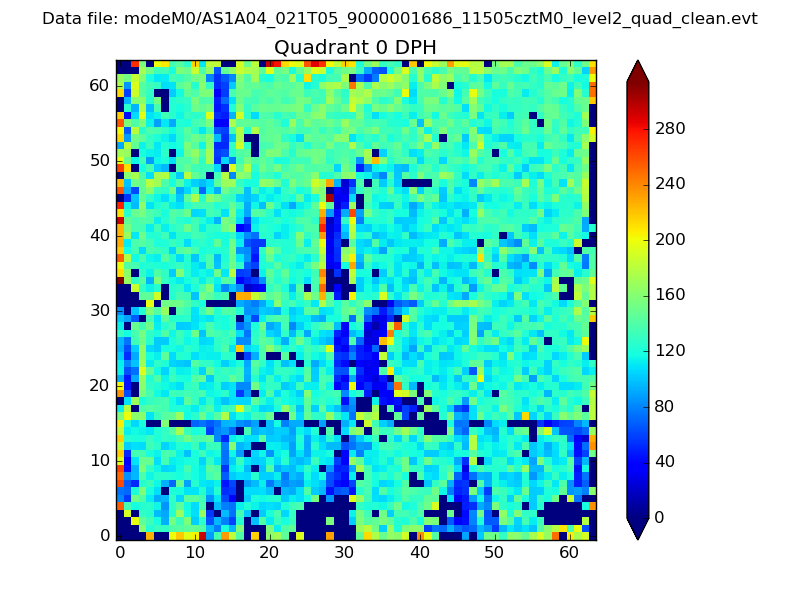 |
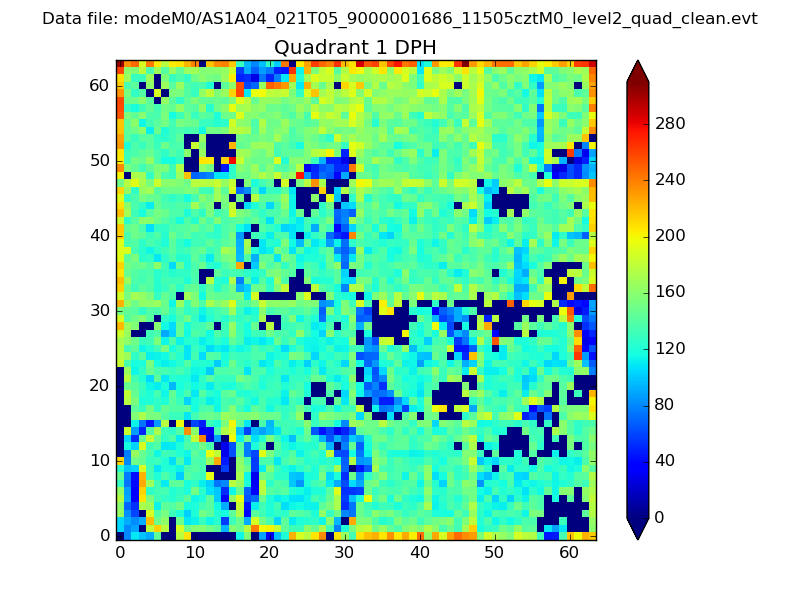 |
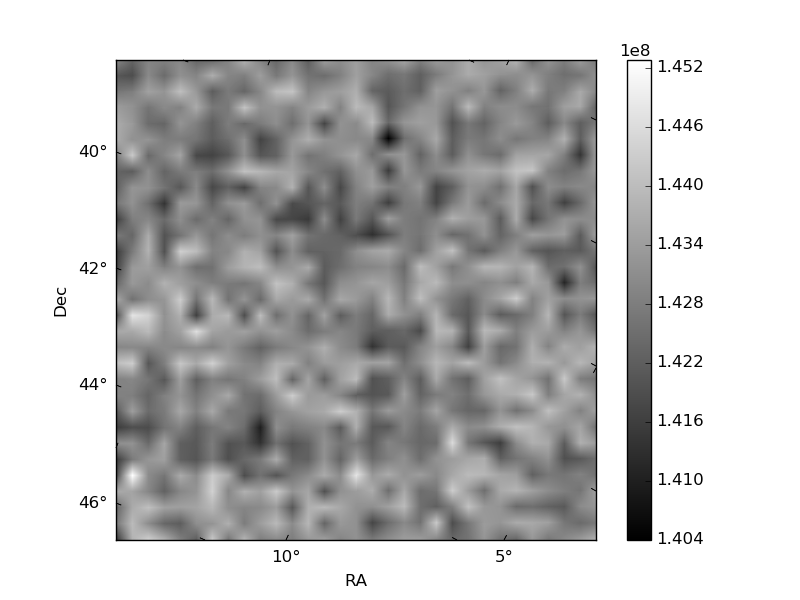
Quadrant B |
|---|---|---|---|
| Quadrant D | 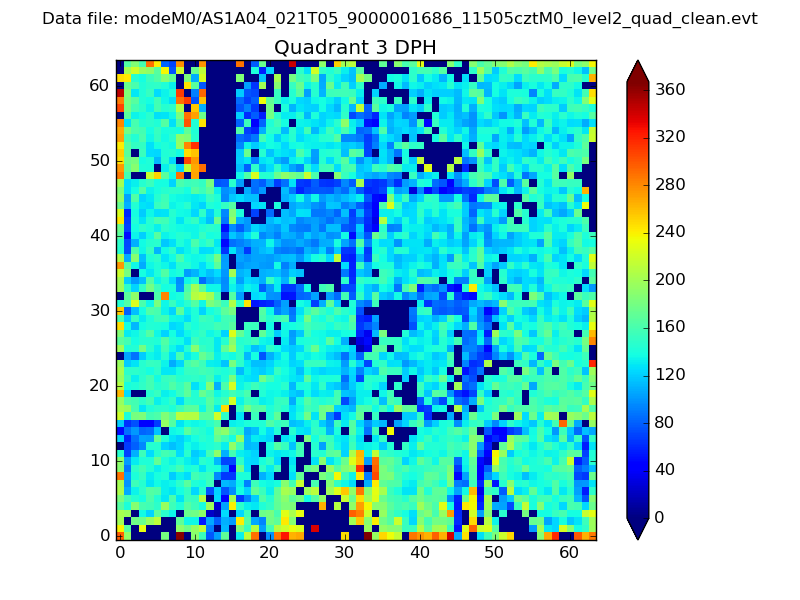 |
 |
Quadrant C |
| Plot type | Count rate plots | Images |
|---|---|---|
| Comparison with Poisson distribution Blue bars denote a histogram of data divided into 1 sec bins. Red curve is a Poisson curve with rate = median count rate of data. |
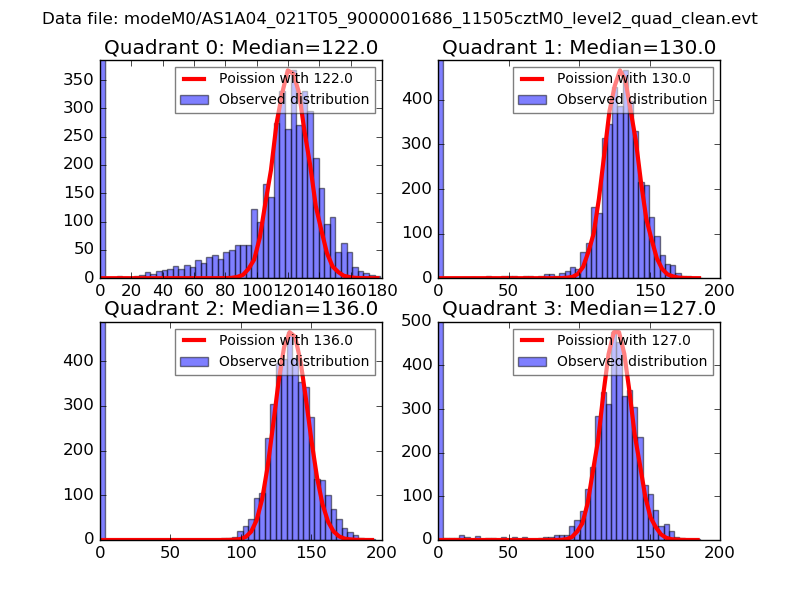 |
 |
| Quadrant-wise count rates Data is divided into 100 sec bins |
 |
|
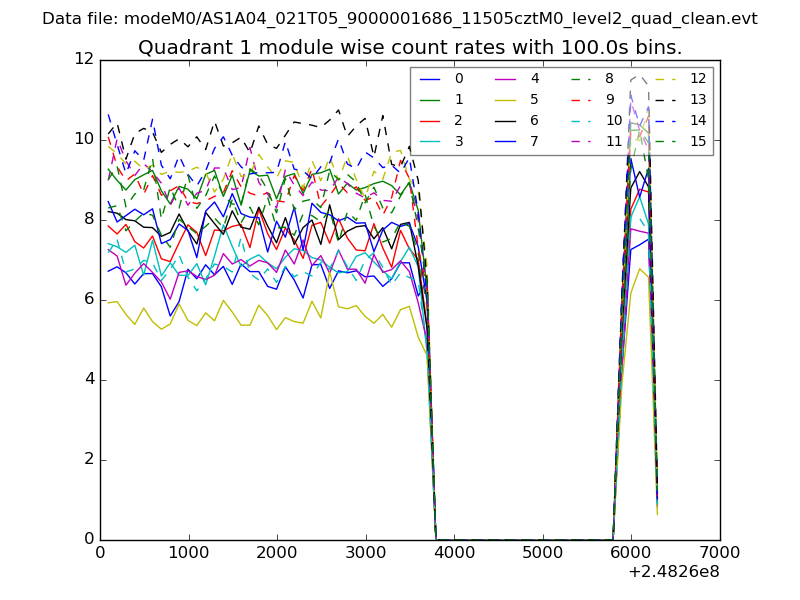
| Module-wise count rates for Quadrant A Data is divided into 100 sec bins |
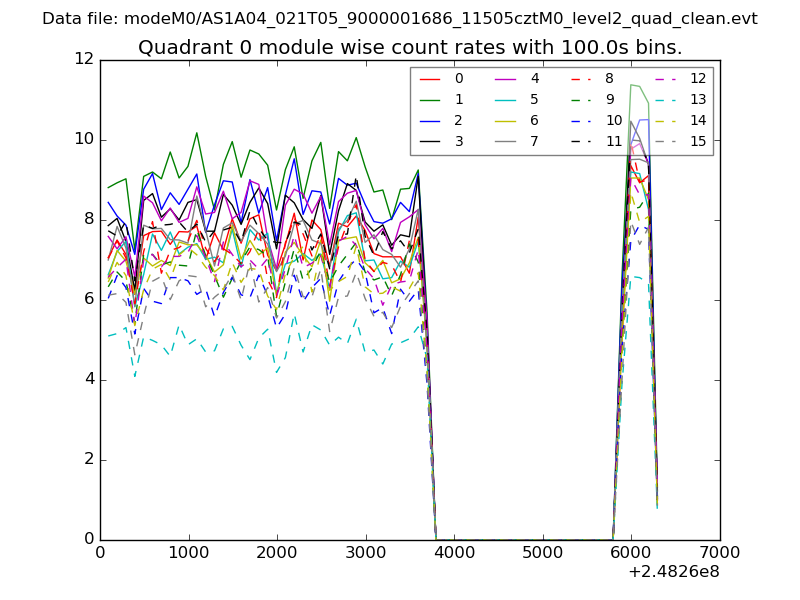 |
 |
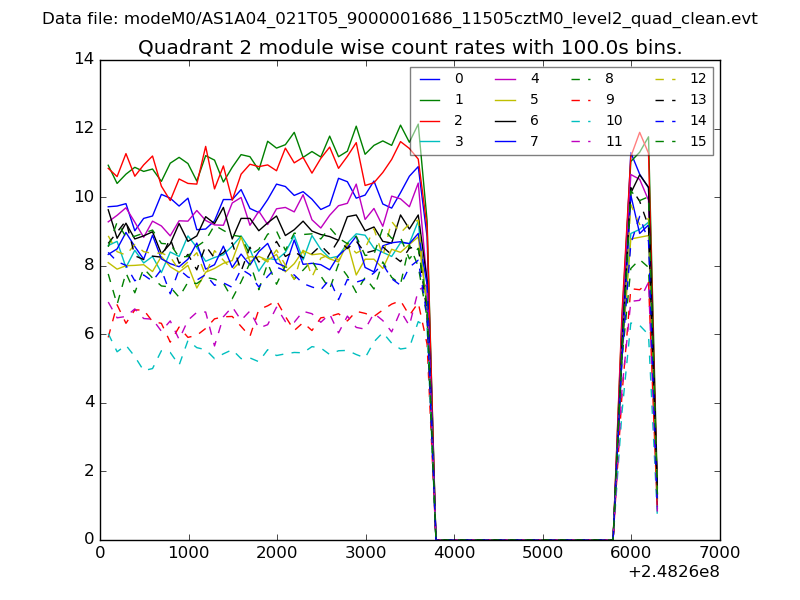
| Module-wise count rates for Quadrant B Data is divided into 100 sec bins |
 |
 |
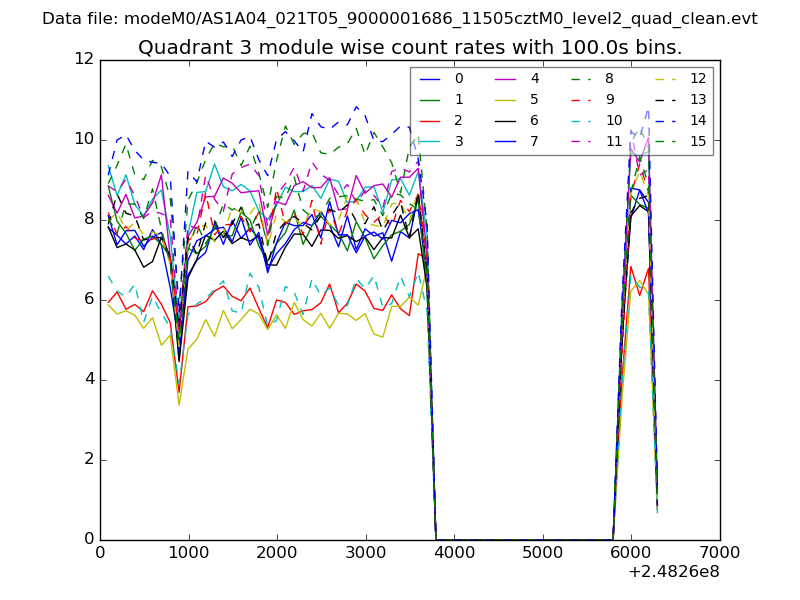
| Module-wise count rates for Quadrant C Data is divided into 100 sec bins |
 |
 |
| Module-wise count rates for Quadrant D Data is divided into 100 sec bins |
 |
 |
| Parameter | Plot |
|---|---|
| CZT HV Monitor | 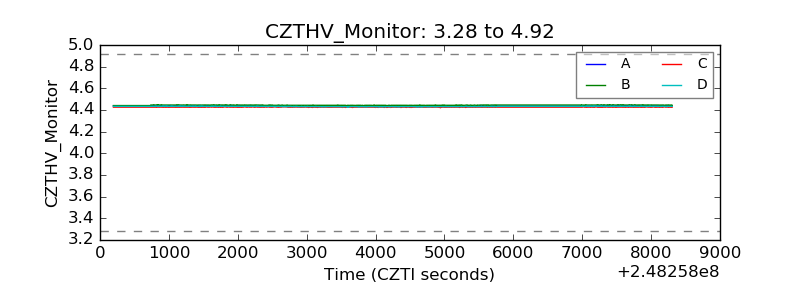 |
| D_VDD | 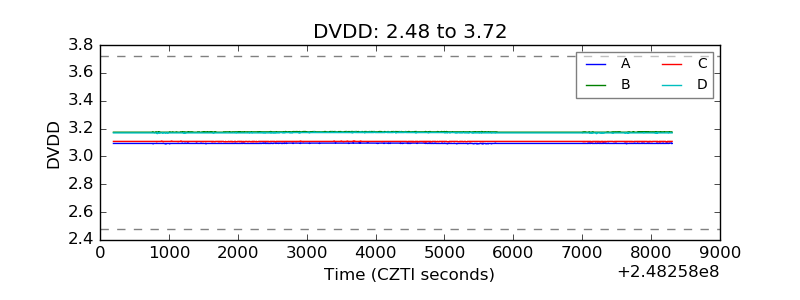 |
| Temperature 1 | 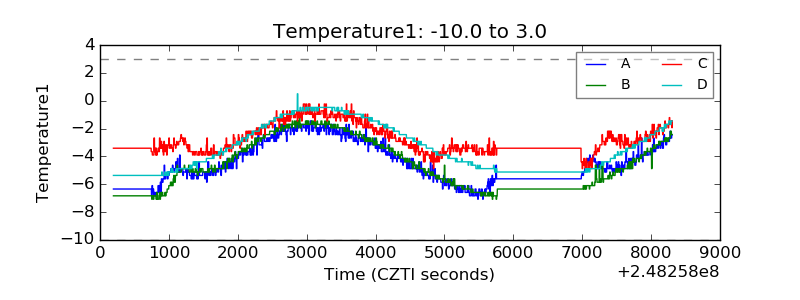 |
| Veto HV Monitor |  |
| Veto LLD | 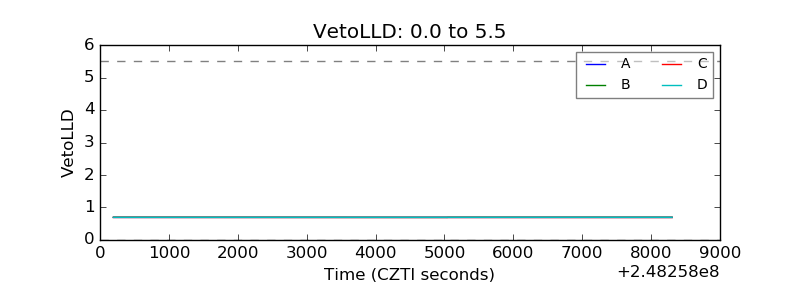 |
| Alpha Counter |  |
| _CPM_Rate | 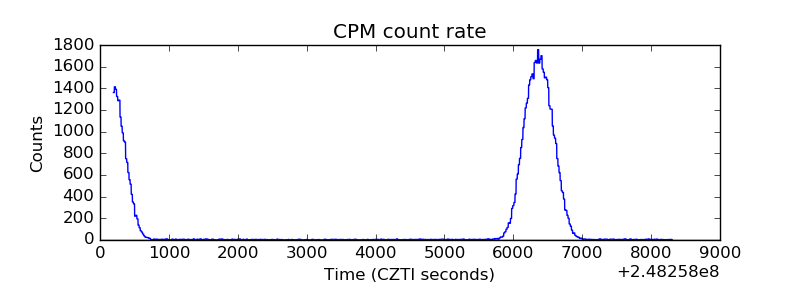 |
| CZT Counter | 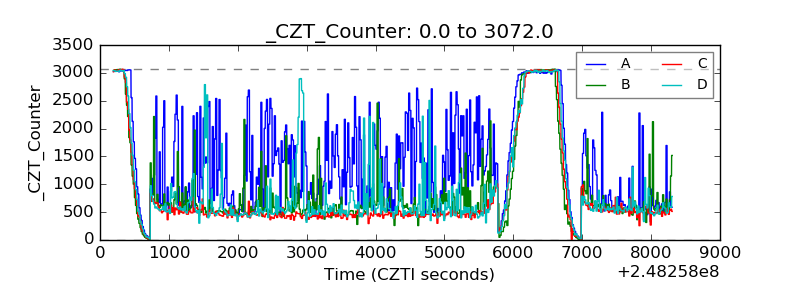 |
| +2.5 Volts monitor |  |
| +5 Volts monitor |  |
| _ROLL_ROT | 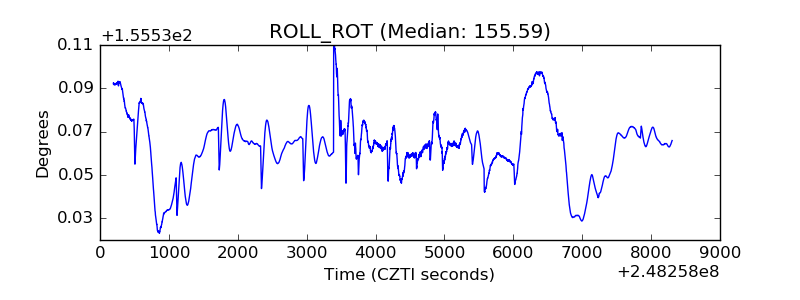 |
| _Roll_DEC | 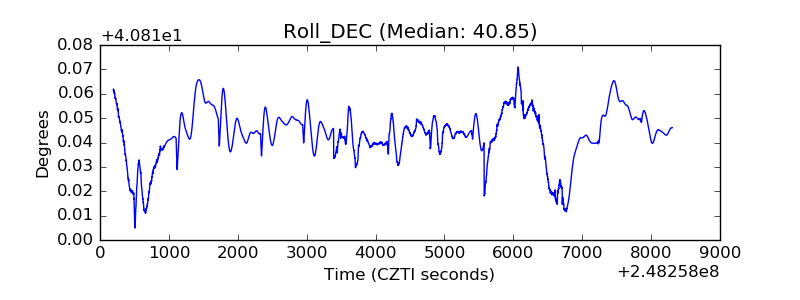 |
| _Roll_RA | 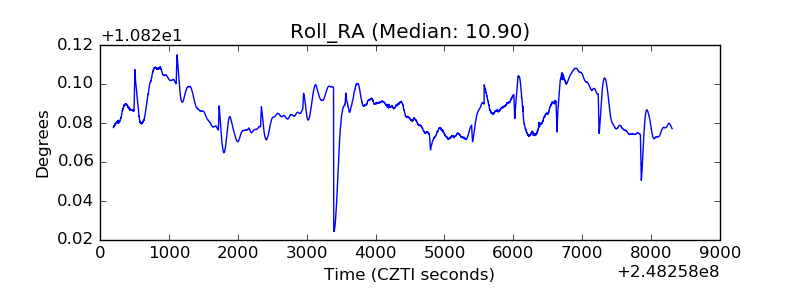 |
| Veto Counter | 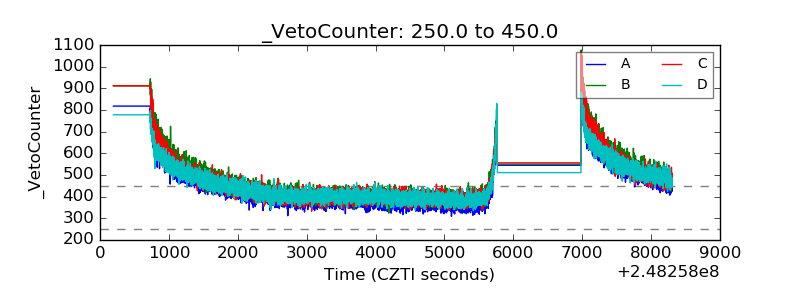 |