| Param | Original file | Final file |
|---|---|---|
| Filename | modeM0/AS1A04_021T05_9000001686_11506cztM0_level2.evt | modeM0/AS1A04_021T05_9000001686_11506cztM0_level2_quad_clean.evt |
| Size (bytes) | 601,588,800 | 95,074,560 |
| Size | 573.7 MB | 90.7 MB |
| Events in quadrant A | 5,392,865 | 597,863 |
| Events in quadrant B | 4,437,535 | 612,935 |
| Events in quadrant C | 3,173,894 | 641,400 |
| Events in quadrant D | 4,788,536 | 587,002 |
| Mode M9 | |||
|---|---|---|---|
| Quadrant | BADHDUFLAG | Total packets | Discarded packets |
| A | 0 | 13 | 0 |
| B | 0 | 13 | 0 |
| C | 0 | 13 | 0 |
| D | 0 | 13 | 0 |
| Mode SS | |||
|---|---|---|---|
| Quadrant | BADHDUFLAG | Total packets | Discarded packets |
| A | 0 | 126 | 0 |
| B | 0 | 126 | 0 |
| C | 0 | 126 | 0 |
| D | 0 | 126 | 0 |
| Mode M0 | |||
|---|---|---|---|
| Quadrant | BADHDUFLAG | Total packets | Discarded packets |
| A | 0 | 20398 | 2 |
| B | 0 | 17270 | 1 |
| C | 0 | 13298 | 1 |
| D | 0 | 18453 | 1 |
| Quadrant | Total seconds | Saturated seconds | Saturation percentage |
|---|---|---|---|
| A | 6309 | 521 | 8.258044% |
| B | 6309 | 352 | 5.579331% |
| C | 6309 | 75 | 1.188778% |
| D | 6309 | 331 | 5.246473% |
Noise dominated data is calculated using 1-second bins in cleaned event files. If a bin has >2000 counts, and if more than 50% of those come from <1% of pixels, then it is considered to be noise-dominated and hence unusable.
| Quadrant | # 1 sec bins | Bins with >0 counts | Bins with >2000 counts | High rate bins dominated by noise | Noise dominated (total time) | Noise dominated (detector-on time) | Marked lightcurve |
|---|---|---|---|---|---|---|---|
| A | 7580 | 6311 | 268 | 268 | 3.54% | 4.25% | 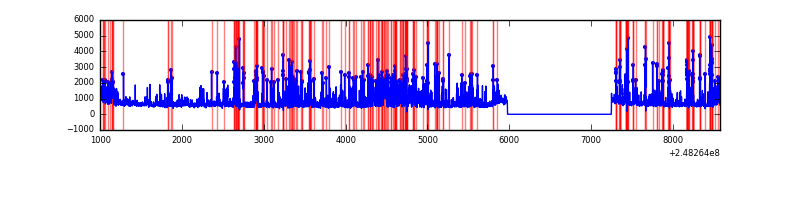 |
| B | 7580 | 6311 | 137 | 137 | 1.81% | 2.17% | 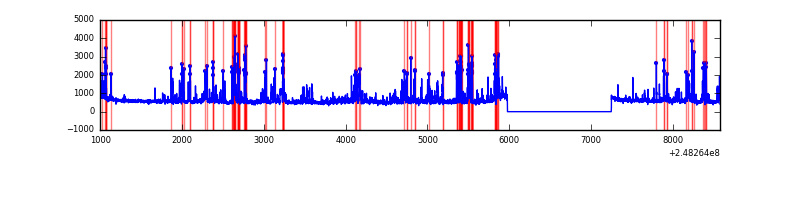 |
| C | 7580 | 6311 | 1 | 1 | 0.01% | 0.02% | 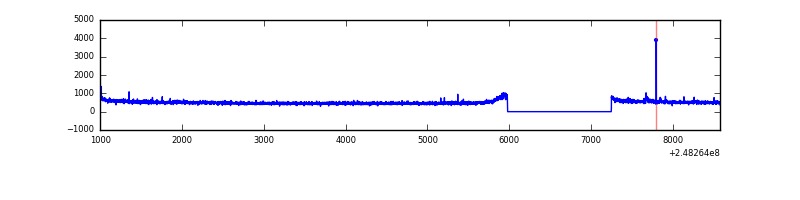 |
| D | 7580 | 6311 | 199 | 199 | 2.63% | 3.15% | 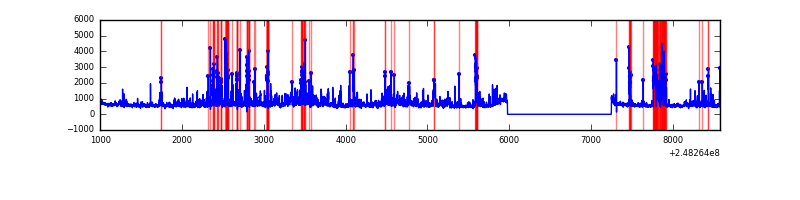 |
Top three noisy pixels from each quadrant. If the there are fewer than three noisy pixels in the level2.evt file, extra rows are filled as -1
| Pixel properties | Quadrant properties | ||||||
|---|---|---|---|---|---|---|---|
| Quadrant | DetID | PixID | Counts | Sigma | Mean | Median | Sigma |
| A | 8 | 5 | 1961536 | 11981.16 | 819 | 806 | 163.7 |
| A | 15 | 223 | 117447 | 712.74 | 819 | 806 | 163.7 |
| A | 15 | 239 | 51593 | 310.34 | 819 | 806 | 163.7 |
| B | 4 | 239 | 921143 | 6030.41 | 817 | 799 | 152.6 |
| B | 11 | 51 | 112141 | 729.55 | 817 | 799 | 152.6 |
| B | 15 | 204 | 105842 | 688.28 | 817 | 799 | 152.6 |
| C | 12 | 4 | 17953 | 92.75 | 808 | 816 | 184.8 |
| C | 14 | 234 | 7364 | 35.44 | 808 | 816 | 184.8 |
| C | 13 | 61 | 5854 | 27.27 | 808 | 816 | 184.8 |
| D | 1 | 52 | 854984 | 4590.31 | 797 | 778 | 186.1 |
| D | 2 | 120 | 227574 | 1218.75 | 797 | 778 | 186.1 |
| D | 8 | 195 | 226022 | 1210.41 | 797 | 778 | 186.1 |
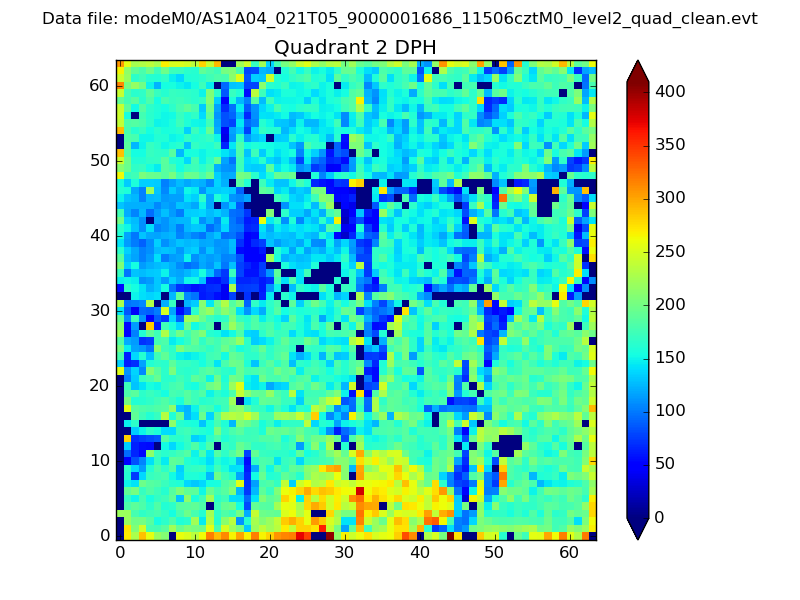
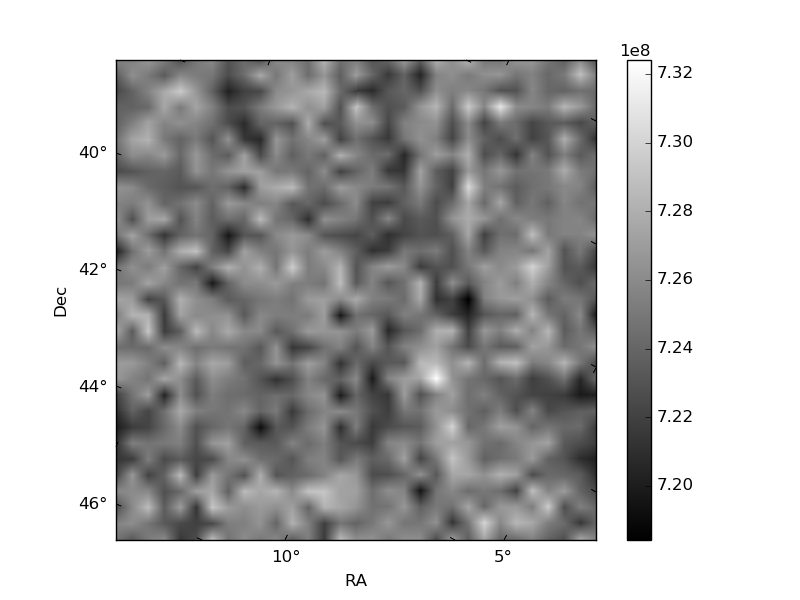
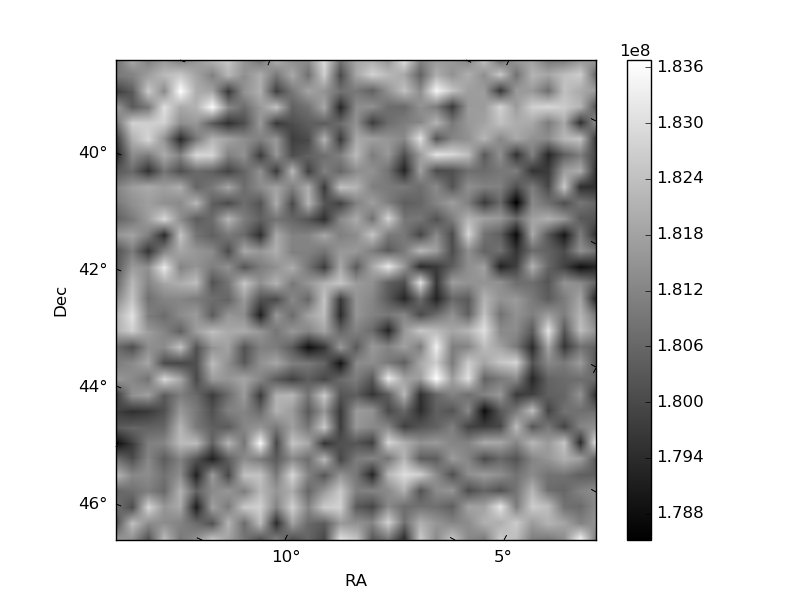
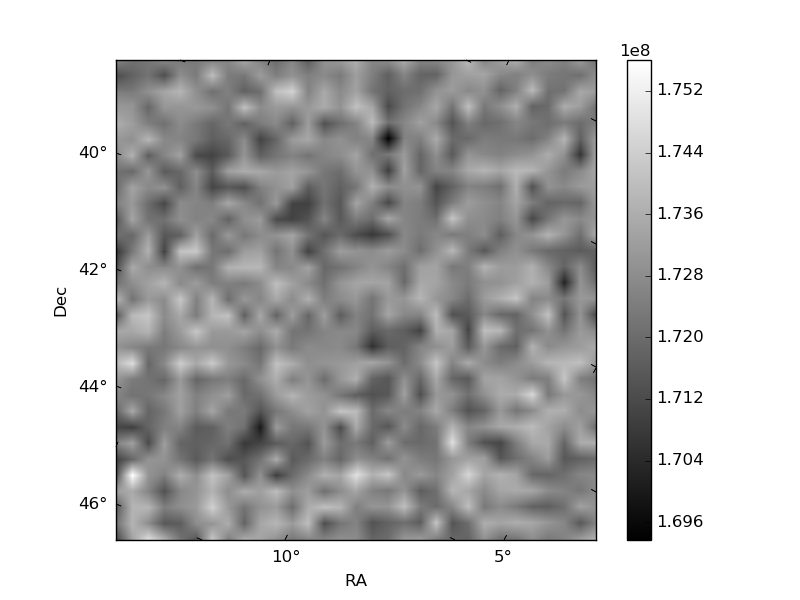
Histogram calculated using DETX and DETY for each event in the final _common_clean file
| Quadrant A | 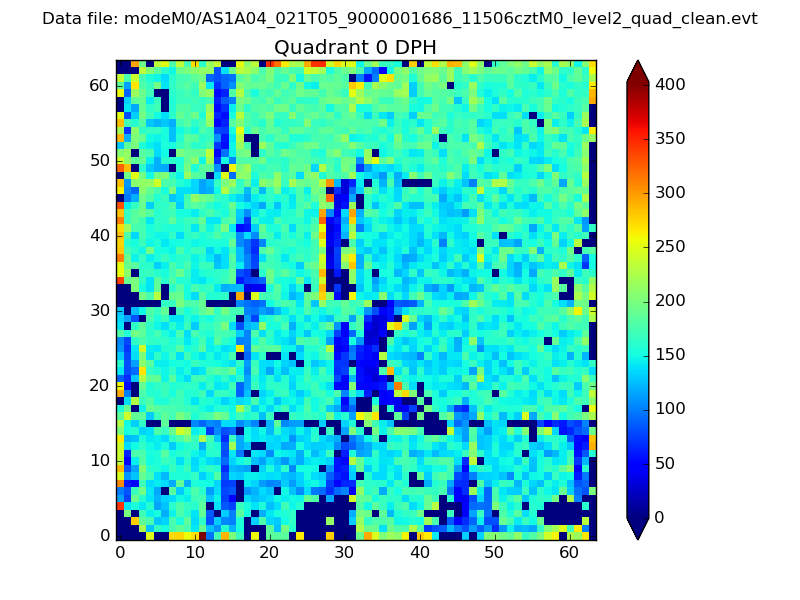 |
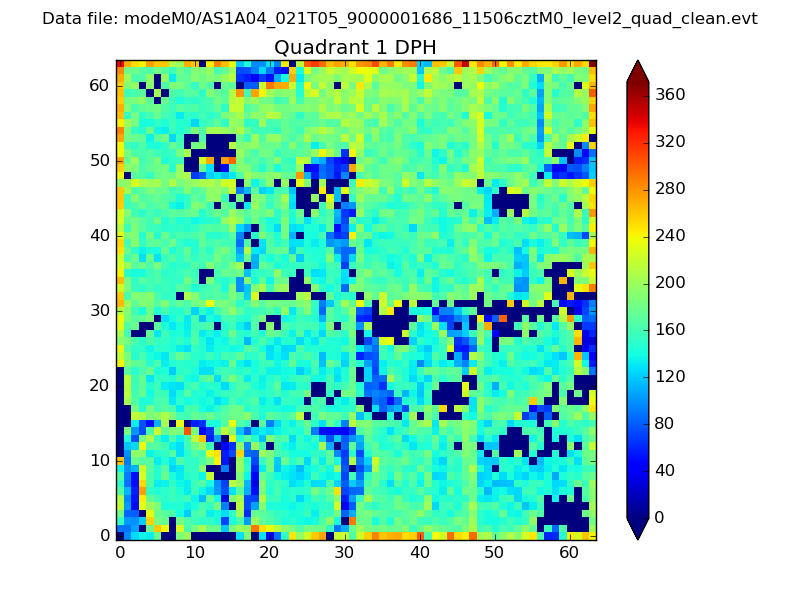 |
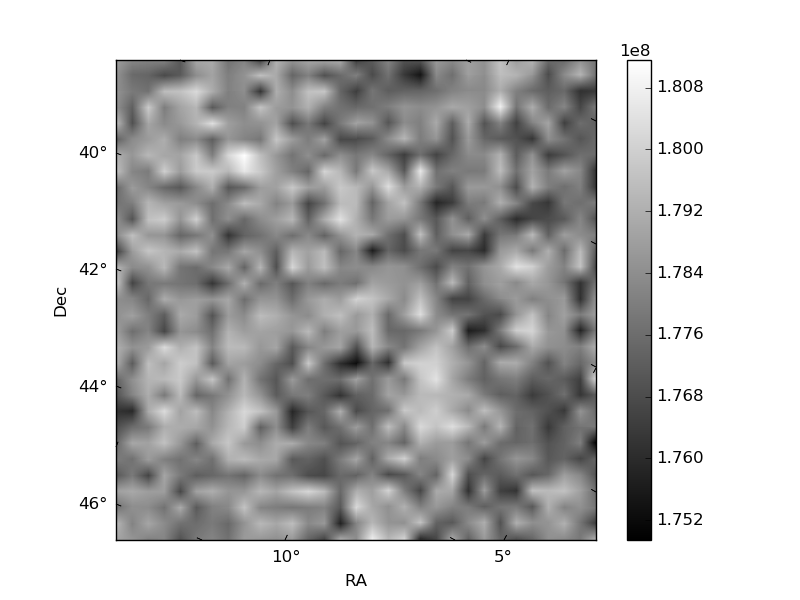
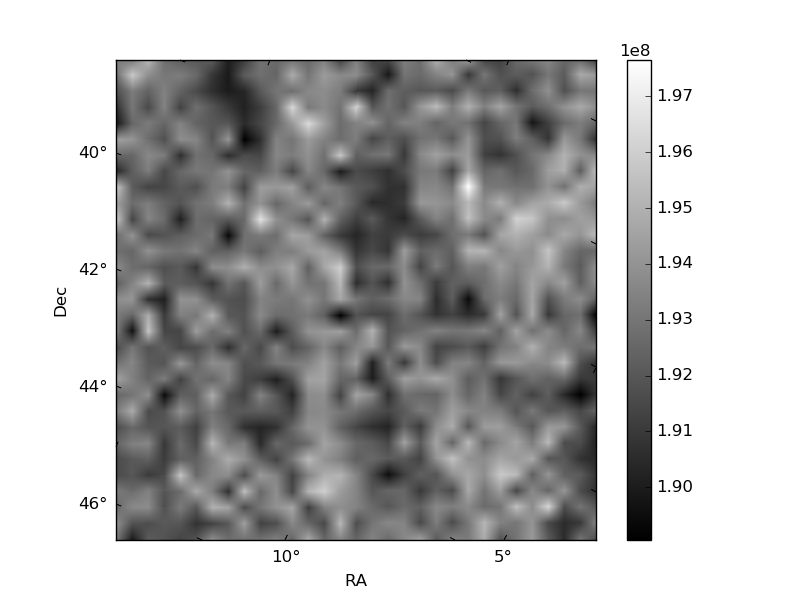
Quadrant B |
|---|---|---|---|
| Quadrant D | 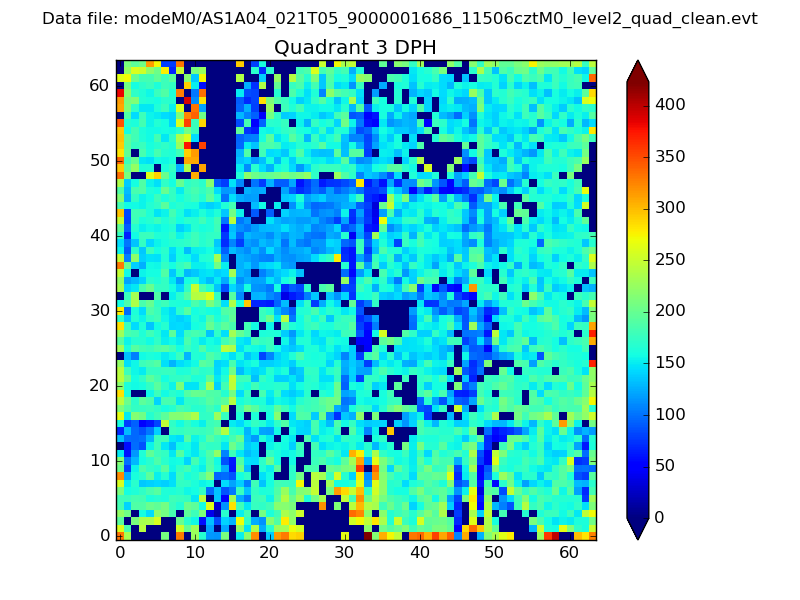 |
 |
Quadrant C |
| Plot type | Count rate plots | Images |
|---|---|---|
| Comparison with Poisson distribution Blue bars denote a histogram of data divided into 1 sec bins. Red curve is a Poisson curve with rate = median count rate of data. |
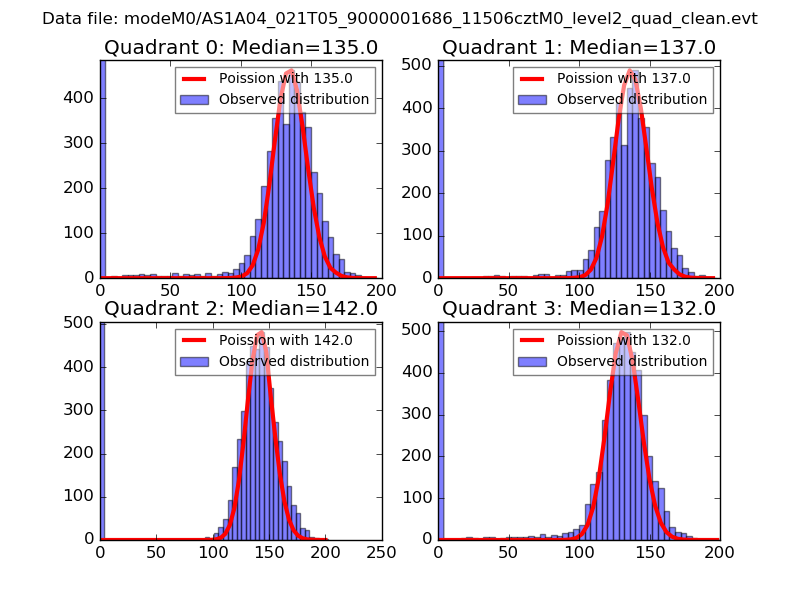 |
 |
| Quadrant-wise count rates Data is divided into 100 sec bins |
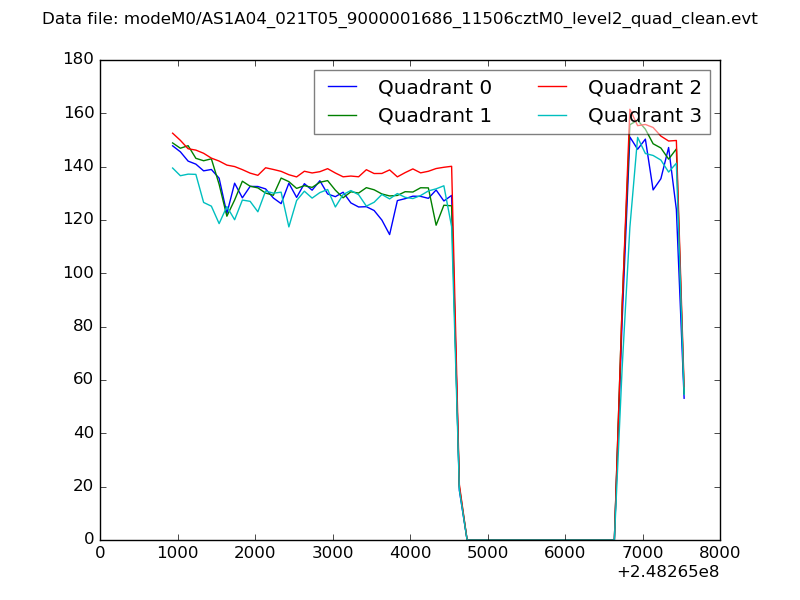 |
|
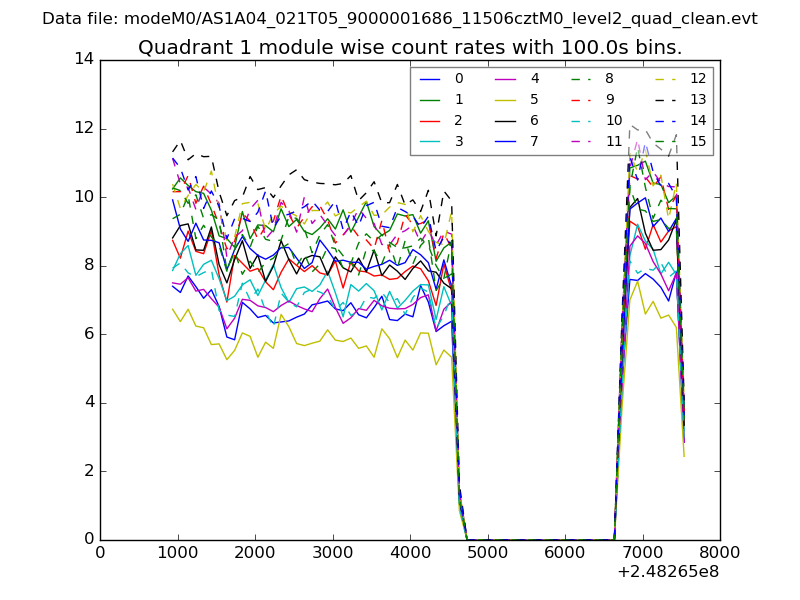
| Module-wise count rates for Quadrant A Data is divided into 100 sec bins |
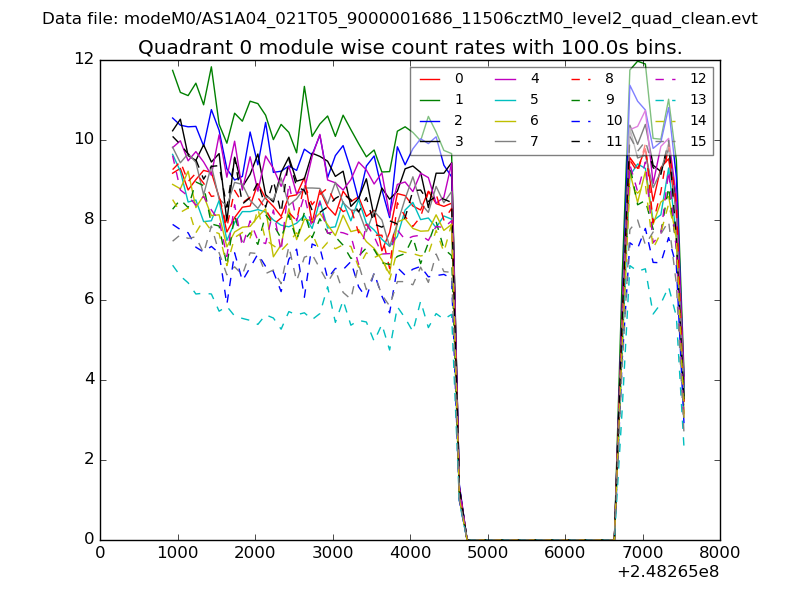 |
 |
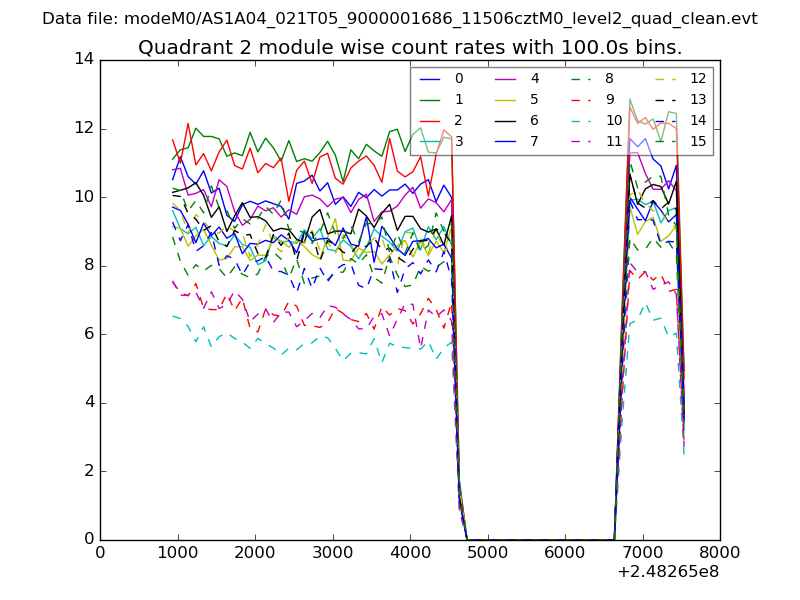
| Module-wise count rates for Quadrant B Data is divided into 100 sec bins |
 |
 |
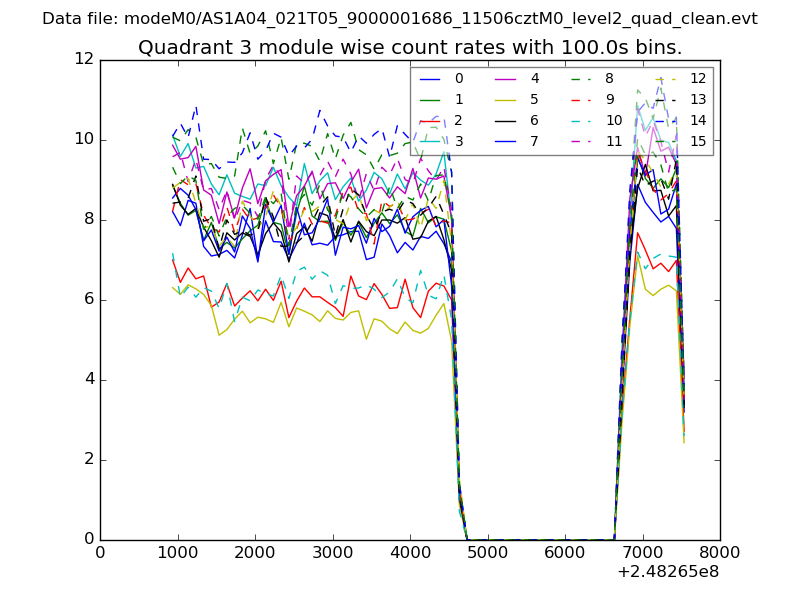
| Module-wise count rates for Quadrant C Data is divided into 100 sec bins |
 |
 |
| Module-wise count rates for Quadrant D Data is divided into 100 sec bins |
 |
 |
| Parameter | Plot |
|---|---|
| CZT HV Monitor | 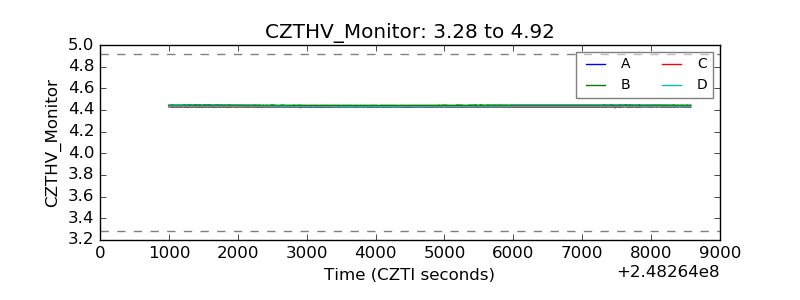 |
| D_VDD | 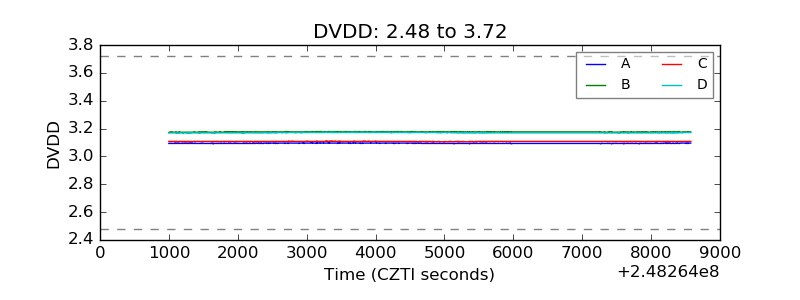 |
| Temperature 1 | 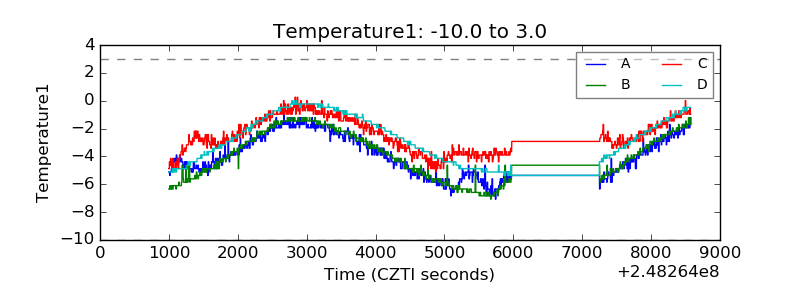 |
| Veto HV Monitor | 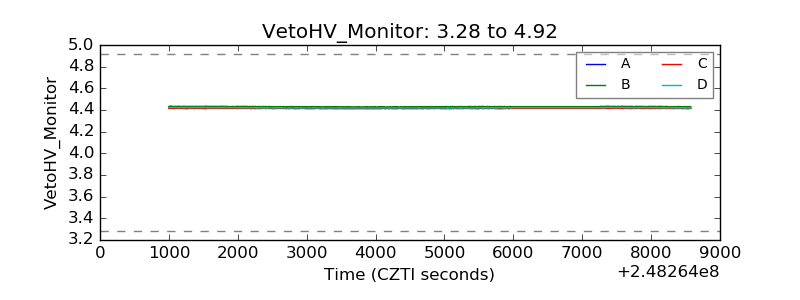 |
| Veto LLD | 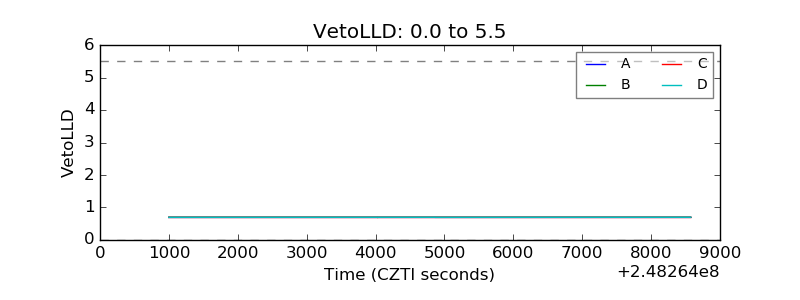 |
| Alpha Counter | 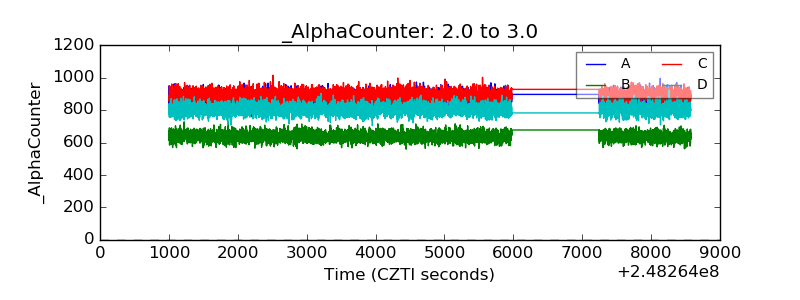 |
| _CPM_Rate | 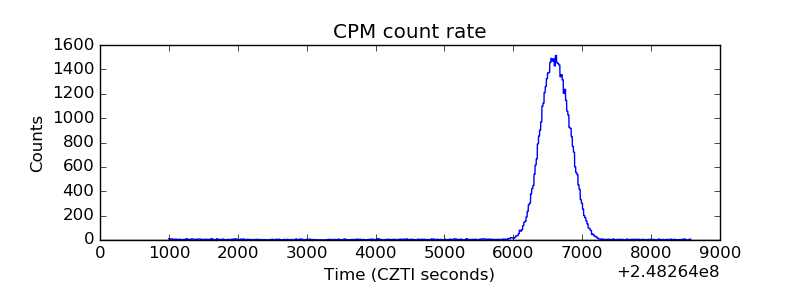 |
| CZT Counter | 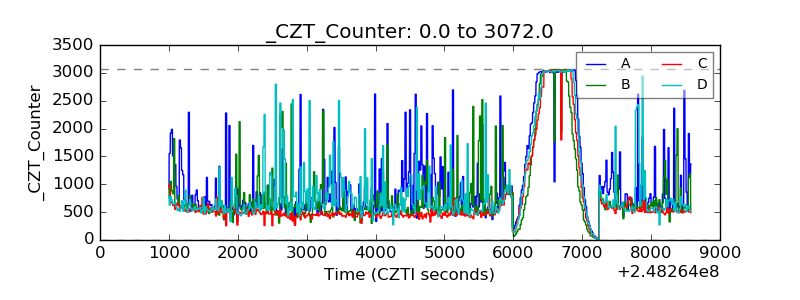 |
| +2.5 Volts monitor |  |
| +5 Volts monitor |  |
| _ROLL_ROT | 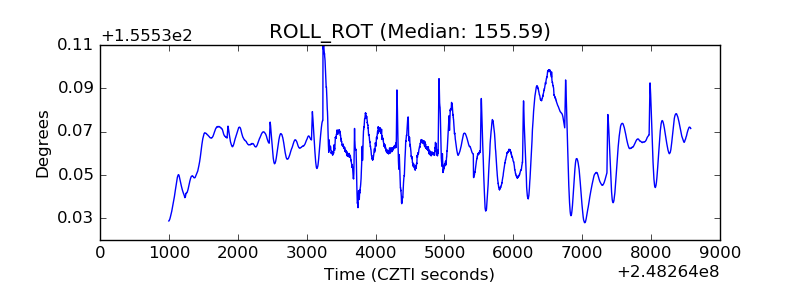 |
| _Roll_DEC | 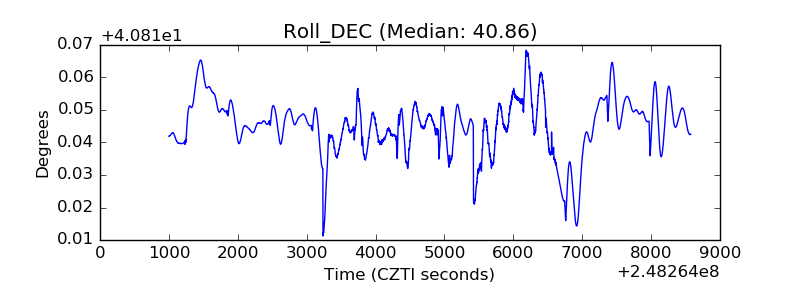 |
| _Roll_RA | 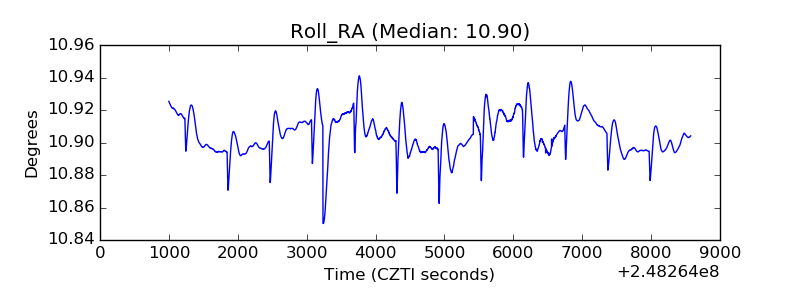 |
| Veto Counter | 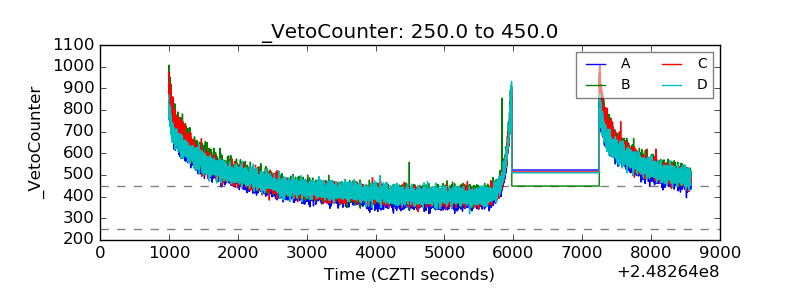 |