| Param | Original file | Final file |
|---|---|---|
| Filename | modeM0/AS1A04_021T05_9000001686_11507cztM0_level2.evt | modeM0/AS1A04_021T05_9000001686_11507cztM0_level2_quad_clean.evt |
| Size (bytes) | 589,743,360 | 104,132,160 |
| Size | 562.4 MB | 99.3 MB |
| Events in quadrant A | 5,163,085 | 673,278 |
| Events in quadrant B | 4,568,715 | 669,921 |
| Events in quadrant C | 2,873,566 | 727,493 |
| Events in quadrant D | 4,856,038 | 670,660 |
| Mode M9 | |||
|---|---|---|---|
| Quadrant | BADHDUFLAG | Total packets | Discarded packets |
| A | 0 | 13 | 0 |
| B | 0 | 13 | 0 |
| C | 0 | 13 | 0 |
| D | 0 | 13 | 0 |
| Mode SS | |||
|---|---|---|---|
| Quadrant | BADHDUFLAG | Total packets | Discarded packets |
| A | 0 | 120 | 0 |
| B | 0 | 120 | 0 |
| C | 0 | 120 | 0 |
| D | 0 | 120 | 0 |
| Mode M0 | |||
|---|---|---|---|
| Quadrant | BADHDUFLAG | Total packets | Discarded packets |
| A | 0 | 19414 | 2 |
| B | 0 | 17428 | 1 |
| C | 0 | 12173 | 1 |
| D | 0 | 18418 | 1 |
| Quadrant | Total seconds | Saturated seconds | Saturation percentage |
|---|---|---|---|
| A | 5895 | 596 | 10.110263% |
| B | 5895 | 622 | 10.551315% |
| C | 5895 | 78 | 1.323155% |
| D | 5895 | 374 | 6.344360% |
Noise dominated data is calculated using 1-second bins in cleaned event files. If a bin has >2000 counts, and if more than 50% of those come from <1% of pixels, then it is considered to be noise-dominated and hence unusable.
| Quadrant | # 1 sec bins | Bins with >0 counts | Bins with >2000 counts | High rate bins dominated by noise | Noise dominated (total time) | Noise dominated (detector-on time) | Marked lightcurve |
|---|---|---|---|---|---|---|---|
| A | 7186 | 5897 | 341 | 341 | 4.75% | 5.78% | 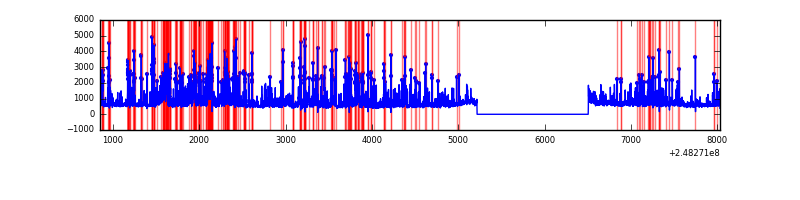 |
| B | 7186 | 5897 | 284 | 284 | 3.95% | 4.82% | 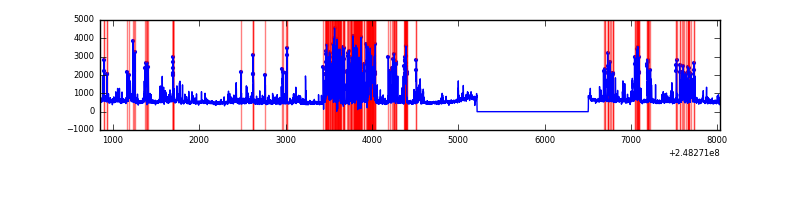 |
| C | 7186 | 5897 | 0 | 0 | 0.00% | 0.00% | 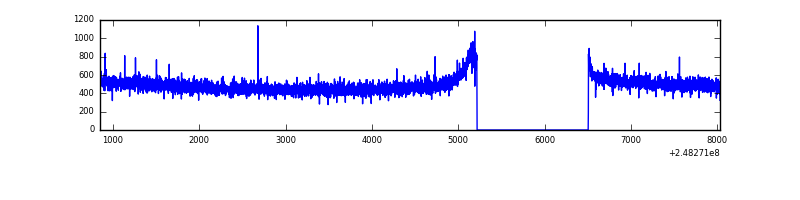 |
| D | 7186 | 5897 | 247 | 247 | 3.44% | 4.19% | 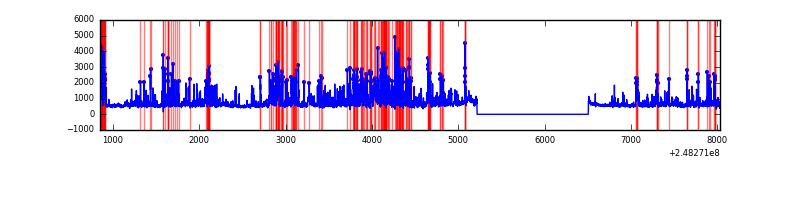 |
Top three noisy pixels from each quadrant. If the there are fewer than three noisy pixels in the level2.evt file, extra rows are filled as -1
| Pixel properties | Quadrant properties | ||||||
|---|---|---|---|---|---|---|---|
| Quadrant | DetID | PixID | Counts | Sigma | Mean | Median | Sigma |
| A | 8 | 5 | 1933315 | 13208.41 | 732 | 720 | 146.3 |
| A | 15 | 223 | 214683 | 1462.34 | 732 | 720 | 146.3 |
| A | 15 | 239 | 87232 | 591.27 | 732 | 720 | 146.3 |
| B | 4 | 239 | 737801 | 5469.88 | 716 | 699 | 134.8 |
| B | 3 | 64 | 710163 | 5264.79 | 716 | 699 | 134.8 |
| B | 11 | 51 | 181130 | 1338.94 | 716 | 699 | 134.8 |
| C | 13 | 61 | 5445 | 27.72 | 736 | 743 | 169.6 |
| C | 12 | 4 | 2865 | 12.51 | 736 | 743 | 169.6 |
| C | 3 | 202 | 1852 | 6.54 | 736 | 743 | 169.6 |
| D | 6 | 219 | 695157 | 4012.83 | 728 | 710 | 173.1 |
| D | 1 | 52 | 656825 | 3791.33 | 728 | 710 | 173.1 |
| D | 8 | 195 | 260183 | 1499.35 | 728 | 710 | 173.1 |
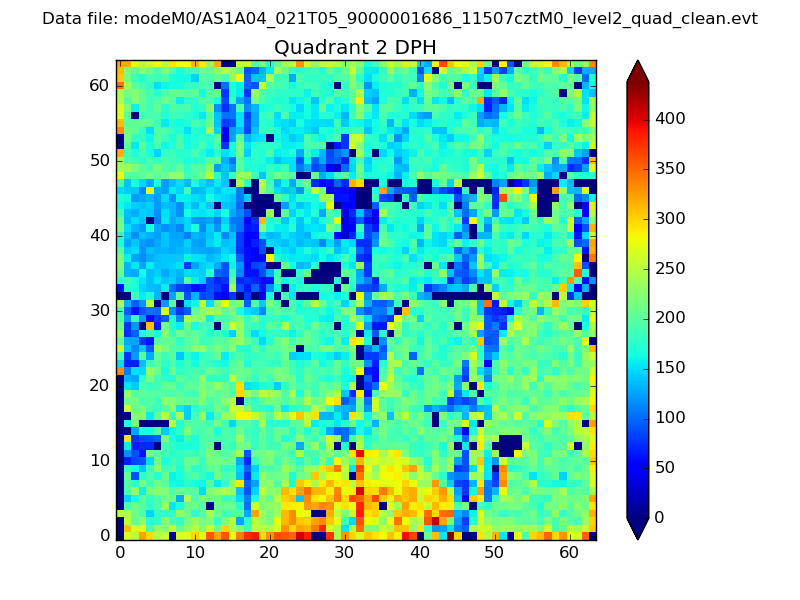
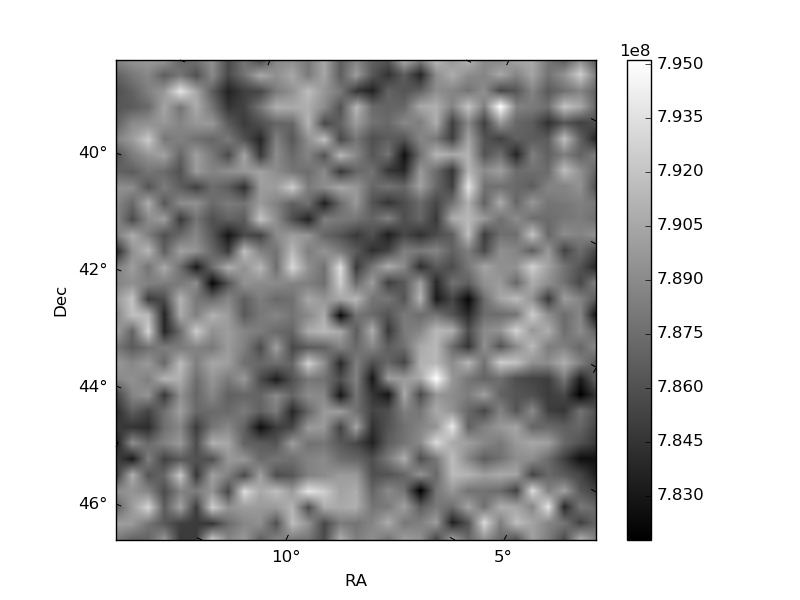
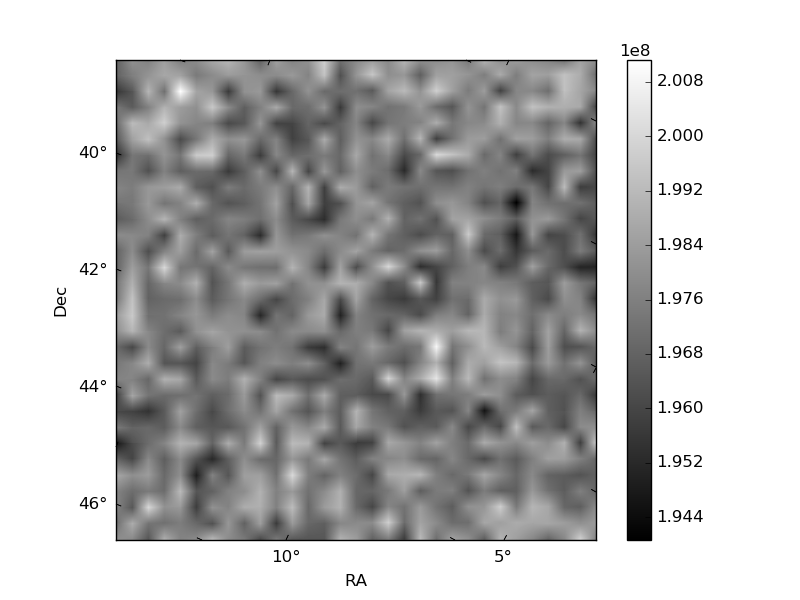
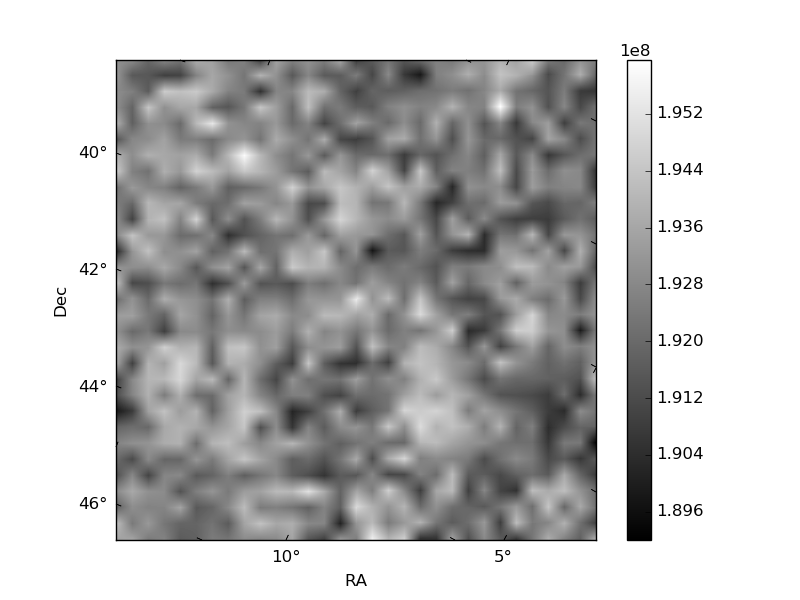
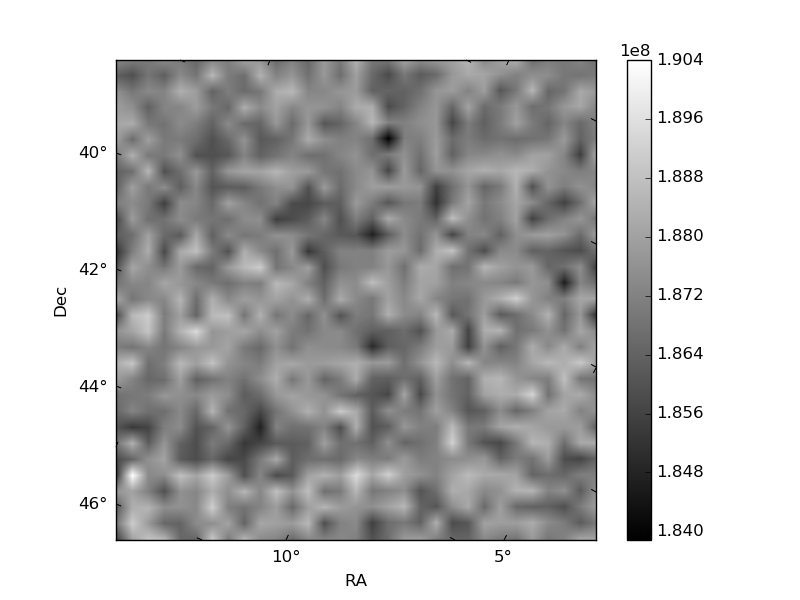
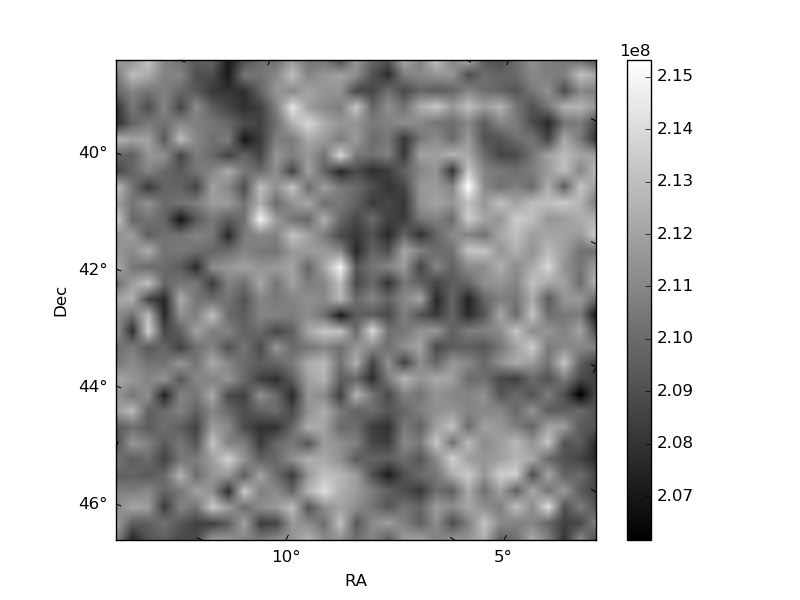
Histogram calculated using DETX and DETY for each event in the final _common_clean file
| Quadrant A | 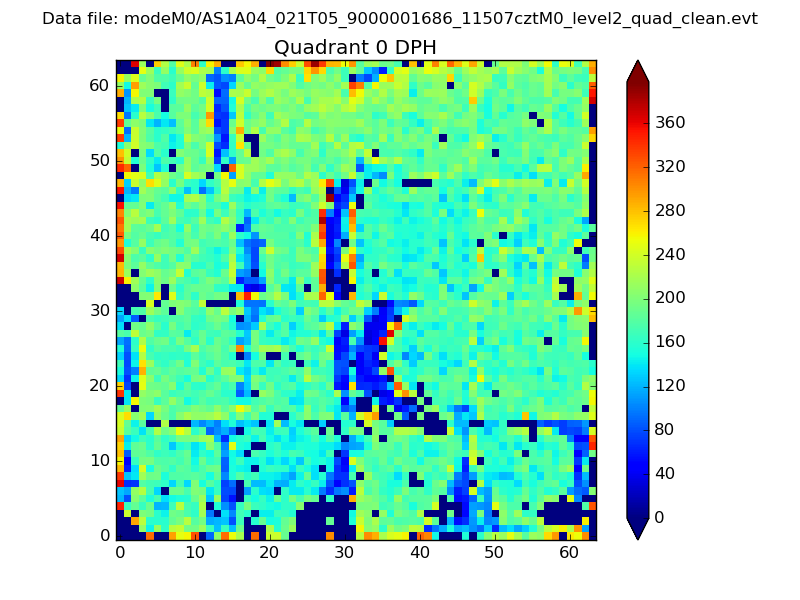 |
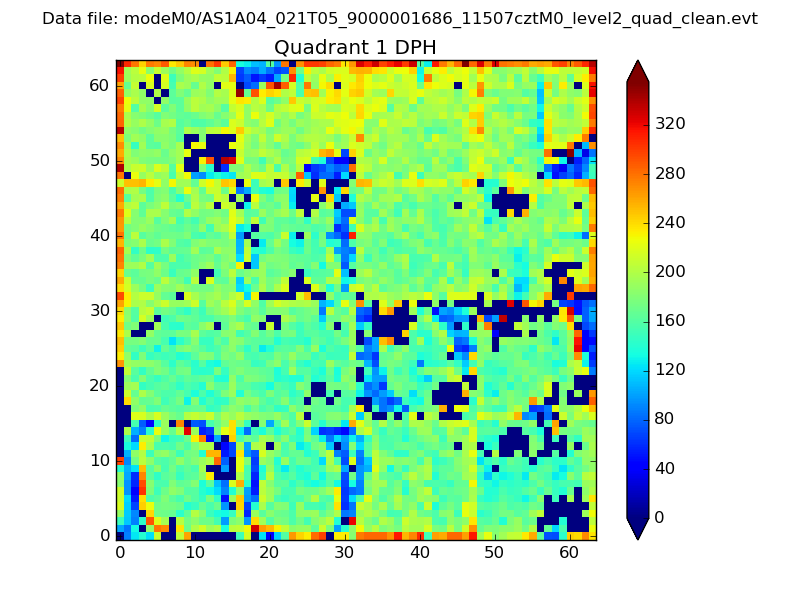 |
Quadrant B |
|---|---|---|---|
| Quadrant D | 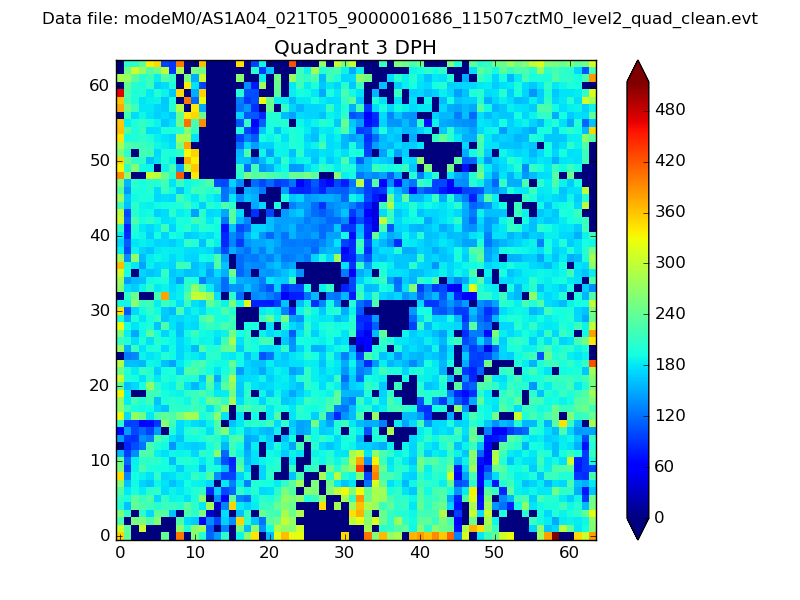 |
 |
Quadrant C |
| Plot type | Count rate plots | Images |
|---|---|---|
| Comparison with Poisson distribution Blue bars denote a histogram of data divided into 1 sec bins. Red curve is a Poisson curve with rate = median count rate of data. |
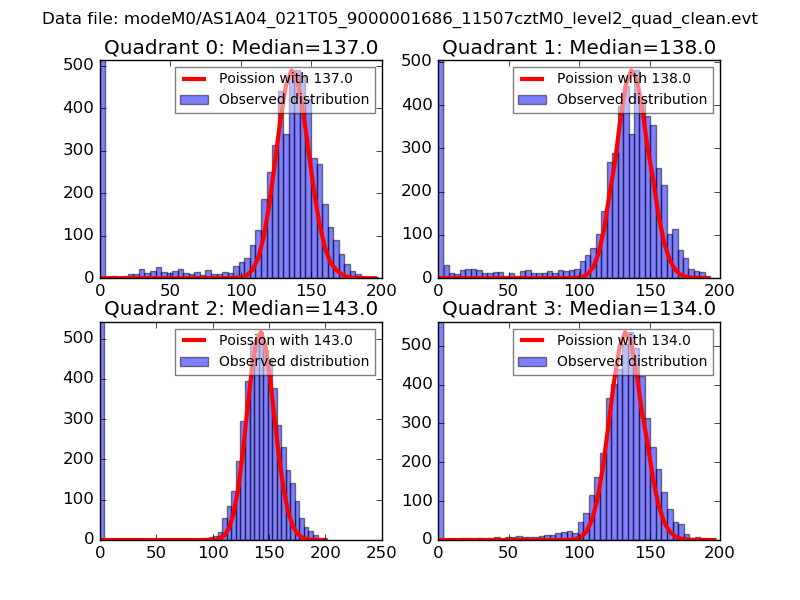 |
 |
| Quadrant-wise count rates Data is divided into 100 sec bins |
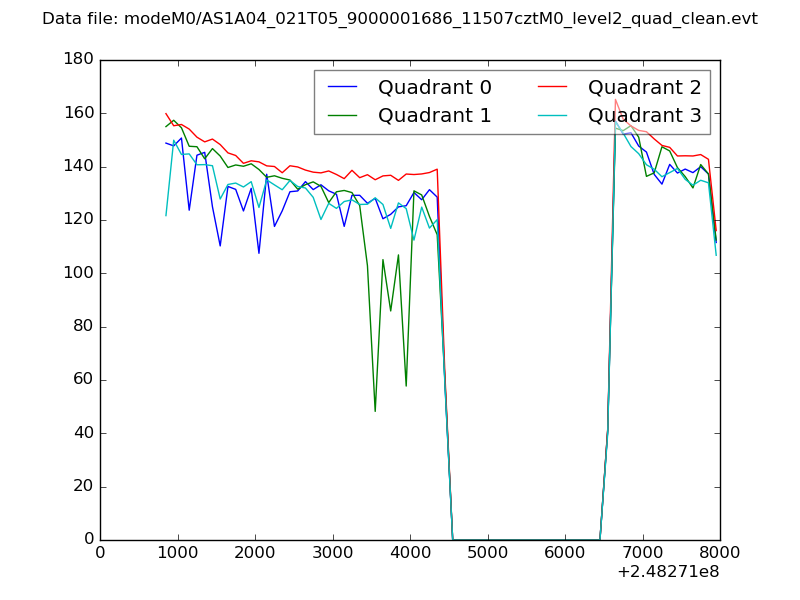 |
|
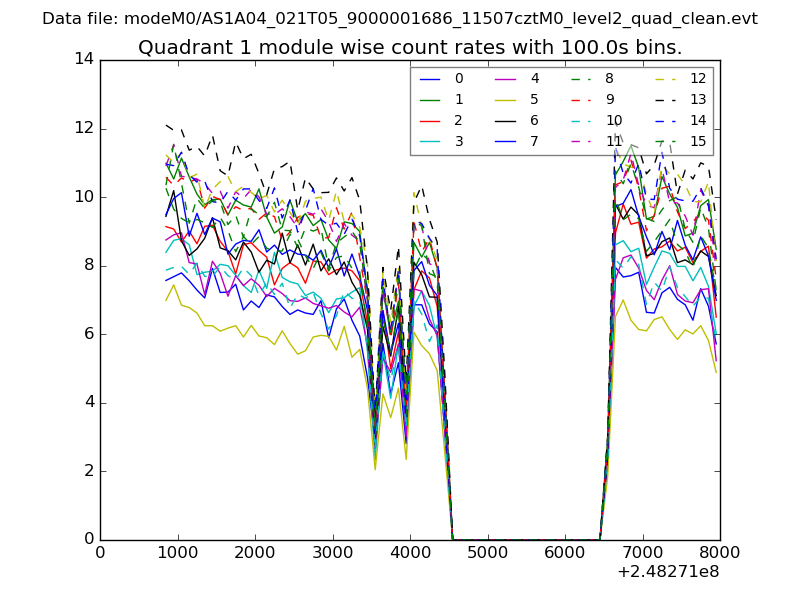
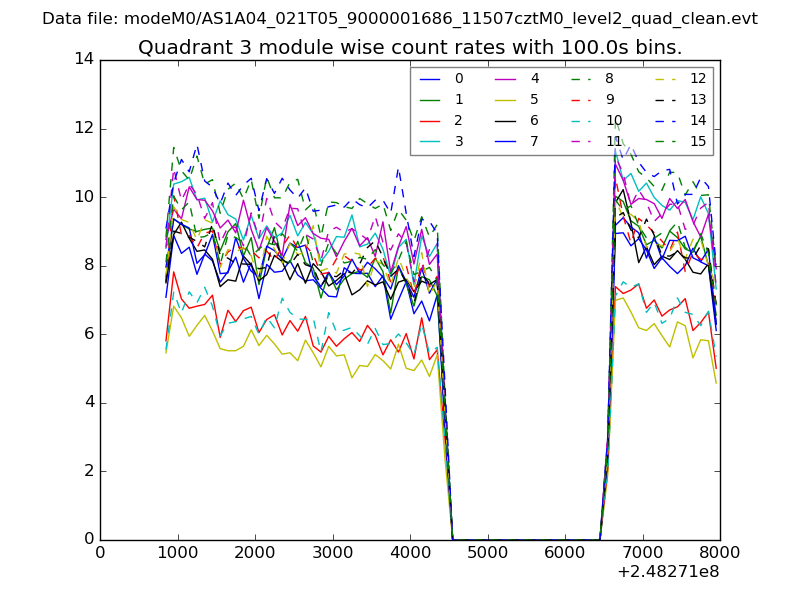
| Module-wise count rates for Quadrant A Data is divided into 100 sec bins |
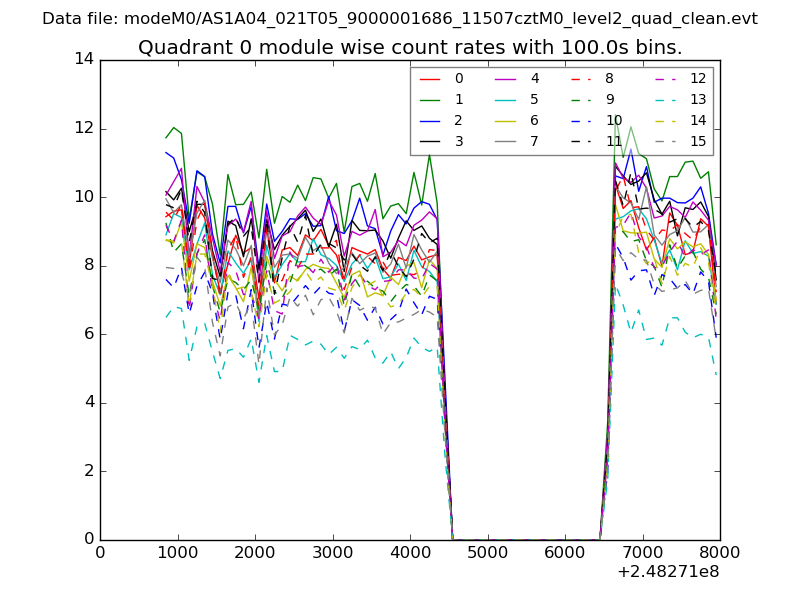 |
 |
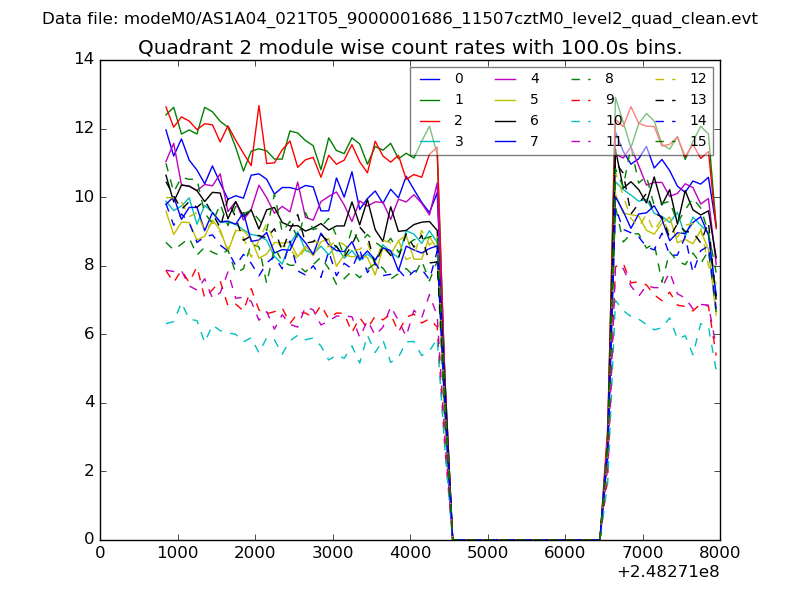
| Module-wise count rates for Quadrant B Data is divided into 100 sec bins |
 |
 |
| Module-wise count rates for Quadrant C Data is divided into 100 sec bins |
 |
 |
| Module-wise count rates for Quadrant D Data is divided into 100 sec bins |
 |
 |
| Parameter | Plot |
|---|---|
| CZT HV Monitor | 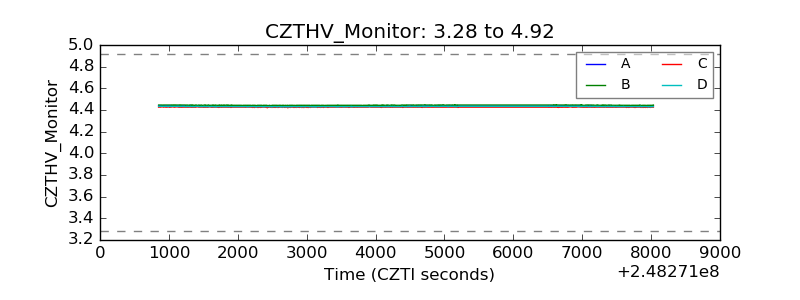 |
| D_VDD | 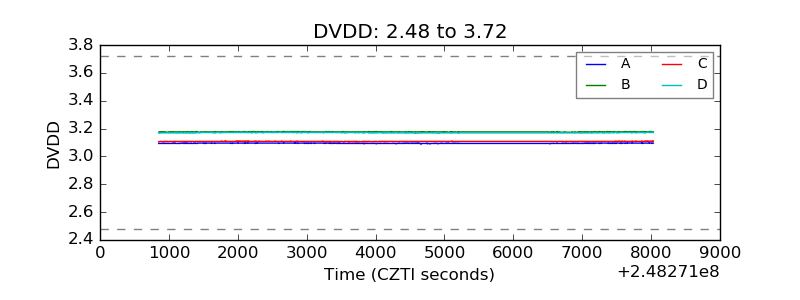 |
| Temperature 1 | 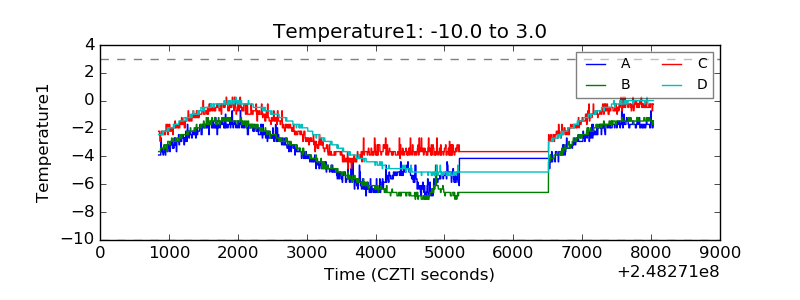 |
| Veto HV Monitor | 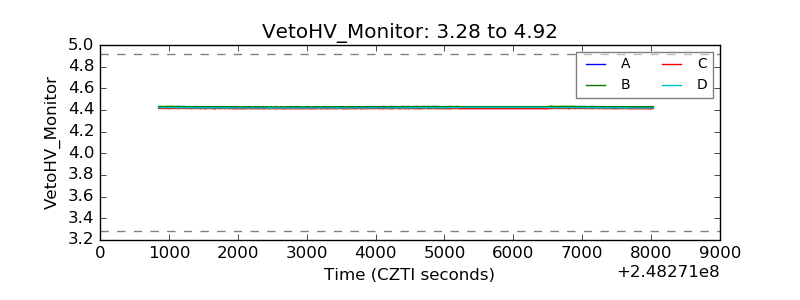 |
| Veto LLD | 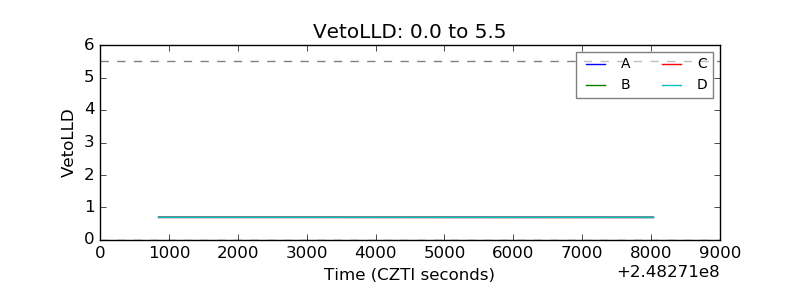 |
| Alpha Counter | 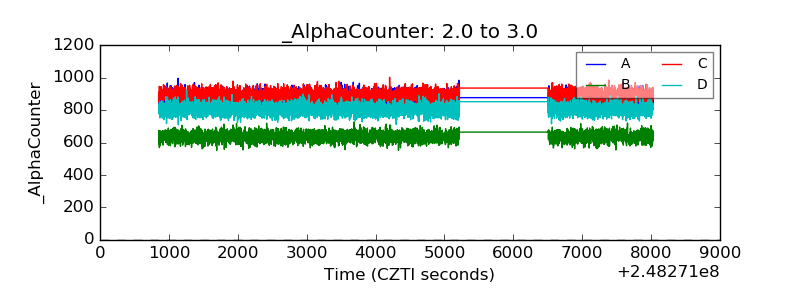 |
| _CPM_Rate | 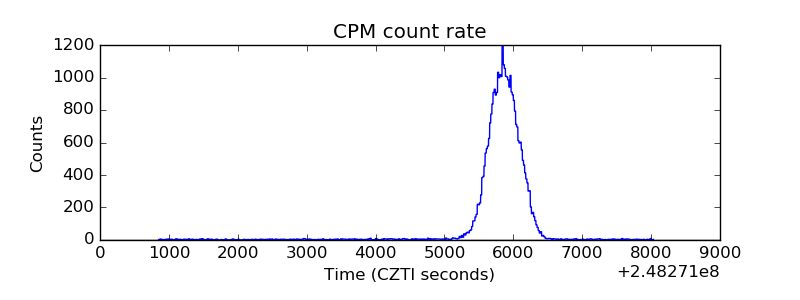 |
| CZT Counter | 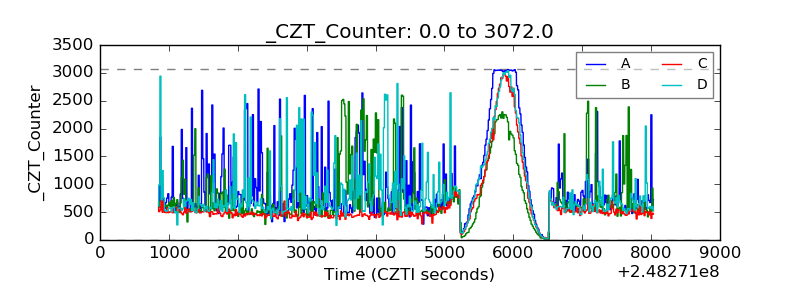 |
| +2.5 Volts monitor |  |
| +5 Volts monitor |  |
| _ROLL_ROT | 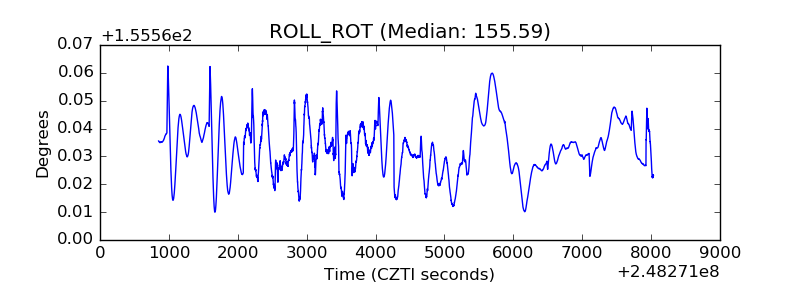 |
| _Roll_DEC | 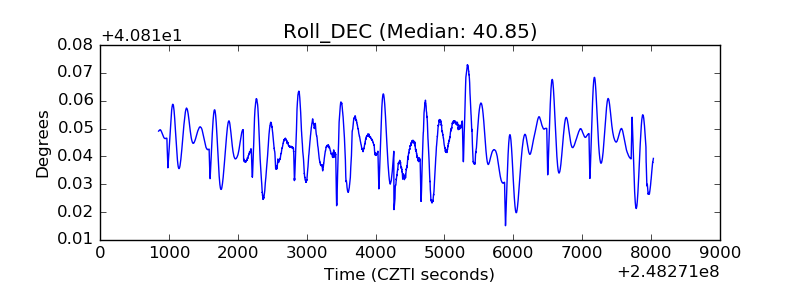 |
| _Roll_RA | 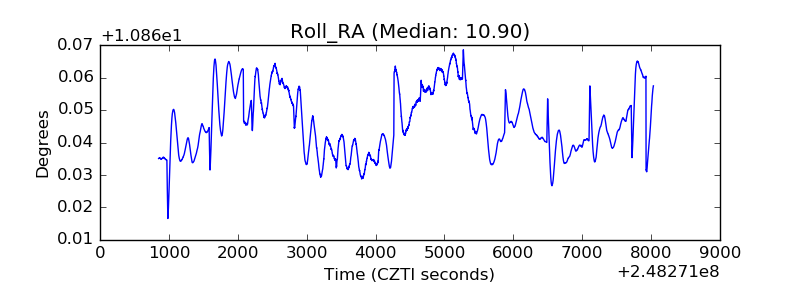 |
| Veto Counter | 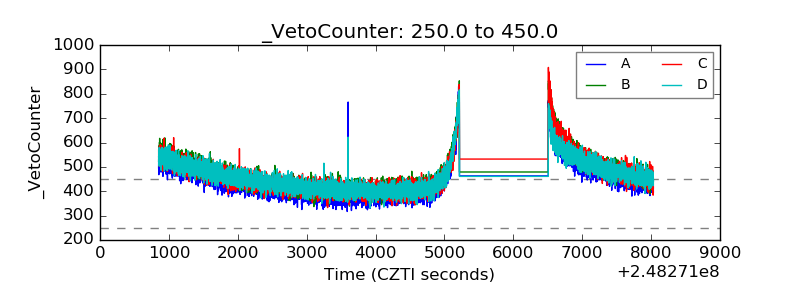 |