| Param | Original file | Final file |
|---|---|---|
| Filename | modeM0/AS1A04_021T05_9000001686_11508cztM0_level2.evt | modeM0/AS1A04_021T05_9000001686_11508cztM0_level2_quad_clean.evt |
| Size (bytes) | 598,032,000 | 108,774,720 |
| Size | 570.3 MB | 103.7 MB |
| Events in quadrant A | 5,174,182 | 694,379 |
| Events in quadrant B | 4,742,551 | 701,393 |
| Events in quadrant C | 3,176,447 | 743,042 |
| Events in quadrant D | 4,572,922 | 696,645 |
| Mode M9 | |||
|---|---|---|---|
| Quadrant | BADHDUFLAG | Total packets | Discarded packets |
| A | 0 | 16 | 0 |
| B | 0 | 16 | 0 |
| C | 0 | 16 | 0 |
| D | 0 | 17 | 0 |
| Mode SS | |||
|---|---|---|---|
| Quadrant | BADHDUFLAG | Total packets | Discarded packets |
| A | 0 | 132 | 0 |
| B | 0 | 132 | 0 |
| C | 0 | 132 | 0 |
| D | 0 | 132 | 0 |
| Mode M0 | |||
|---|---|---|---|
| Quadrant | BADHDUFLAG | Total packets | Discarded packets |
| A | 0 | 19878 | 3 |
| B | 0 | 18384 | 2 |
| C | 0 | 13650 | 2 |
| D | 0 | 17907 | 2 |
| Quadrant | Total seconds | Saturated seconds | Saturation percentage |
|---|---|---|---|
| A | 6583 | 468 | 7.109221% |
| B | 6583 | 466 | 7.078839% |
| C | 6583 | 72 | 1.093726% |
| D | 6583 | 391 | 5.939541% |
Noise dominated data is calculated using 1-second bins in cleaned event files. If a bin has >2000 counts, and if more than 50% of those come from <1% of pixels, then it is considered to be noise-dominated and hence unusable.
| Quadrant | # 1 sec bins | Bins with >0 counts | Bins with >2000 counts | High rate bins dominated by noise | Noise dominated (total time) | Noise dominated (detector-on time) | Marked lightcurve |
|---|---|---|---|---|---|---|---|
| A | 7764 | 6585 | 211 | 211 | 2.72% | 3.20% | 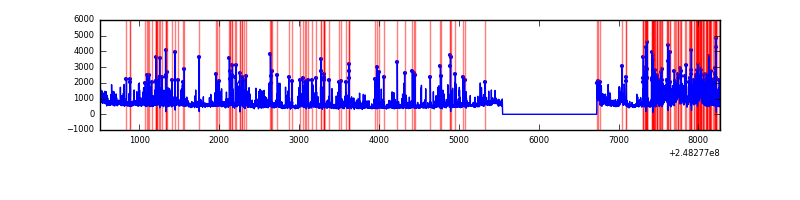 |
| B | 7764 | 6585 | 215 | 215 | 2.77% | 3.26% | 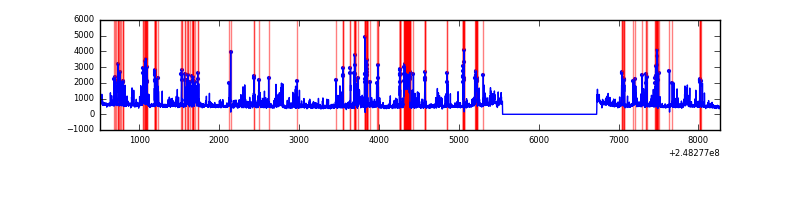 |
| C | 7764 | 6585 | 2 | 2 | 0.03% | 0.03% | 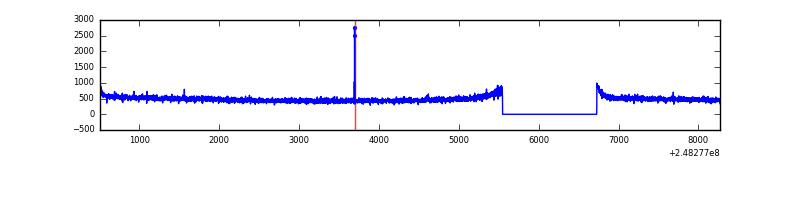 |
| D | 7764 | 6585 | 201 | 201 | 2.59% | 3.05% | 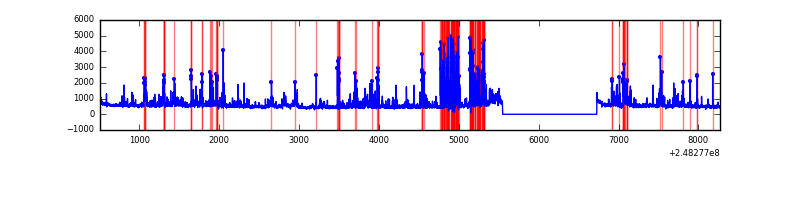 |
Top three noisy pixels from each quadrant. If the there are fewer than three noisy pixels in the level2.evt file, extra rows are filled as -1
| Pixel properties | Quadrant properties | ||||||
|---|---|---|---|---|---|---|---|
| Quadrant | DetID | PixID | Counts | Sigma | Mean | Median | Sigma |
| A | 8 | 5 | 1835689 | 11266.78 | 816 | 799 | 162.9 |
| A | 14 | 238 | 45539 | 274.72 | 816 | 799 | 162.9 |
| A | 9 | 143 | 29265 | 174.79 | 816 | 799 | 162.9 |
| B | 4 | 239 | 1008774 | 6622.84 | 807 | 788 | 152.2 |
| B | 11 | 51 | 209333 | 1370.22 | 807 | 788 | 152.2 |
| B | 3 | 64 | 201195 | 1316.75 | 807 | 788 | 152.2 |
| C | 14 | 234 | 6605 | 30.72 | 813 | 818 | 188.4 |
| C | 13 | 61 | 6010 | 27.56 | 813 | 818 | 188.4 |
| C | 3 | 202 | 2126 | 6.94 | 813 | 818 | 188.4 |
| D | 10 | 253 | 520139 | 2738.89 | 798 | 777 | 189.6 |
| D | 1 | 52 | 263546 | 1385.73 | 798 | 777 | 189.6 |
| D | 2 | 120 | 236441 | 1242.79 | 798 | 777 | 189.6 |
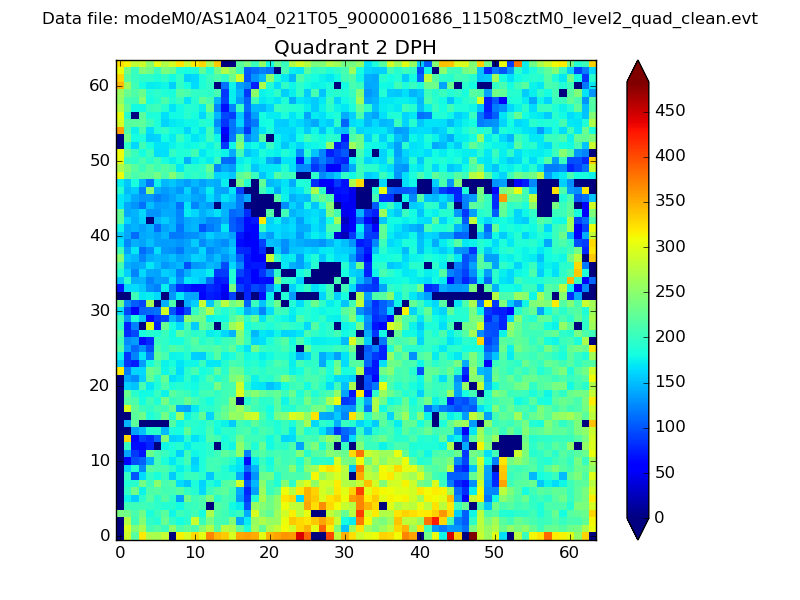
Histogram calculated using DETX and DETY for each event in the final _common_clean file
| Quadrant A | 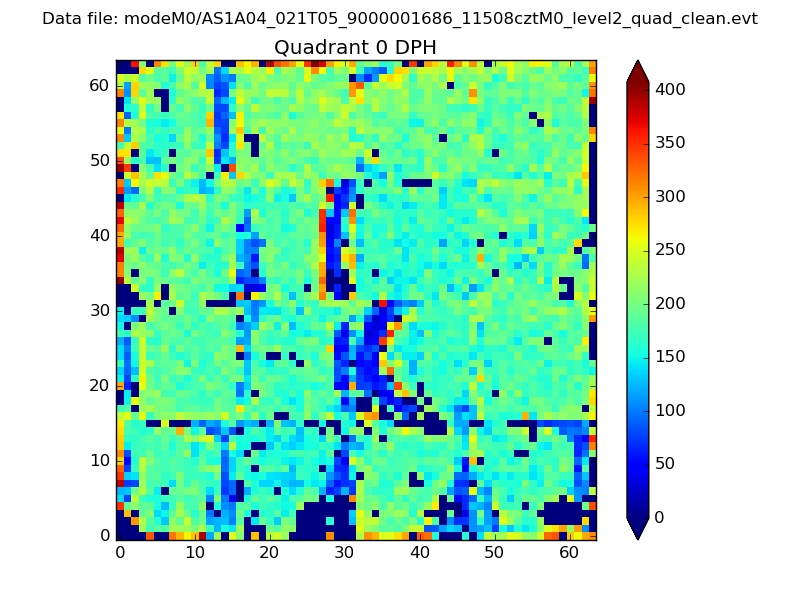 |
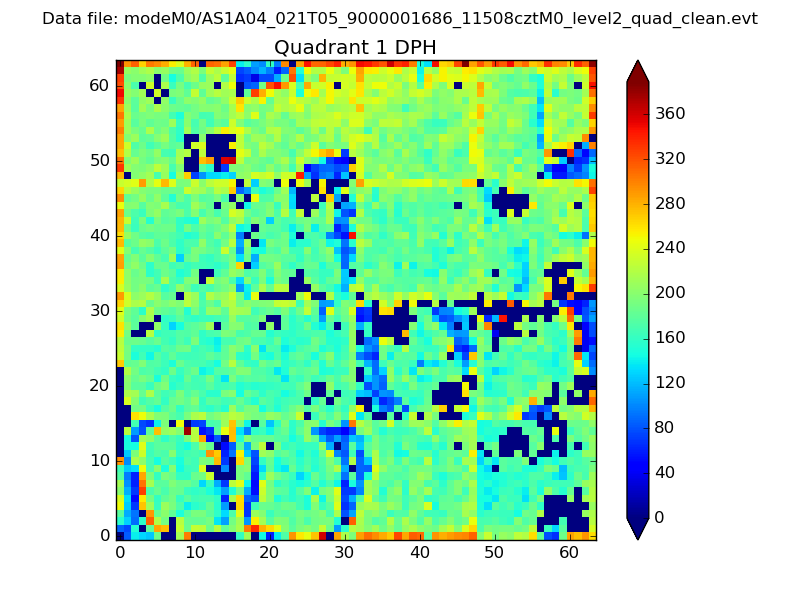 |
Quadrant B |
|---|---|---|---|
| Quadrant D | 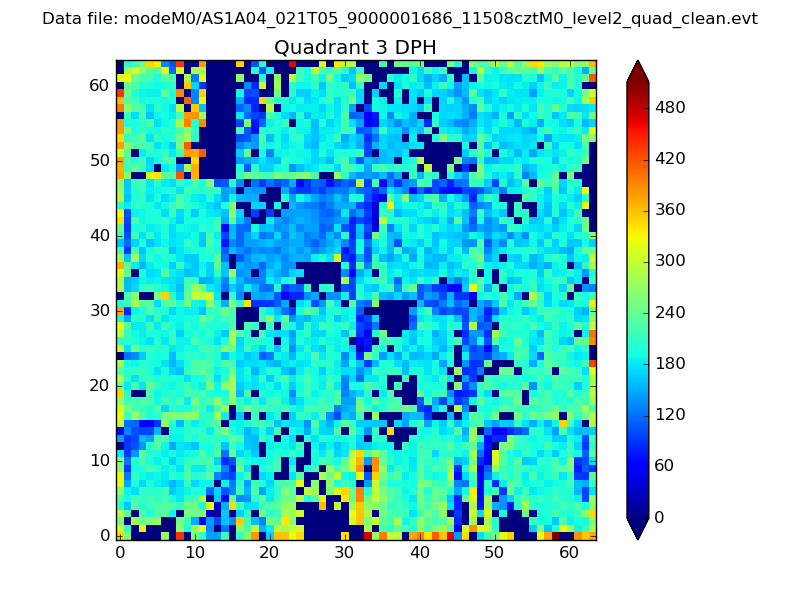 |
 |
Quadrant C |
| Plot type | Count rate plots | Images |
|---|---|---|
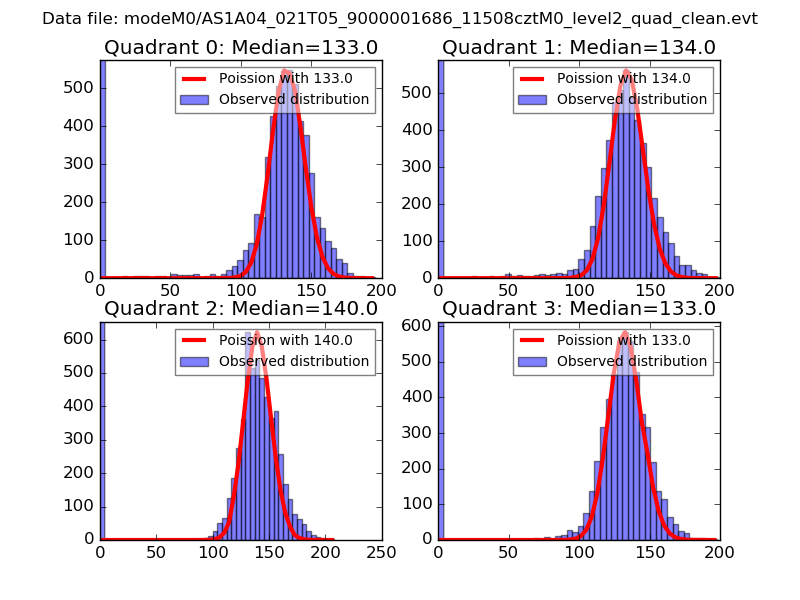
| Comparison with Poisson distribution Blue bars denote a histogram of data divided into 1 sec bins. Red curve is a Poisson curve with rate = median count rate of data. |
 |
 |
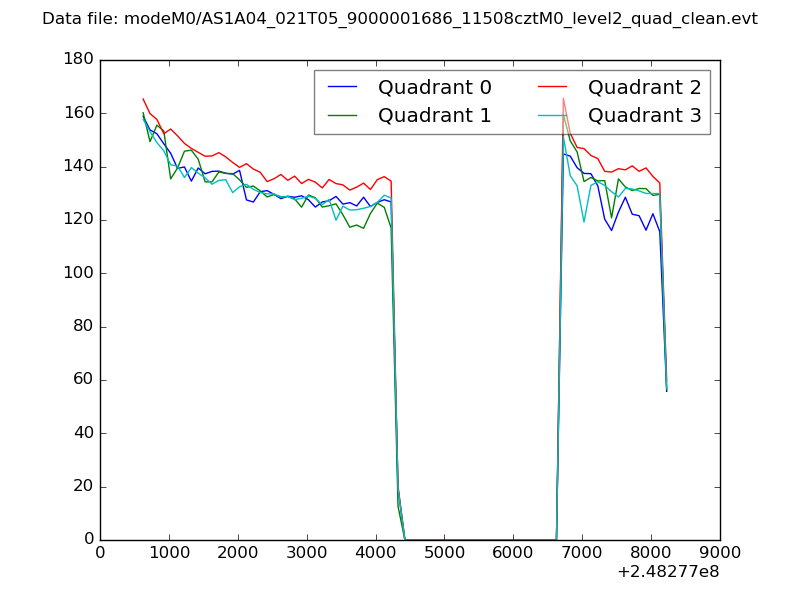
| Quadrant-wise count rates Data is divided into 100 sec bins |
 |
|
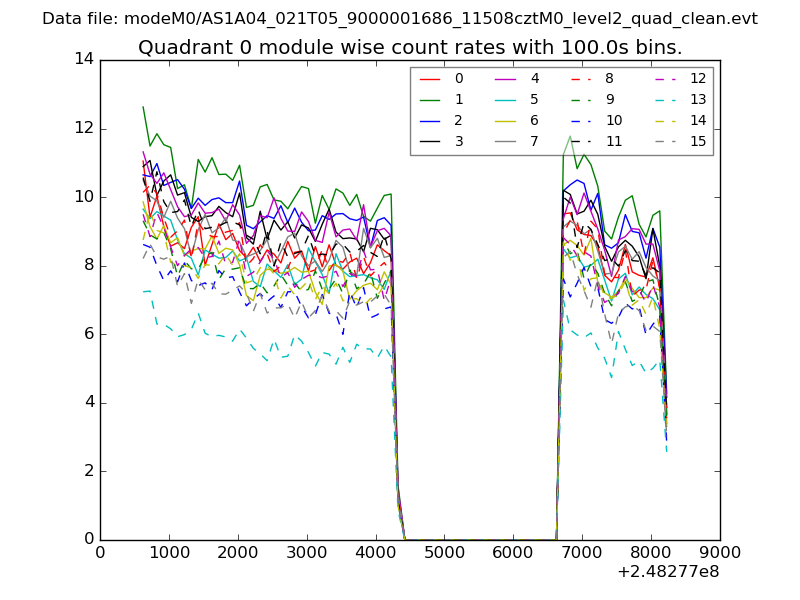
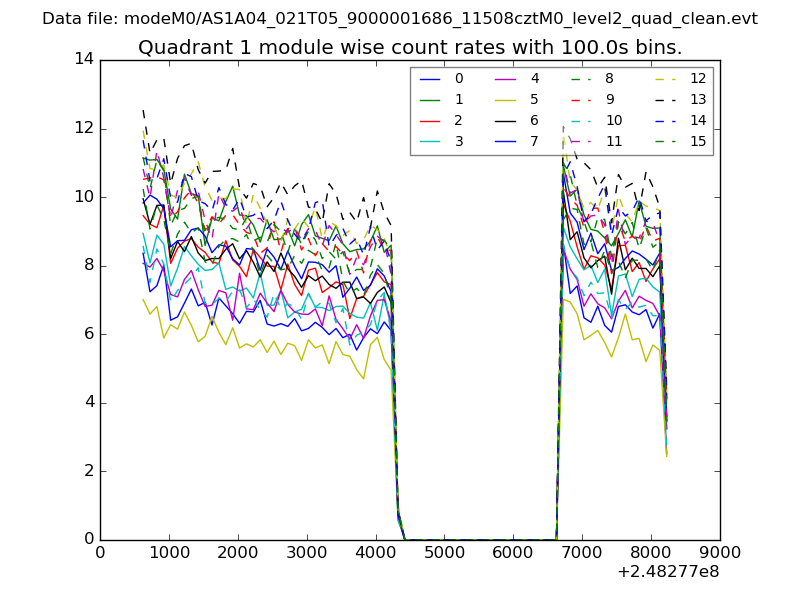
| Module-wise count rates for Quadrant A Data is divided into 100 sec bins |
 |
 |
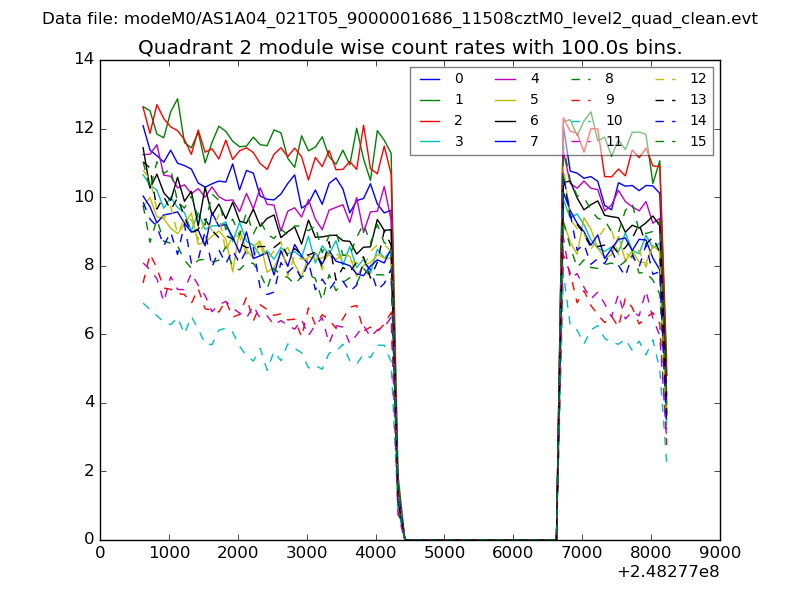
| Module-wise count rates for Quadrant B Data is divided into 100 sec bins |
 |
 |
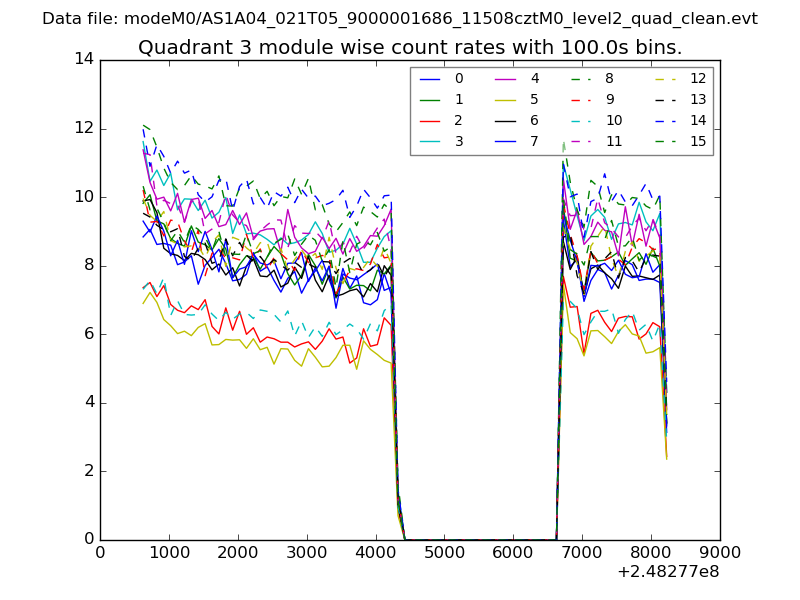
| Module-wise count rates for Quadrant C Data is divided into 100 sec bins |
 |
 |
| Module-wise count rates for Quadrant D Data is divided into 100 sec bins |
 |
 |
| Parameter | Plot |
|---|---|
| CZT HV Monitor | 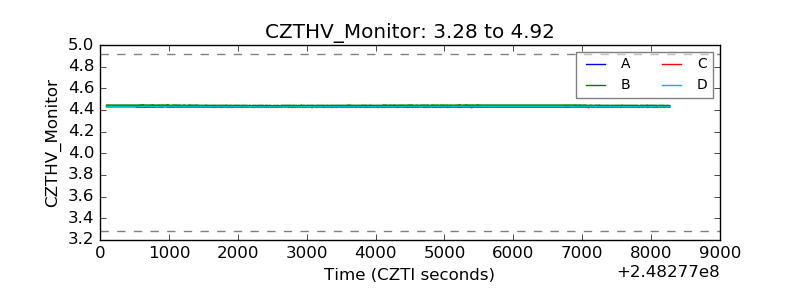 |
| D_VDD | 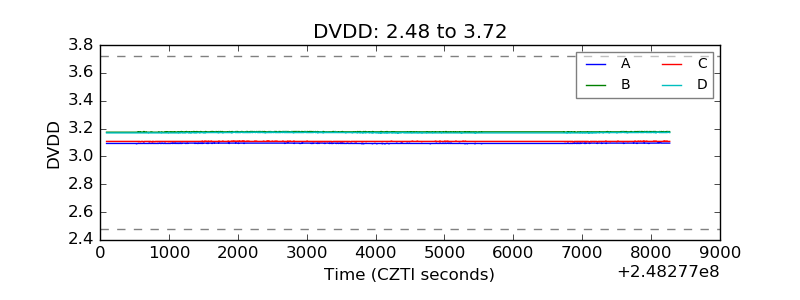 |
| Temperature 1 | 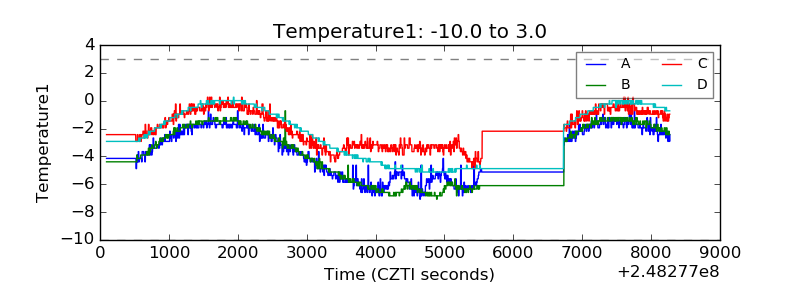 |
| Veto HV Monitor | 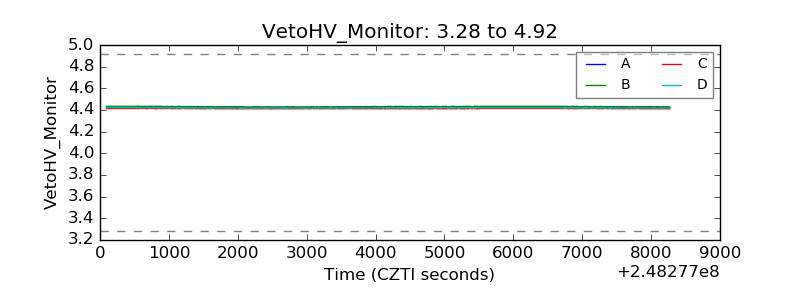 |
| Veto LLD | 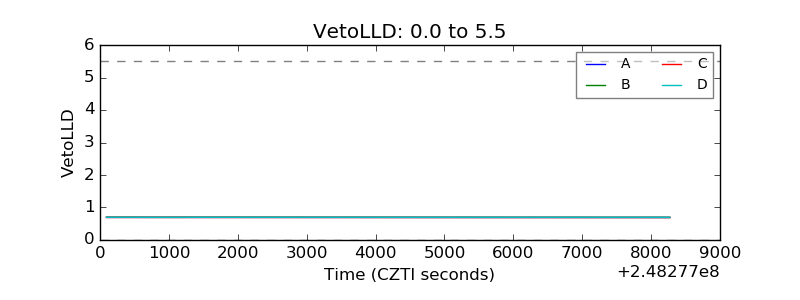 |
| Alpha Counter | 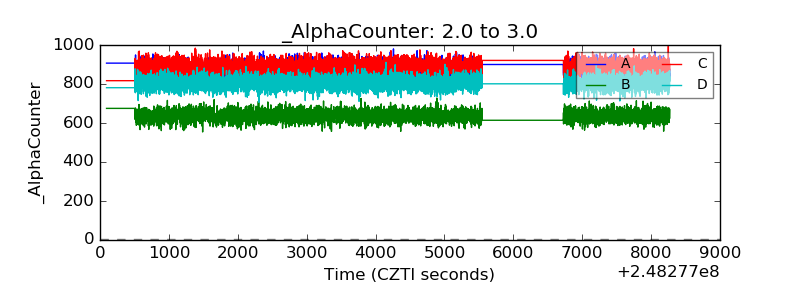 |
| _CPM_Rate | 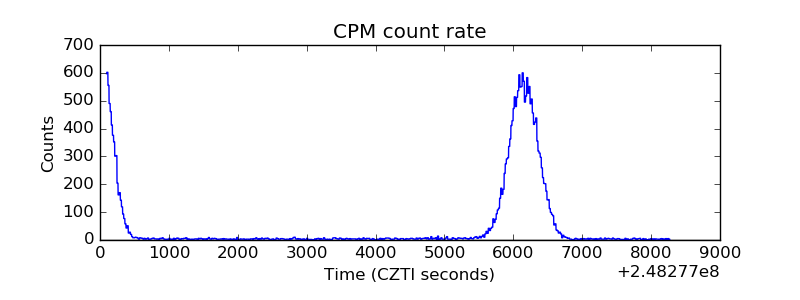 |
| CZT Counter | 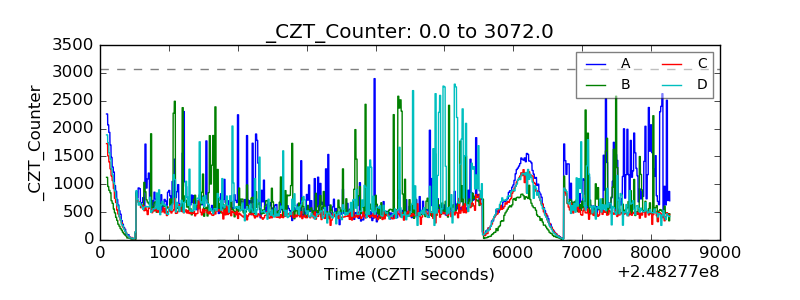 |
| +2.5 Volts monitor |  |
| +5 Volts monitor | 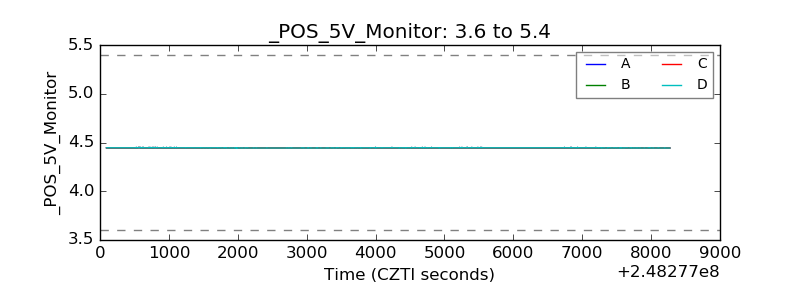 |
| _ROLL_ROT | 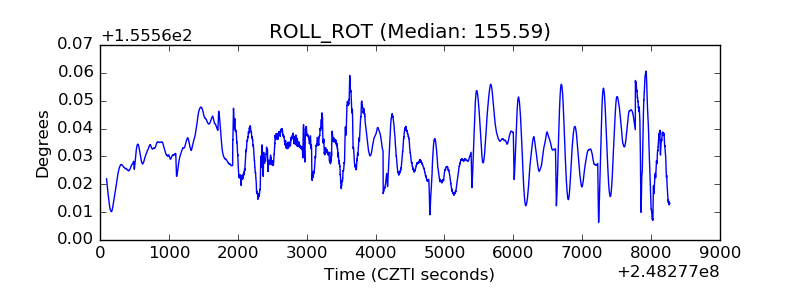 |
| _Roll_DEC | 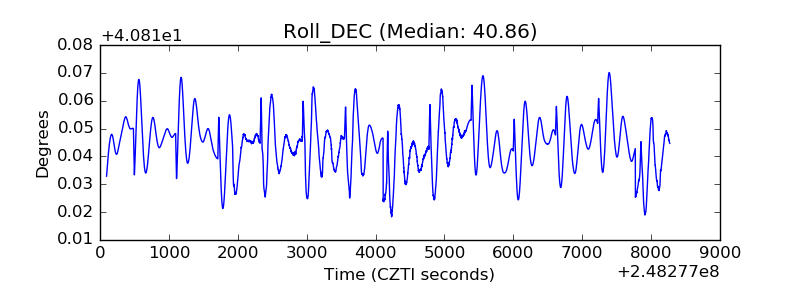 |
| _Roll_RA | 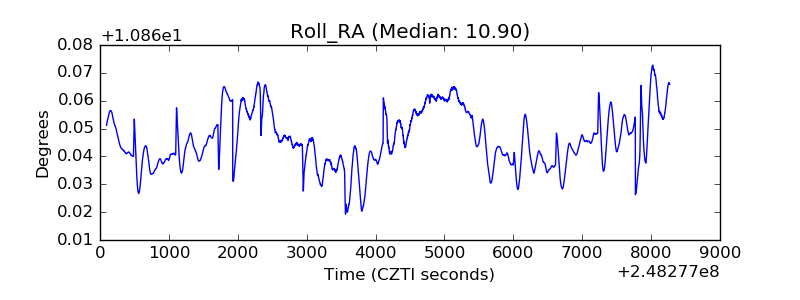 |
| Veto Counter |  |