| Param | Original file | Final file |
|---|---|---|
| Filename | modeM0/AS1A04_021T05_9000001686_11509cztM0_level2.evt | modeM0/AS1A04_021T05_9000001686_11509cztM0_level2_quad_clean.evt |
| Size (bytes) | 173,862,720 | 35,832,960 |
| Size | 165.8 MB | 34.2 MB |
| Events in quadrant A | 1,887,122 | 227,065 |
| Events in quadrant B | 1,180,483 | 239,291 |
| Events in quadrant C | 857,050 | 251,221 |
| Events in quadrant D | 1,215,178 | 234,279 |
| Mode SS | |||
|---|---|---|---|
| Quadrant | BADHDUFLAG | Total packets | Discarded packets |
| A | 0 | 36 | 0 |
| B | 0 | 36 | 0 |
| C | 0 | 36 | 0 |
| D | 0 | 36 | 0 |
| Mode M0 | |||
|---|---|---|---|
| Quadrant | BADHDUFLAG | Total packets | Discarded packets |
| A | 0 | 6852 | 0 |
| B | 0 | 4654 | 0 |
| C | 0 | 3655 | 0 |
| D | 0 | 4743 | 0 |
| Quadrant | Total seconds | Saturated seconds | Saturation percentage |
|---|---|---|---|
| A | 1818 | 206 | 11.331133% |
| B | 1818 | 74 | 4.070407% |
| C | 1818 | 0 | 0.000000% |
| D | 1818 | 83 | 4.565457% |
Noise dominated data is calculated using 1-second bins in cleaned event files. If a bin has >2000 counts, and if more than 50% of those come from <1% of pixels, then it is considered to be noise-dominated and hence unusable.
| Quadrant | # 1 sec bins | Bins with >0 counts | Bins with >2000 counts | High rate bins dominated by noise | Noise dominated (total time) | Noise dominated (detector-on time) | Marked lightcurve |
|---|---|---|---|---|---|---|---|
| A | 1819 | 1819 | 143 | 143 | 7.86% | 7.86% | 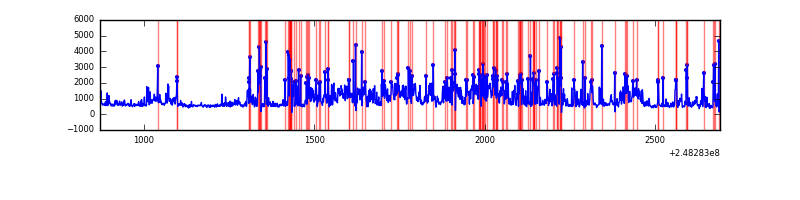 |
| B | 1819 | 1819 | 37 | 37 | 2.03% | 2.03% | 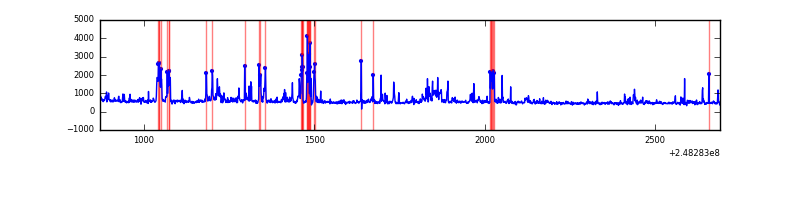 |
| C | 1819 | 1819 | 0 | 0 | 0.00% | 0.00% | 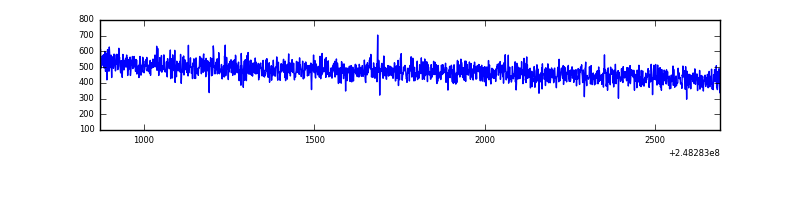 |
| D | 1819 | 1819 | 33 | 33 | 1.81% | 1.81% | 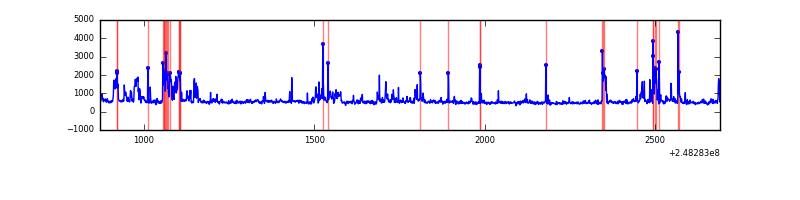 |
Top three noisy pixels from each quadrant. If the there are fewer than three noisy pixels in the level2.evt file, extra rows are filled as -1
| Pixel properties | Quadrant properties | ||||||
|---|---|---|---|---|---|---|---|
| Quadrant | DetID | PixID | Counts | Sigma | Mean | Median | Sigma |
| A | 8 | 5 | 870556 | 19127.46 | 216 | 211 | 45.5 |
| A | 14 | 238 | 98879 | 2168.41 | 216 | 211 | 45.5 |
| A | 15 | 223 | 30482 | 665.26 | 216 | 211 | 45.5 |
| B | 4 | 239 | 157351 | 3606.38 | 219 | 214 | 43.6 |
| B | 11 | 51 | 57090 | 1305.33 | 219 | 214 | 43.6 |
| B | 15 | 204 | 41977 | 958.48 | 219 | 214 | 43.6 |
| C | 13 | 61 | 1684 | 28.19 | 219 | 221 | 51.9 |
| C | 3 | 202 | 580 | 6.92 | 219 | 221 | 51.9 |
| C | -1 | -1 | -1 | -1.0 | 219 | 221 | 51.9 |
| D | 13 | 137 | 207019 | 3847.59 | 219 | 212 | 53.7 |
| D | 2 | 120 | 65061 | 1206.5 | 219 | 212 | 53.7 |
| D | 13 | 104 | 30725 | 567.69 | 219 | 212 | 53.7 |
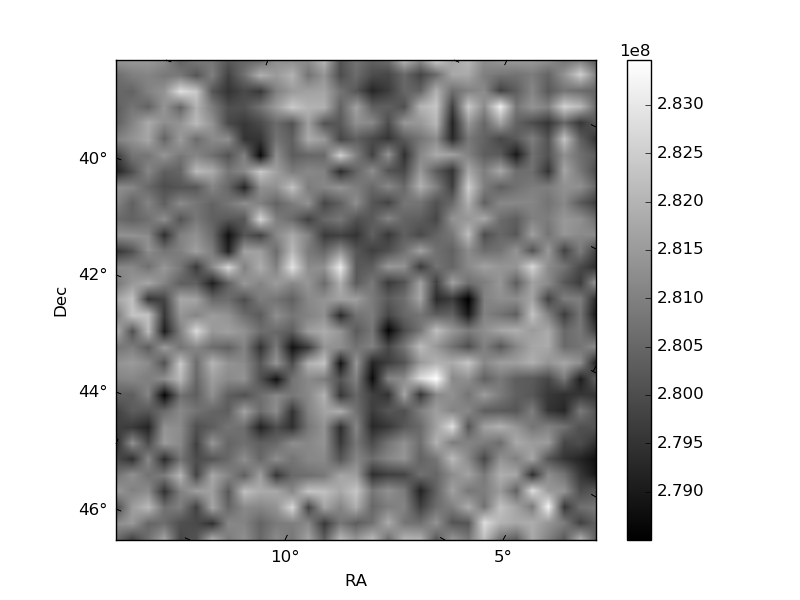
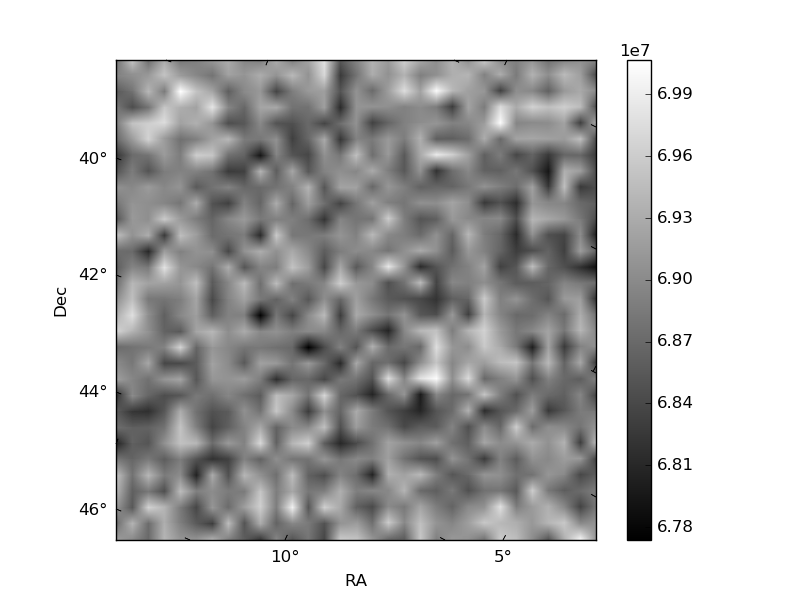
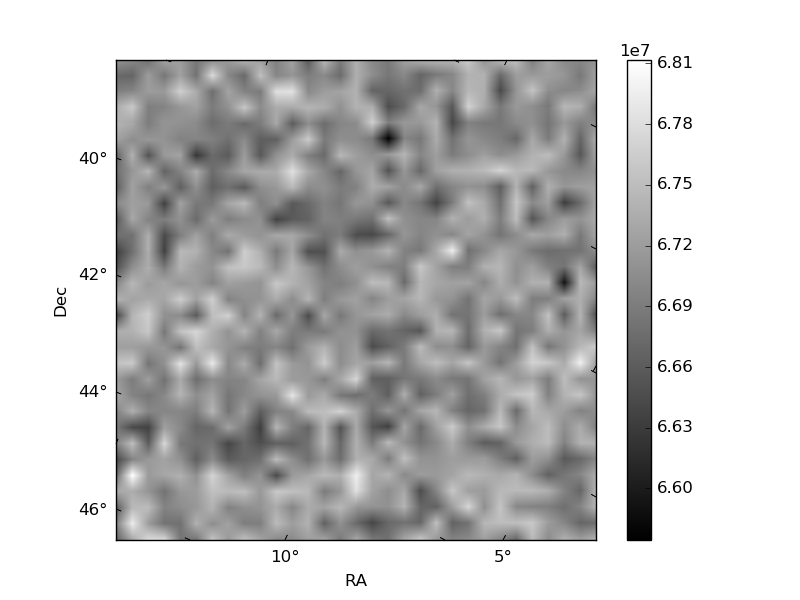
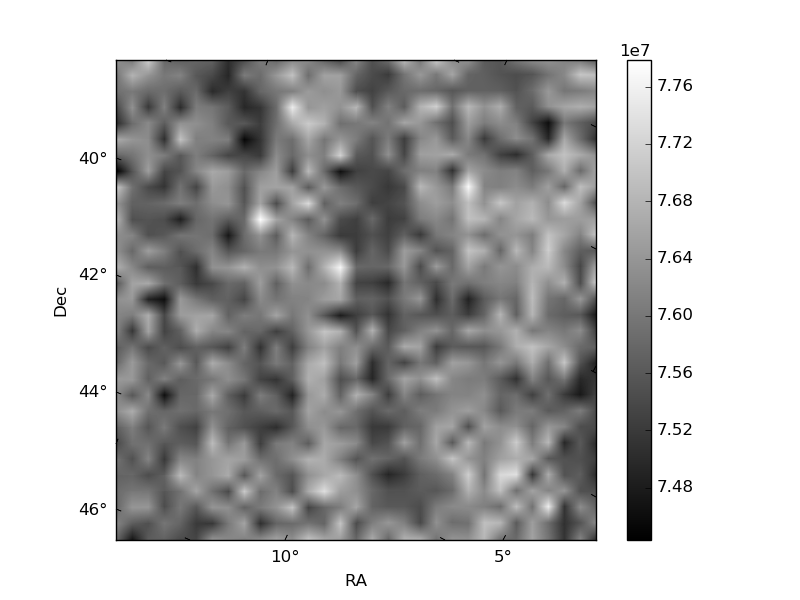
Histogram calculated using DETX and DETY for each event in the final _common_clean file
| Quadrant A | 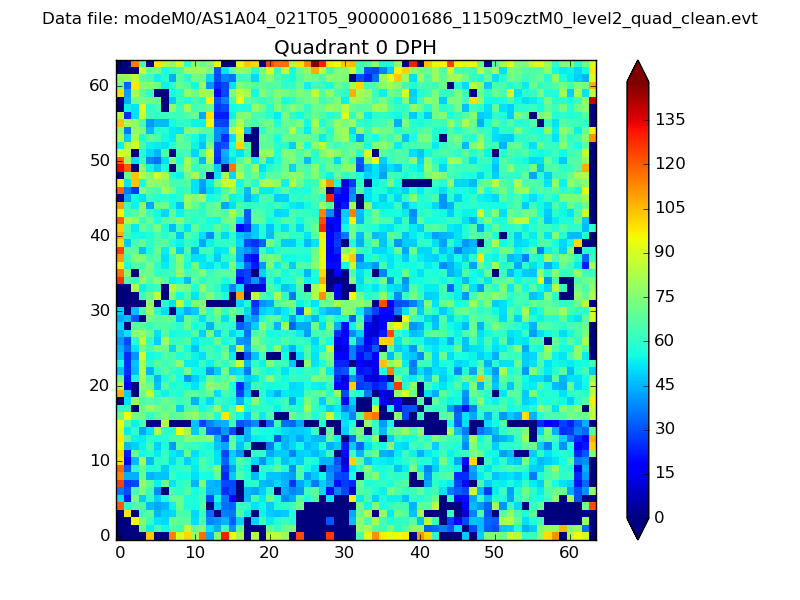 |
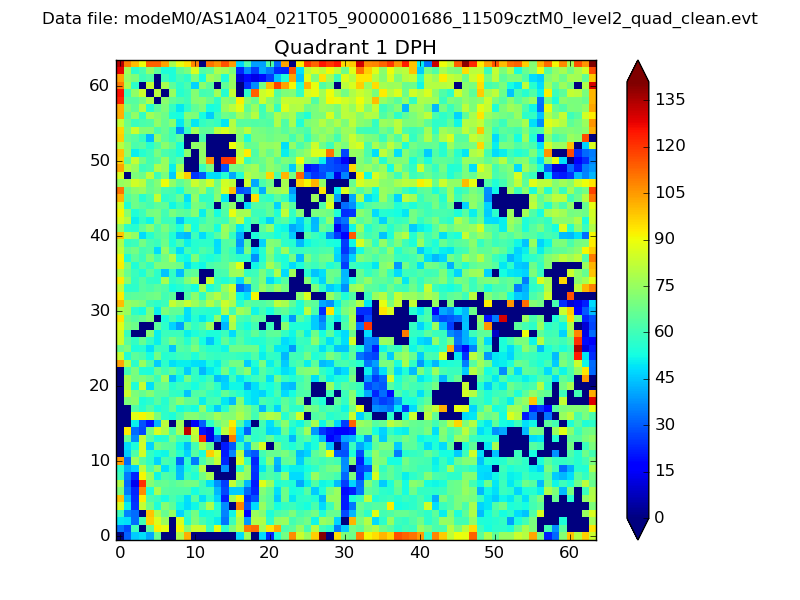 |
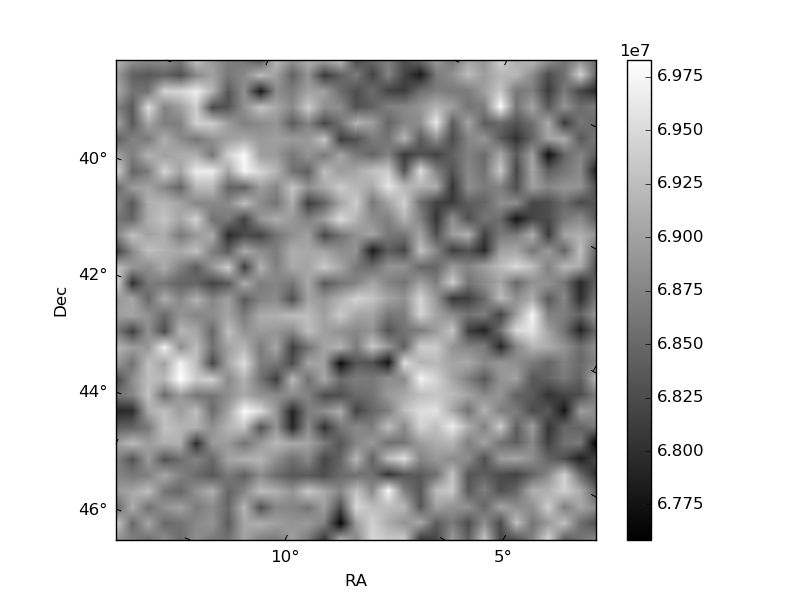
Quadrant B |
|---|---|---|---|
| Quadrant D | 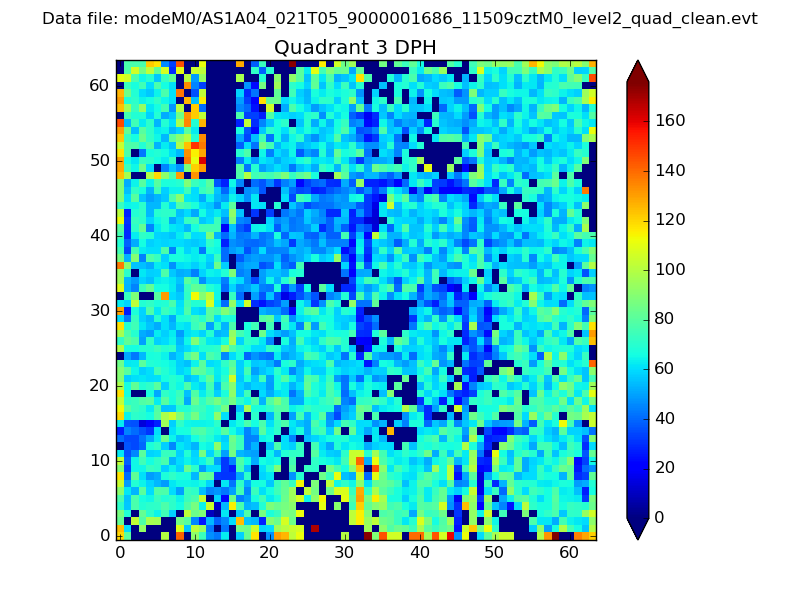 |
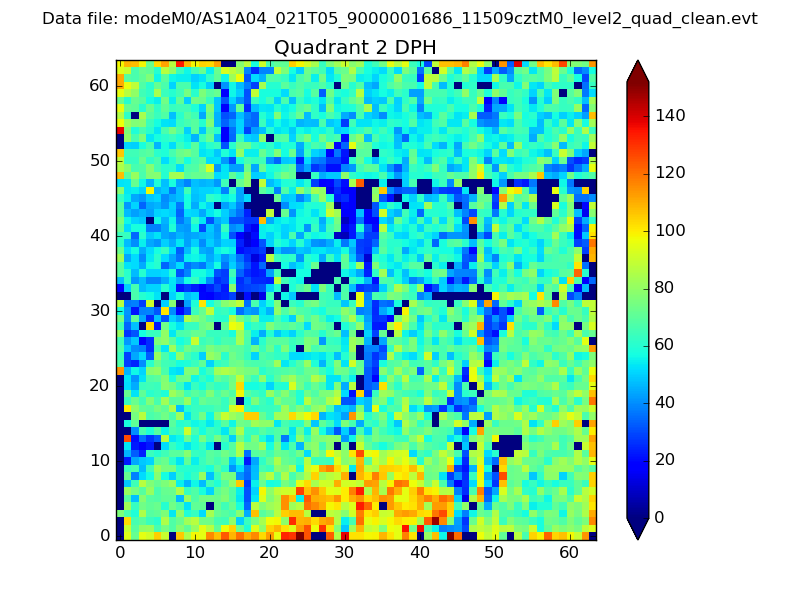 |
Quadrant C |
| Plot type | Count rate plots | Images |
|---|---|---|
| Comparison with Poisson distribution Blue bars denote a histogram of data divided into 1 sec bins. Red curve is a Poisson curve with rate = median count rate of data. |
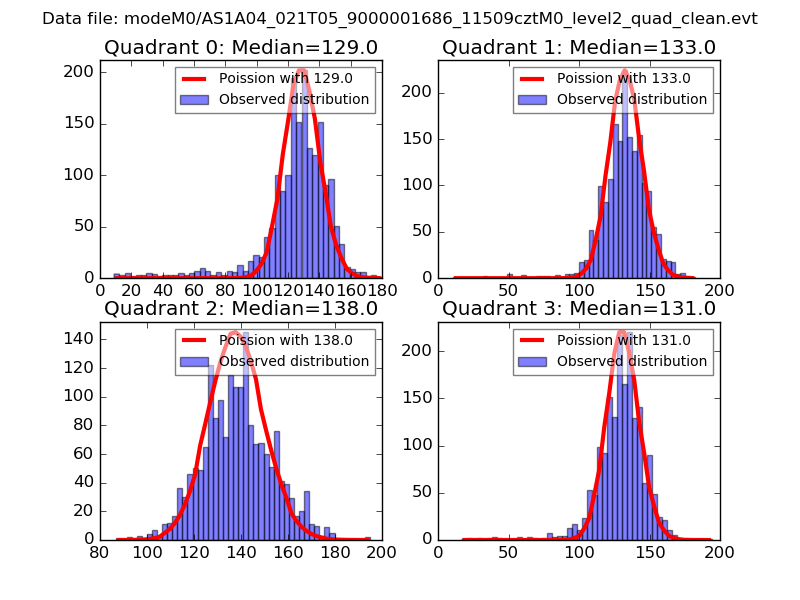 |
 |
| Quadrant-wise count rates Data is divided into 100 sec bins |
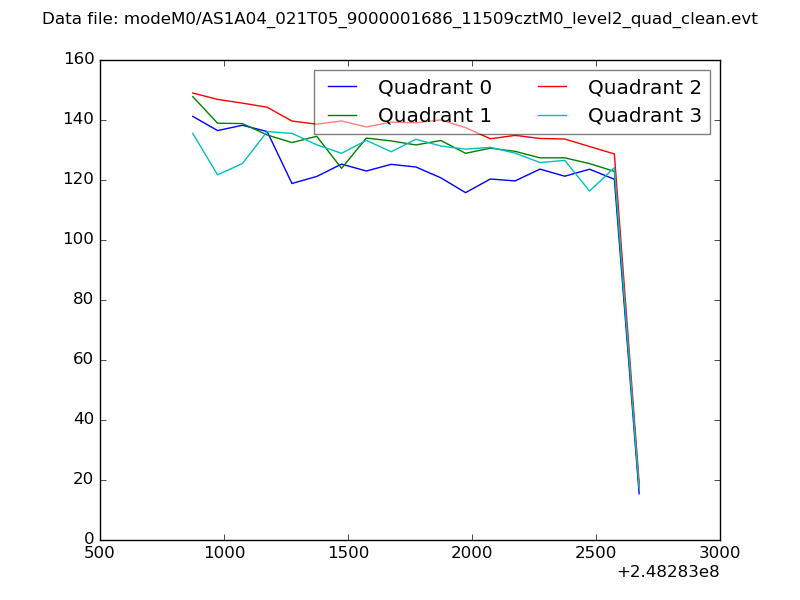 |
|
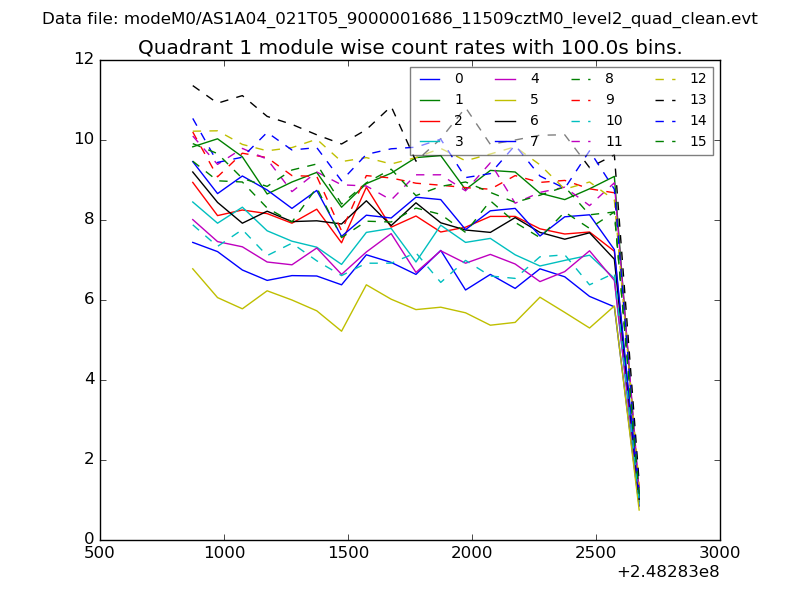
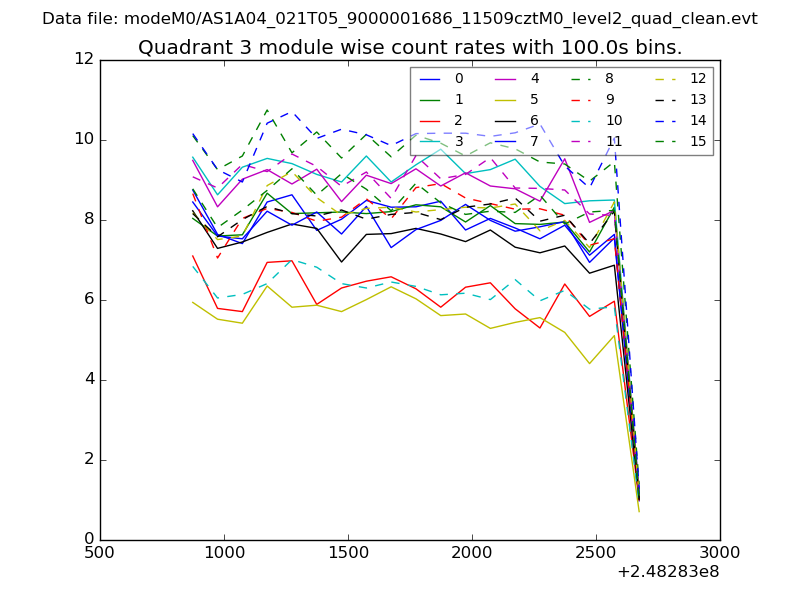
| Module-wise count rates for Quadrant A Data is divided into 100 sec bins |
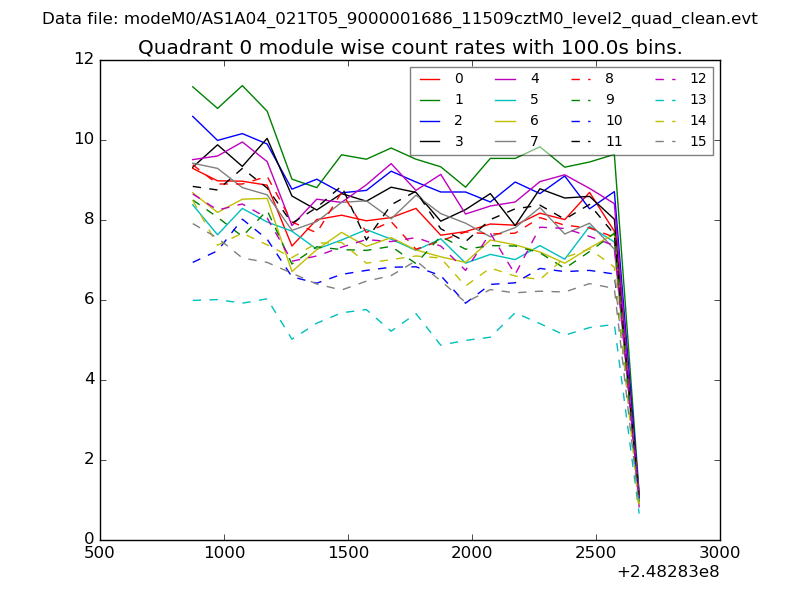 |
 |
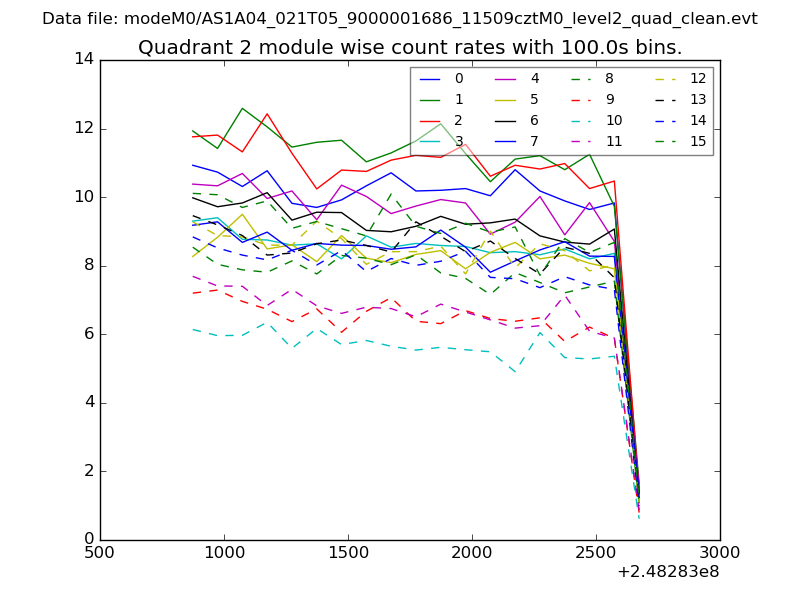
| Module-wise count rates for Quadrant B Data is divided into 100 sec bins |
 |
 |
| Module-wise count rates for Quadrant C Data is divided into 100 sec bins |
 |
 |
| Module-wise count rates for Quadrant D Data is divided into 100 sec bins |
 |
 |
| Parameter | Plot |
|---|---|
| CZT HV Monitor | 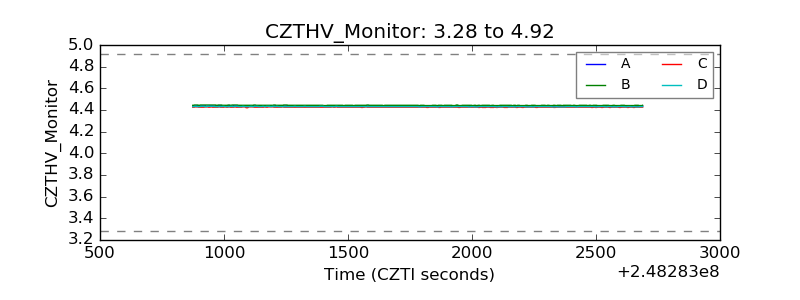 |
| D_VDD | 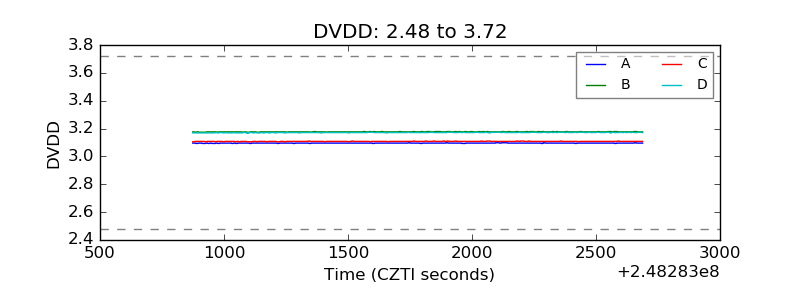 |
| Temperature 1 | 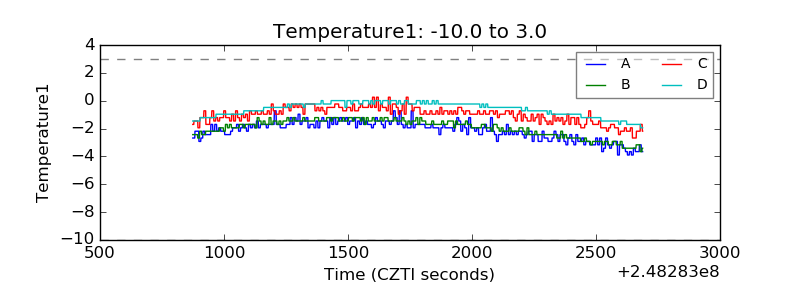 |
| Veto HV Monitor | 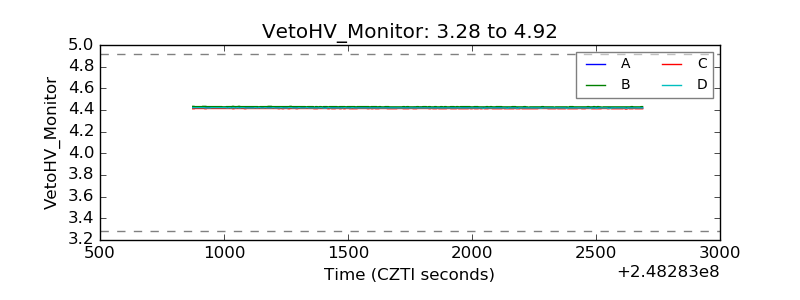 |
| Veto LLD | 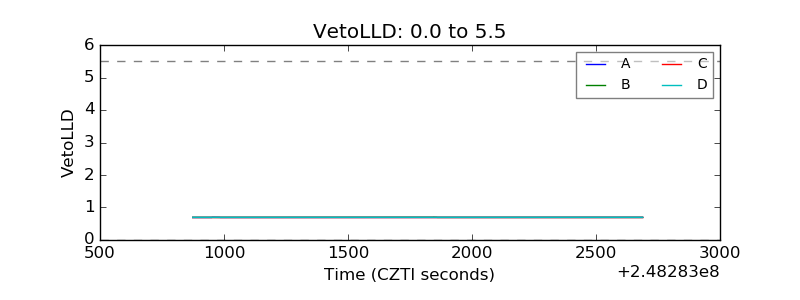 |
| Alpha Counter | 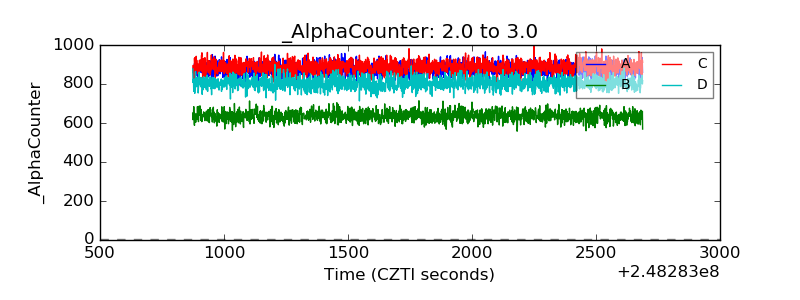 |
| _CPM_Rate | 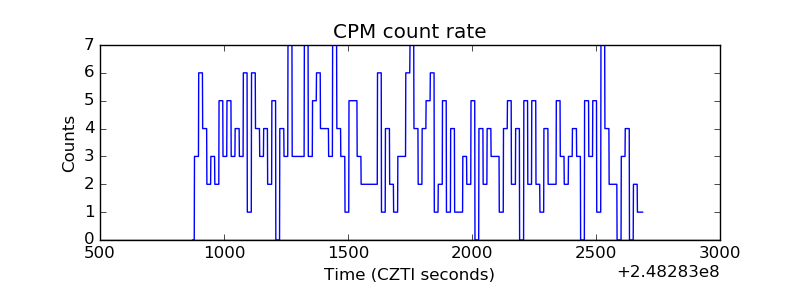 |
| CZT Counter | 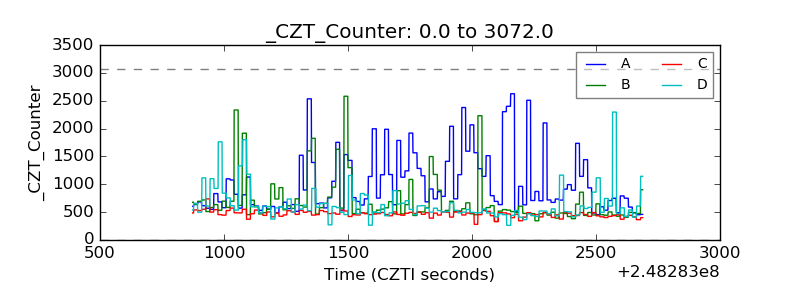 |
| +2.5 Volts monitor | 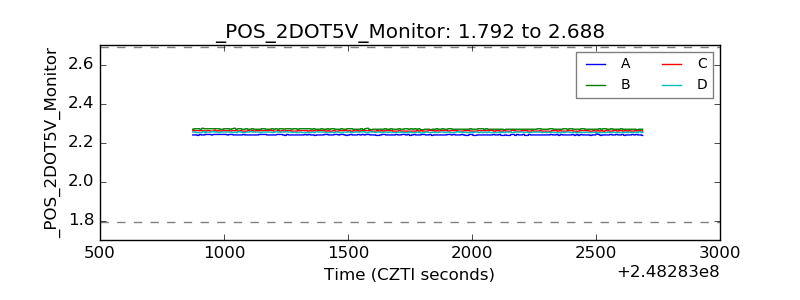 |
| +5 Volts monitor | 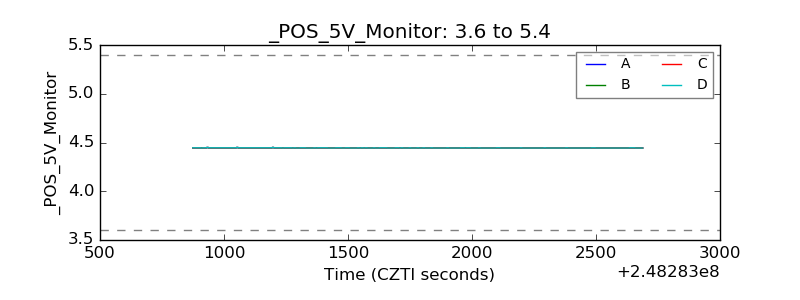 |
| _ROLL_ROT | 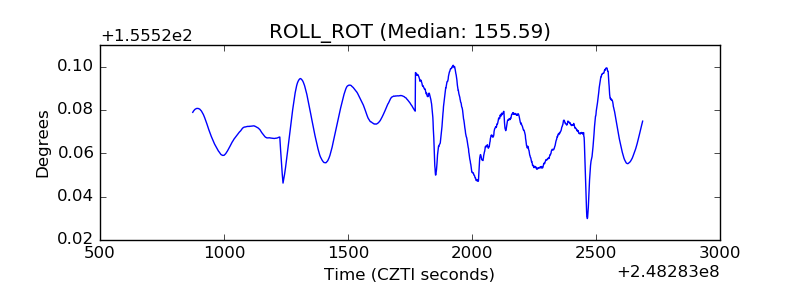 |
| _Roll_DEC | 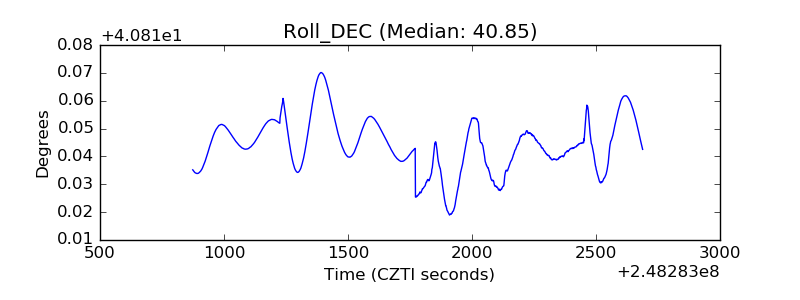 |
| _Roll_RA | 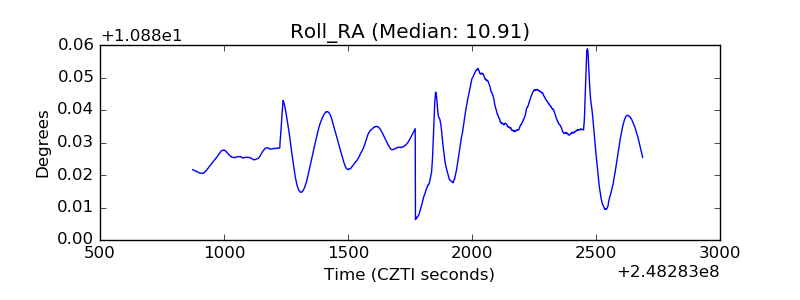 |
| Veto Counter | 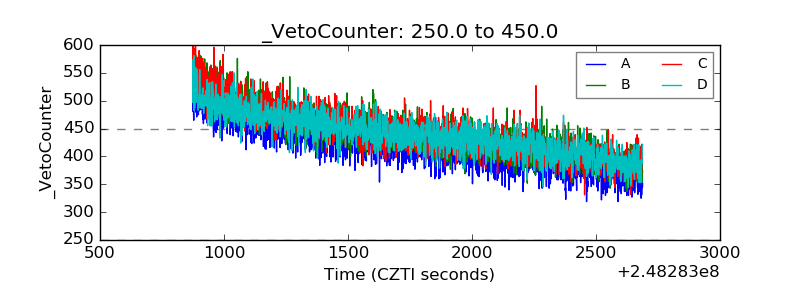 |