| Param | Original file | Final file |
|---|---|---|
| Filename | modeM0/AS1A04_021T06_9000001688cztM0_level2.fits | modeM0/AS1A04_021T06_9000001688cztM0_level2_quad_clean.evt |
| Size (bytes) | 604,598,400 | 606,179,520 |
| Size | 576.6 MB | 578.1 MB |
| Events in quadrant A | 3,344,058 | 3,169,814 |
| Events in quadrant B | 3,538,932 | 3,515,728 |
| Events in quadrant C | 3,705,546 | 3,784,182 |
| Events in quadrant D | 3,195,340 | 3,367,886 |
| Mode M0 | |||
|---|---|---|---|
| Quadrant | BADHDUFLAG | Total packets | Discarded packets |
| A | 0 | 240758 | 0 |
| B | 0 | 175244 | 0 |
| C | 0 | 135550 | 0 |
| D | 0 | 162722 | 0 |
| Mode SS | |||
|---|---|---|---|
| Quadrant | BADHDUFLAG | Total packets | Discarded packets |
| A | 0 | 1342 | 0 |
| B | 0 | 1342 | 0 |
| C | 0 | 1342 | 0 |
| D | 0 | 1342 | 0 |
| Mode M9 | |||
|---|---|---|---|
| Quadrant | BADHDUFLAG | Total packets | Discarded packets |
| A | 0 | 95 | 0 |
| B | 0 | 95 | 0 |
| C | 0 | 95 | 0 |
| D | 0 | 95 | 0 |
| Quadrant | Total seconds | Saturated seconds | Saturation percentage |
|---|---|---|---|
| A | 65902 | 11994 | 18.199751% |
| B | 65902 | 3496 | 5.304847% |
| C | 65902 | 446 | 0.676762% |
| D | 65902 | 1617 | 2.453643% |
Noise dominated data is calculated using 1-second bins in cleaned event files. If a bin has >2000 counts, and if more than 50% of those come from <1% of pixels, then it is considered to be noise-dominated and hence unusable.
| Quadrant | # 1 sec bins | Bins with >0 counts | Bins with >2000 counts | High rate bins dominated by noise | Noise dominated (total time) | Noise dominated (detector-on time) | Marked lightcurve |
|---|---|---|---|---|---|---|---|
| A | 75352 | 64978 | 0 | 0 | 0.00% | 0.00% | 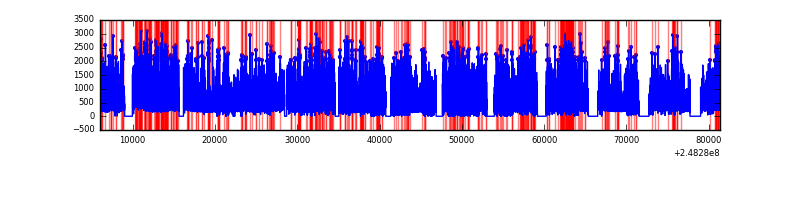 |
| B | 75352 | 65896 | 0 | 0 | 0.00% | 0.00% |  |
| C | 75352 | 65902 | 0 | 0 | 0.00% | 0.00% |  |
| D | 75352 | 65896 | 0 | 0 | 0.00% | 0.00% |  |
Top three noisy pixels from each quadrant. If the there are fewer than three noisy pixels in the level2.evt file, extra rows are filled as -1
| Pixel properties | Quadrant properties | ||||||
|---|---|---|---|---|---|---|---|
| Quadrant | DetID | PixID | Counts | Sigma | Mean | Median | Sigma |
| A | 0 | 29 | 3223 | 10.85 | 874 | 817 | 221.7 |
| A | 7 | 110 | 2836 | 9.11 | 874 | 817 | 221.7 |
| A | 0 | 30 | 2521 | 7.68 | 874 | 817 | 221.7 |
| B | 2 | 9 | 2981 | 11.17 | 933 | 886 | 187.5 |
| B | 3 | 17 | 2390 | 8.02 | 933 | 886 | 187.5 |
| B | 14 | 254 | 2323 | 7.67 | 933 | 886 | 187.5 |
| C | 1 | 80 | 2837 | 7.59 | 977 | 907 | 254.2 |
| C | 1 | 81 | 2790 | 7.41 | 977 | 907 | 254.2 |
| C | 12 | 241 | 2548 | 6.45 | 977 | 907 | 254.2 |
| D | 6 | 231 | 2323 | 6.11 | 912 | 829 | 244.5 |
| D | 3 | 14 | 2298 | 6.01 | 912 | 829 | 244.5 |
| D | 1 | 19 | 2268 | 5.89 | 912 | 829 | 244.5 |
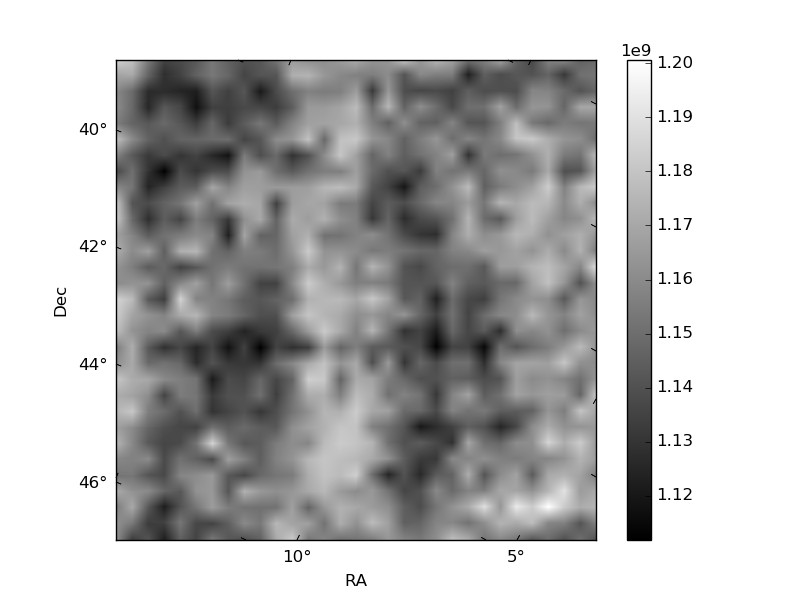
Histogram calculated using DETX and DETY for each event in the final _common_clean file
| Quadrant A | 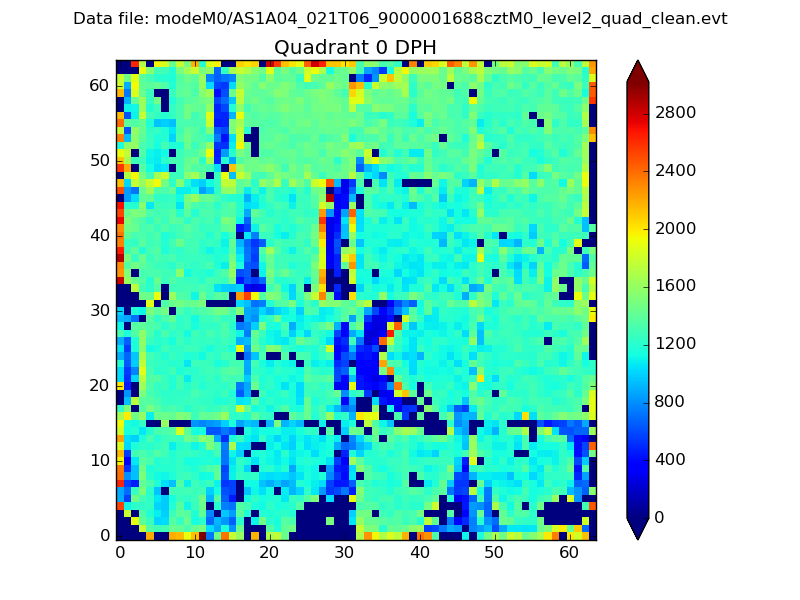 |
 |
Quadrant B |
|---|---|---|---|
| Quadrant D |  |
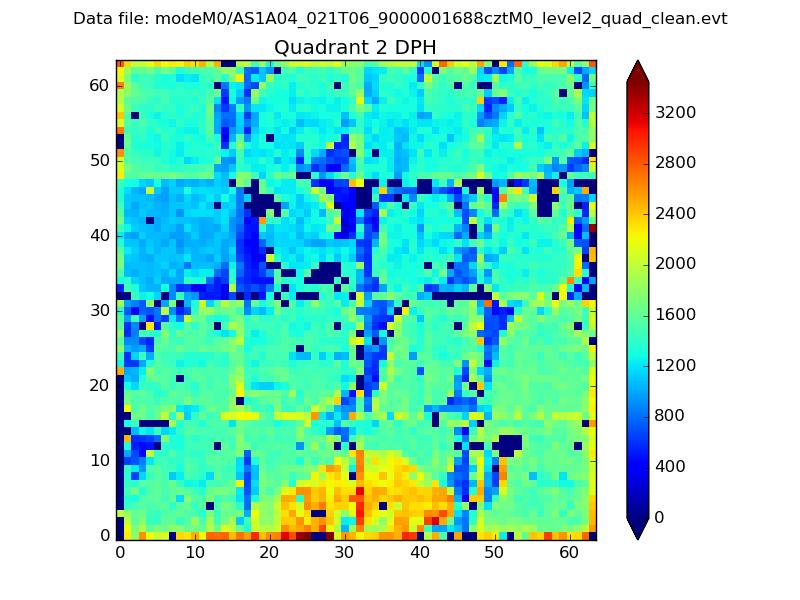 |
Quadrant C |
| Plot type | Count rate plots | Images |
|---|---|---|
| Comparison with Poisson distribution Blue bars denote a histogram of data divided into 1 sec bins. Red curve is a Poisson curve with rate = median count rate of data. |
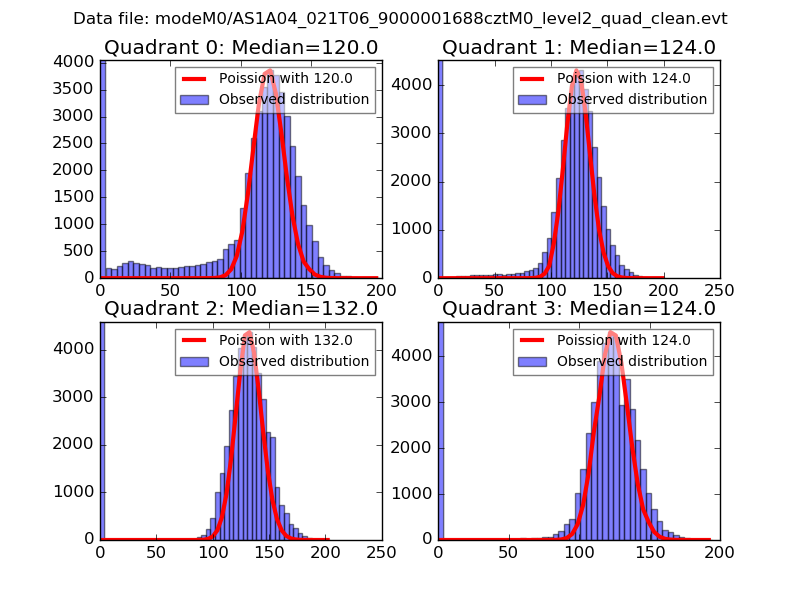 |
 |
| Quadrant-wise count rates Data is divided into 100 sec bins |
 |
|
| Module-wise count rates for Quadrant A Data is divided into 100 sec bins |
 |
 |
| Module-wise count rates for Quadrant B Data is divided into 100 sec bins |
 |
 |
| Module-wise count rates for Quadrant C Data is divided into 100 sec bins |
 |
 |
| Module-wise count rates for Quadrant D Data is divided into 100 sec bins |
 |
 |
| Parameter | Plot |
|---|---|
| CZT HV Monitor | 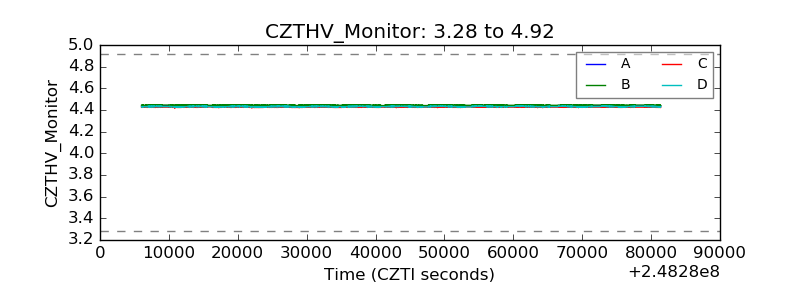 |
| D_VDD |  |
| Temperature 1 |  |
| Veto HV Monitor | 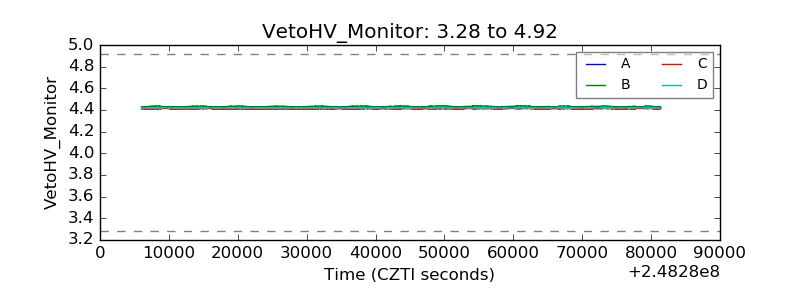 |
| Veto LLD |  |
| Alpha Counter |  |
| _CPM_Rate |  |
| CZT Counter |  |
| +2.5 Volts monitor | 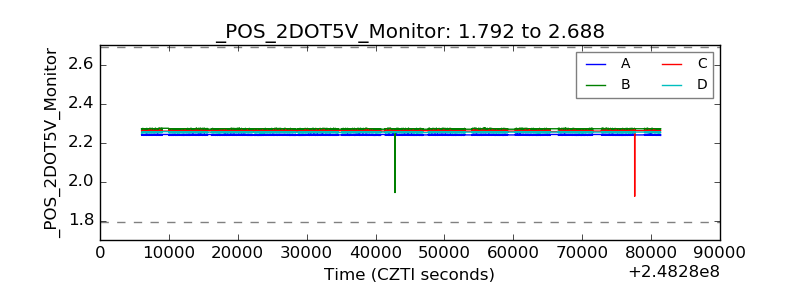 |
| +5 Volts monitor |  |
| _ROLL_ROT |  |
| _Roll_DEC | 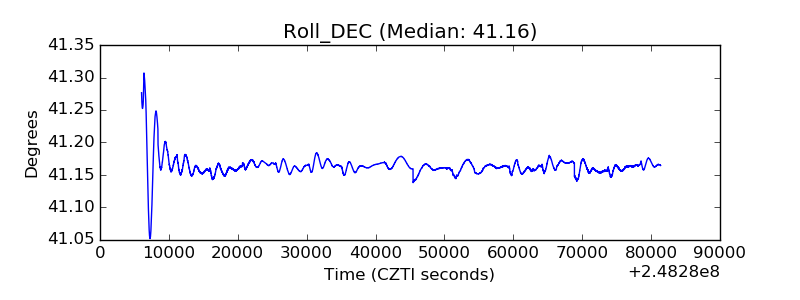 |
| _Roll_RA |  |
| Veto Counter |  |