| Param | Original file | Final file |
|---|---|---|
| Filename | modeM0/AS1A04_021T06_9000001688_11511cztM0_level2.evt | modeM0/AS1A04_021T06_9000001688_11511cztM0_level2_quad_clean.evt |
| Size (bytes) | 688,394,880 | 109,005,120 |
| Size | 656.5 MB | 104.0 MB |
| Events in quadrant A | 6,931,952 | 643,280 |
| Events in quadrant B | 4,971,946 | 690,294 |
| Events in quadrant C | 3,642,378 | 740,497 |
| Events in quadrant D | 4,777,357 | 687,843 |
| Mode M0 | |||
|---|---|---|---|
| Quadrant | BADHDUFLAG | Total packets | Discarded packets |
| A | 0 | 25958 | 3 |
| B | 0 | 19882 | 2 |
| C | 0 | 16271 | 2 |
| D | 0 | 19581 | 2 |
| Mode SS | |||
|---|---|---|---|
| Quadrant | BADHDUFLAG | Total packets | Discarded packets |
| A | 0 | 160 | 0 |
| B | 0 | 160 | 0 |
| C | 0 | 160 | 0 |
| D | 0 | 160 | 0 |
| Mode M9 | |||
|---|---|---|---|
| Quadrant | BADHDUFLAG | Total packets | Discarded packets |
| A | 0 | 8 | 0 |
| B | 0 | 8 | 0 |
| C | 0 | 8 | 0 |
| D | 0 | 8 | 0 |
| Quadrant | Total seconds | Saturated seconds | Saturation percentage |
|---|---|---|---|
| A | 7750 | 1021 | 13.174194% |
| B | 7750 | 399 | 5.148387% |
| C | 7750 | 76 | 0.980645% |
| D | 7750 | 292 | 3.767742% |
Noise dominated data is calculated using 1-second bins in cleaned event files. If a bin has >2000 counts, and if more than 50% of those come from <1% of pixels, then it is considered to be noise-dominated and hence unusable.
| Quadrant | # 1 sec bins | Bins with >0 counts | Bins with >2000 counts | High rate bins dominated by noise | Noise dominated (total time) | Noise dominated (detector-on time) | Marked lightcurve |
|---|---|---|---|---|---|---|---|
| A | 8471 | 7755 | 498 | 498 | 5.88% | 6.42% | 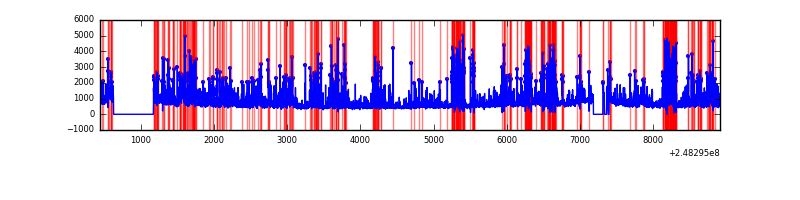 |
| B | 8471 | 7755 | 142 | 142 | 1.68% | 1.83% | 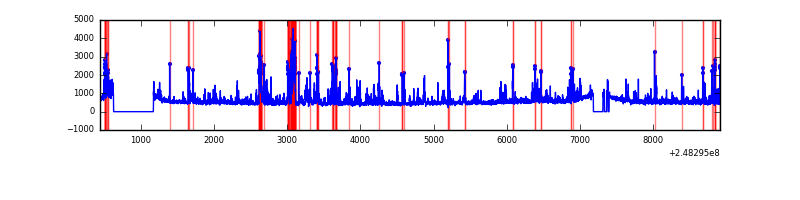 |
| C | 8471 | 7755 | 0 | 0 | 0.00% | 0.00% | 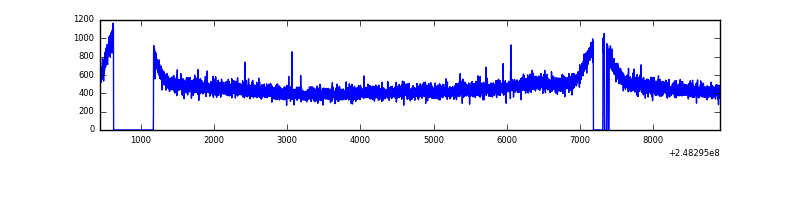 |
| D | 8471 | 7755 | 175 | 175 | 2.07% | 2.26% | 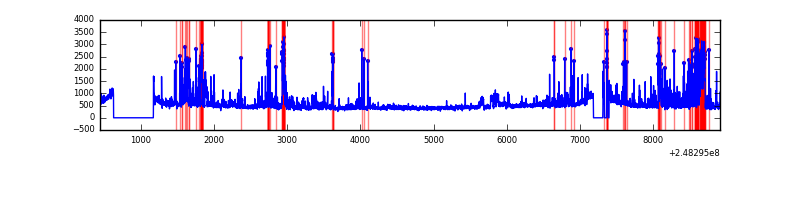 |
Top three noisy pixels from each quadrant. If the there are fewer than three noisy pixels in the level2.evt file, extra rows are filled as -1
| Pixel properties | Quadrant properties | ||||||
|---|---|---|---|---|---|---|---|
| Quadrant | DetID | PixID | Counts | Sigma | Mean | Median | Sigma |
| A | 8 | 5 | 2802471 | 15550.08 | 887 | 868 | 180.2 |
| A | 15 | 223 | 211350 | 1168.26 | 887 | 868 | 180.2 |
| A | 14 | 238 | 172820 | 954.41 | 887 | 868 | 180.2 |
| B | 4 | 239 | 658278 | 3679.57 | 930 | 904 | 178.7 |
| B | 11 | 51 | 233803 | 1303.62 | 930 | 904 | 178.7 |
| B | 3 | 64 | 189343 | 1054.76 | 930 | 904 | 178.7 |
| C | 13 | 61 | 6932 | 27.15 | 932 | 937 | 220.8 |
| C | 14 | 234 | 3417 | 11.23 | 932 | 937 | 220.8 |
| C | 8 | 128 | 3241 | 10.43 | 932 | 937 | 220.8 |
| D | 1 | 52 | 437143 | 1946.56 | 920 | 895 | 224.1 |
| D | 2 | 120 | 320689 | 1426.94 | 920 | 895 | 224.1 |
| D | 10 | 253 | 178427 | 792.16 | 920 | 895 | 224.1 |
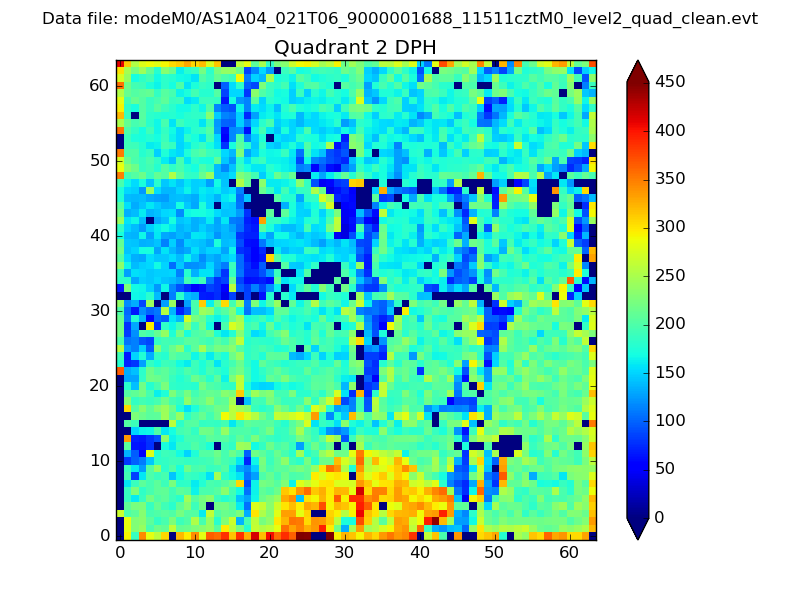
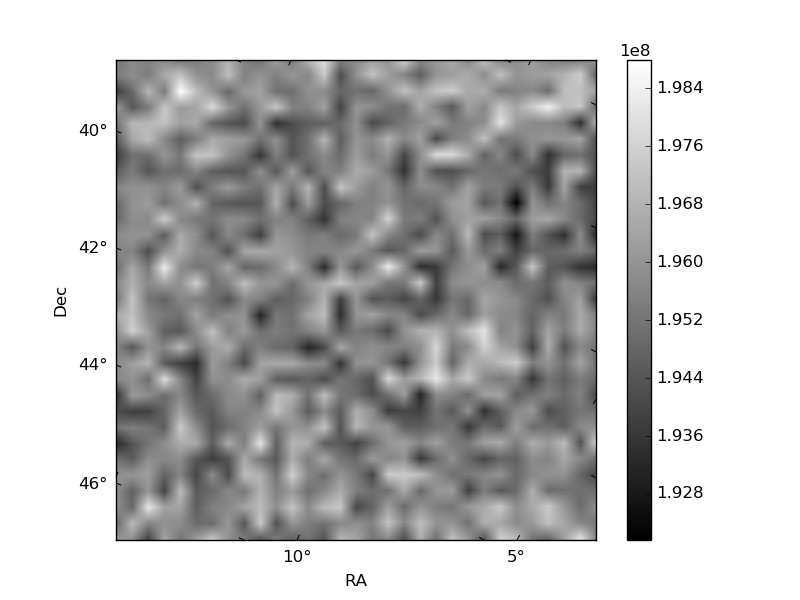
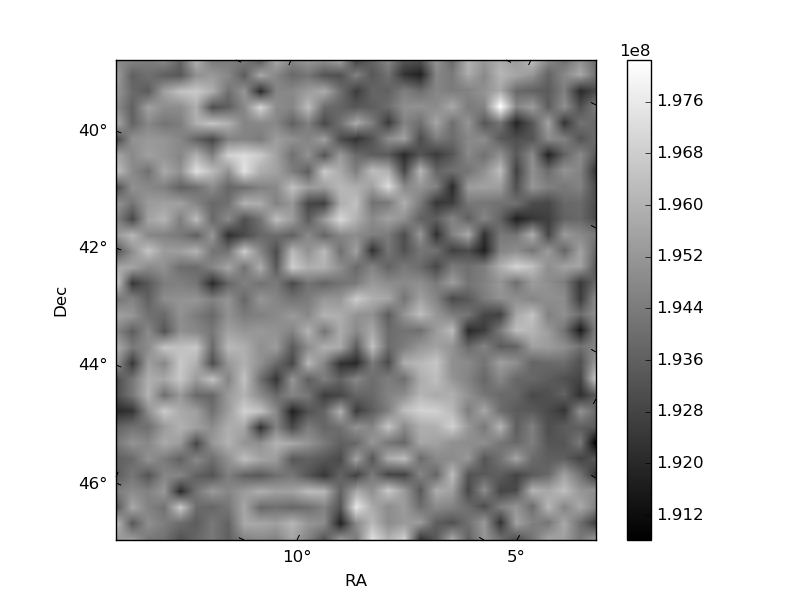
Histogram calculated using DETX and DETY for each event in the final _common_clean file
| Quadrant A | 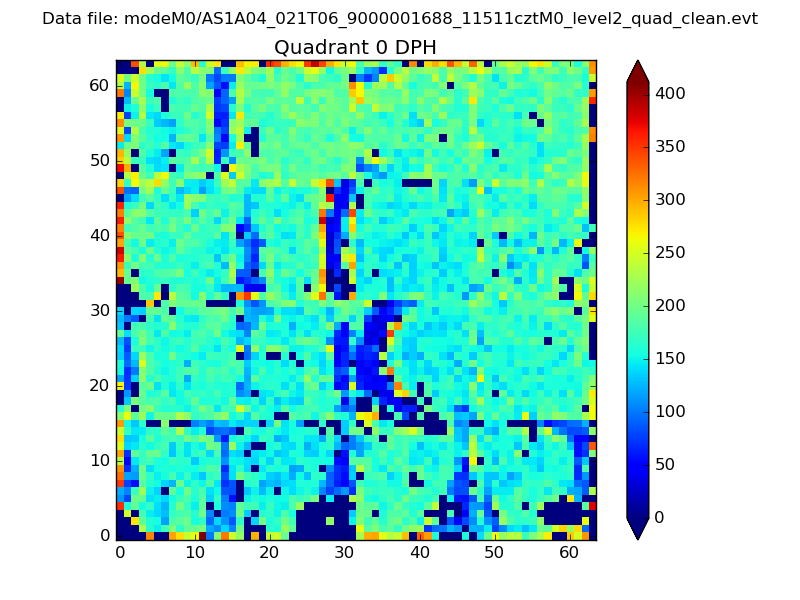 |
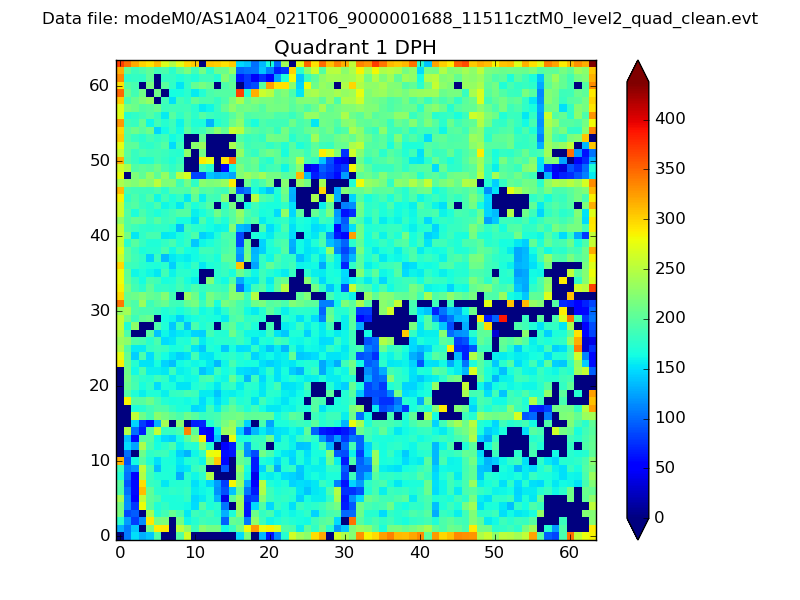 |
Quadrant B |
|---|---|---|---|
| Quadrant D | 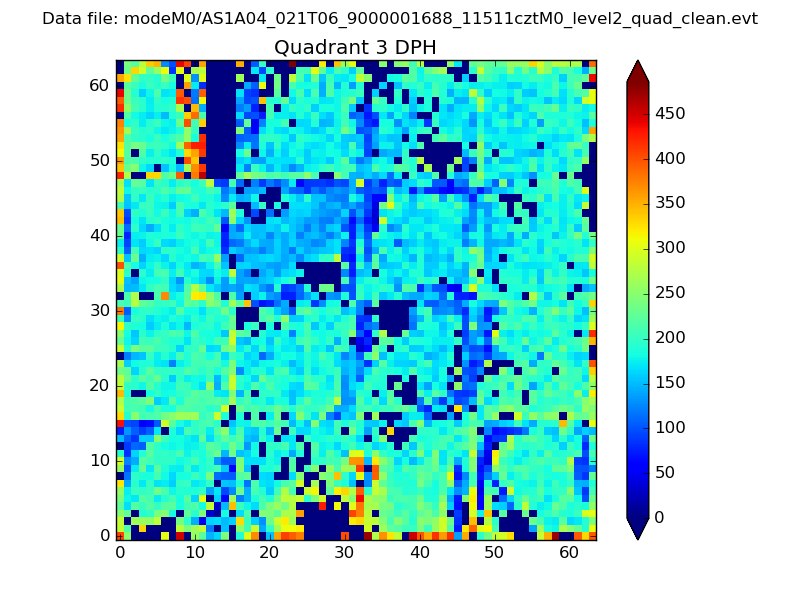 |
 |
Quadrant C |
| Plot type | Count rate plots | Images |
|---|---|---|
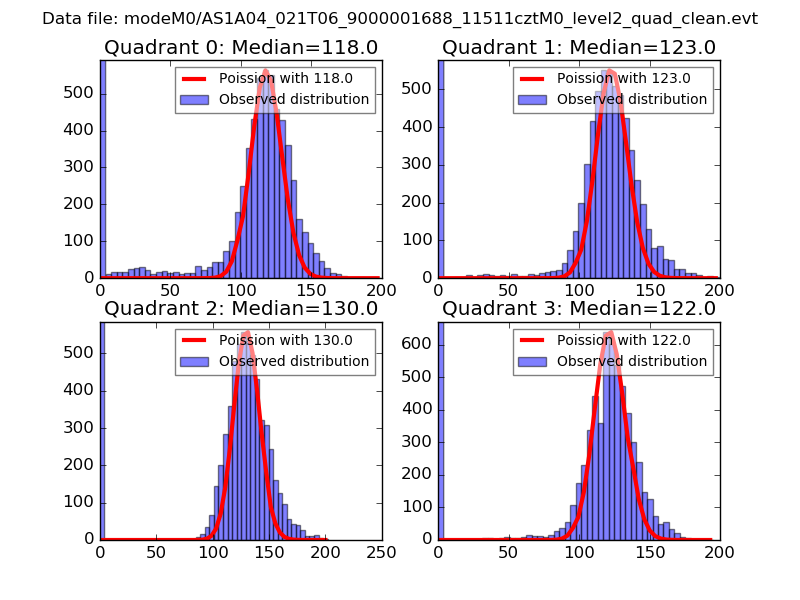
| Comparison with Poisson distribution Blue bars denote a histogram of data divided into 1 sec bins. Red curve is a Poisson curve with rate = median count rate of data. |
 |
 |
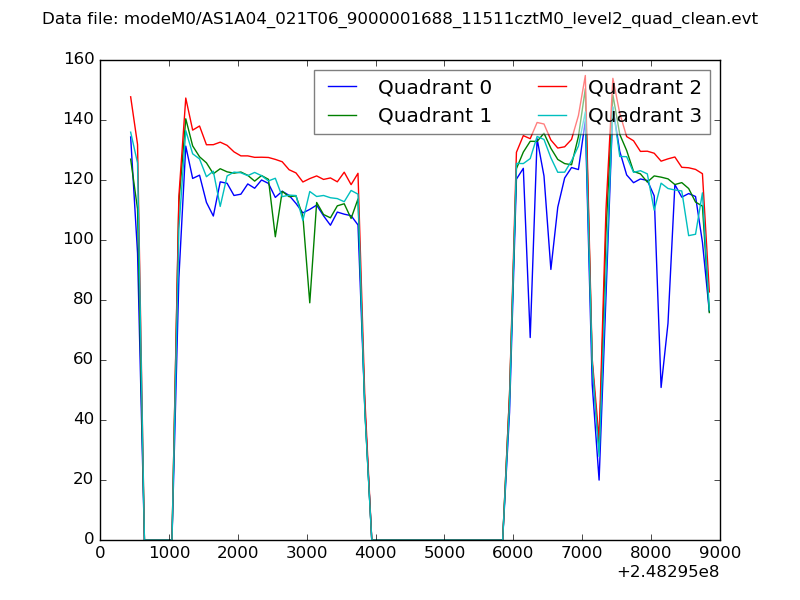
| Quadrant-wise count rates Data is divided into 100 sec bins |
 |
|
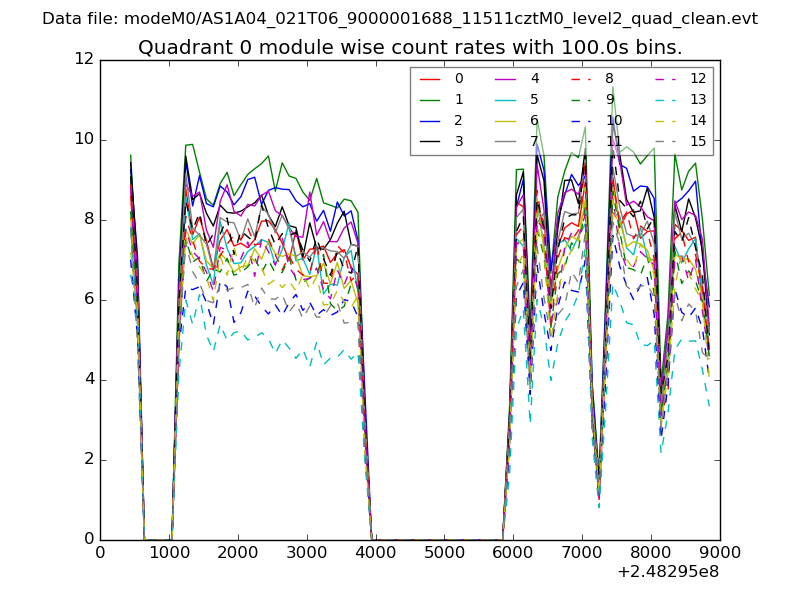
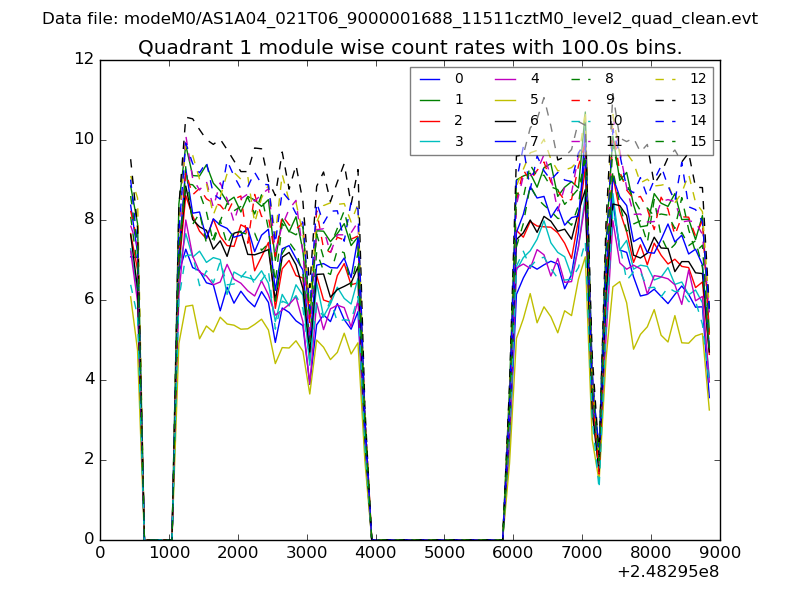
| Module-wise count rates for Quadrant A Data is divided into 100 sec bins |
 |
 |
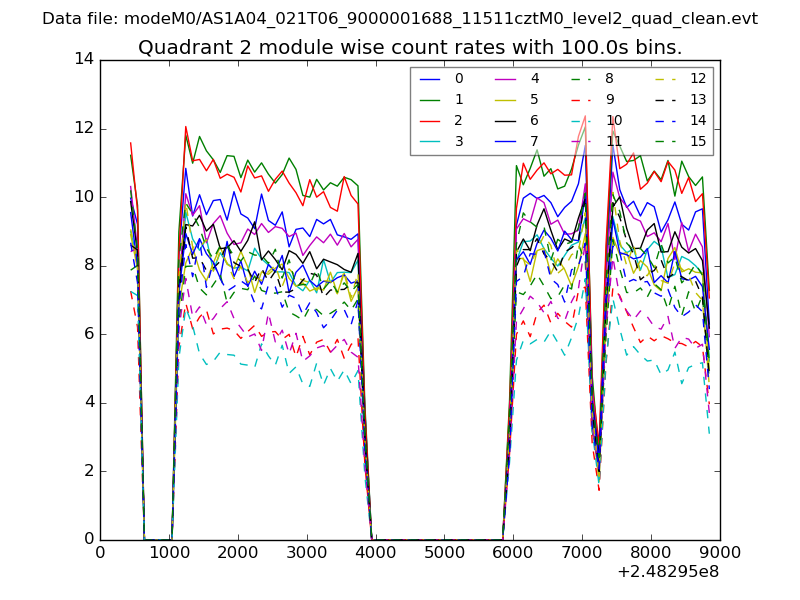
| Module-wise count rates for Quadrant B Data is divided into 100 sec bins |
 |
 |
| Module-wise count rates for Quadrant C Data is divided into 100 sec bins |
 |
 |
| Module-wise count rates for Quadrant D Data is divided into 100 sec bins |
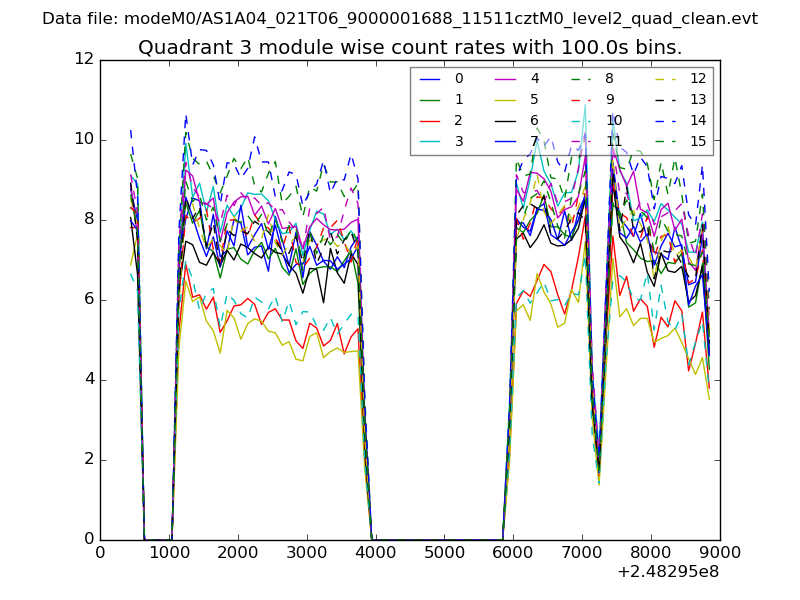 |
 |
| Parameter | Plot |
|---|---|
| CZT HV Monitor | 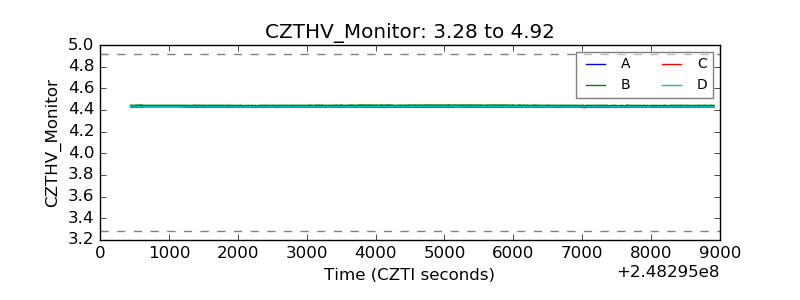 |
| D_VDD | 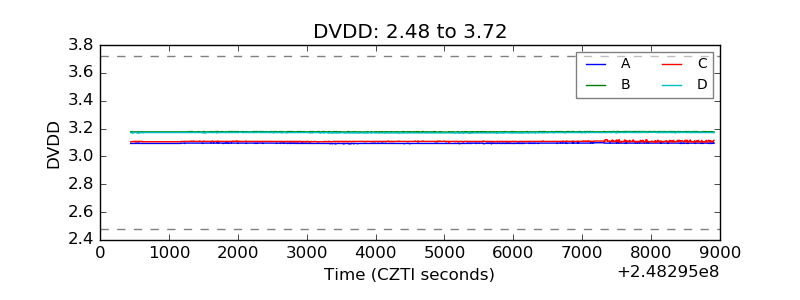 |
| Temperature 1 | 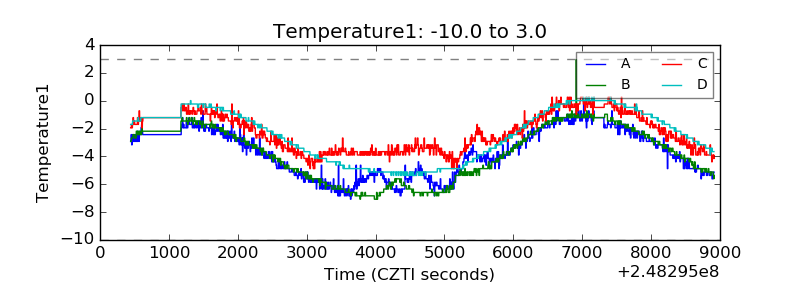 |
| Veto HV Monitor | 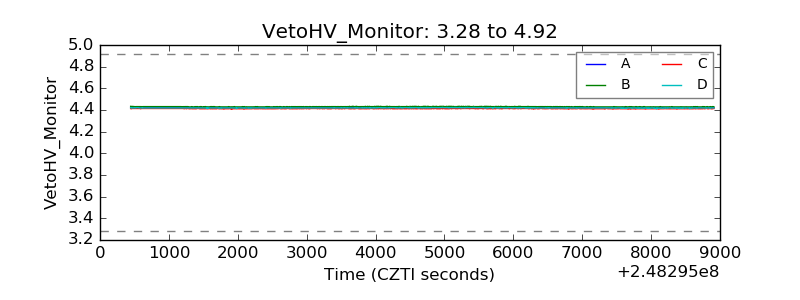 |
| Veto LLD | 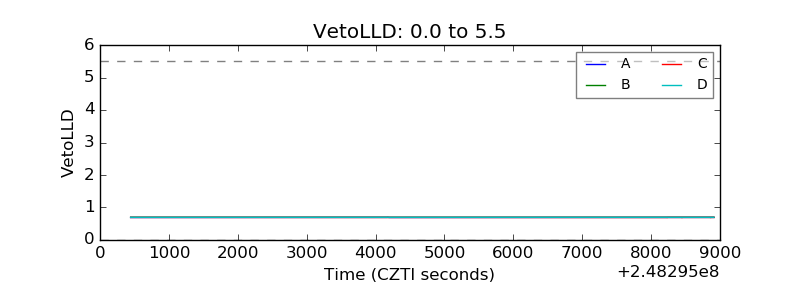 |
| Alpha Counter | 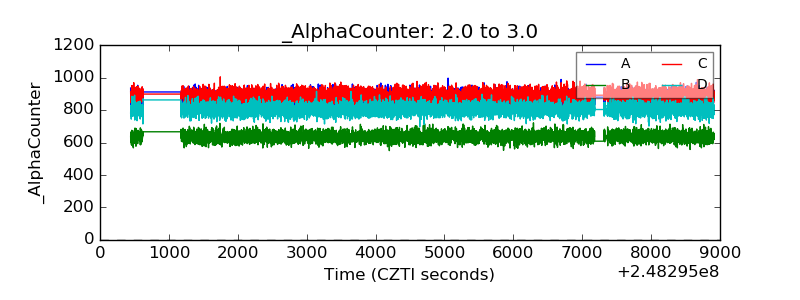 |
| _CPM_Rate | 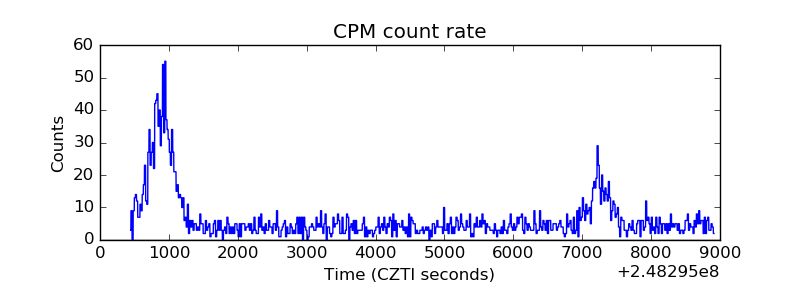 |
| CZT Counter | 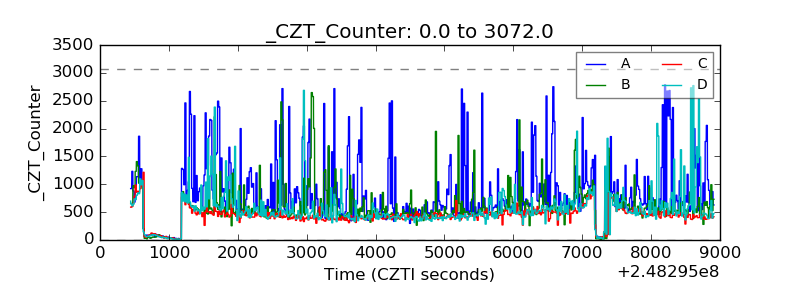 |
| +2.5 Volts monitor | 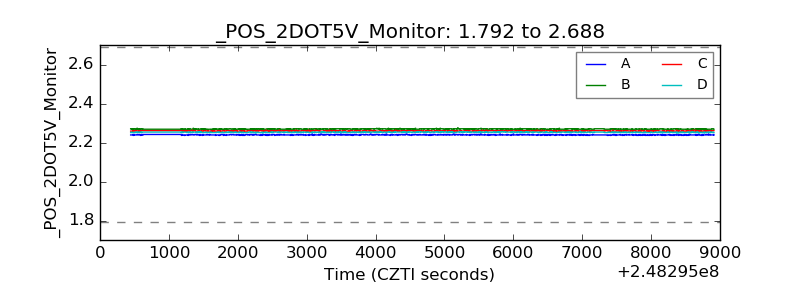 |
| +5 Volts monitor | 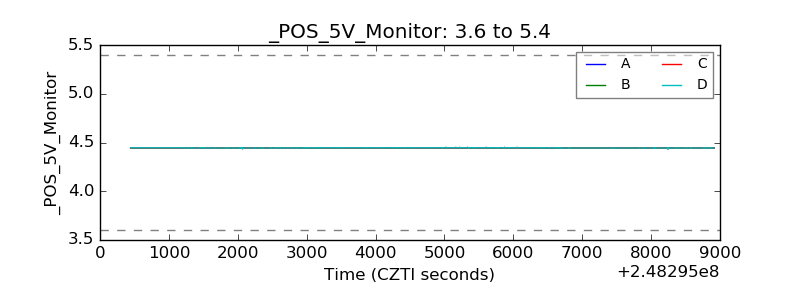 |
| _ROLL_ROT | 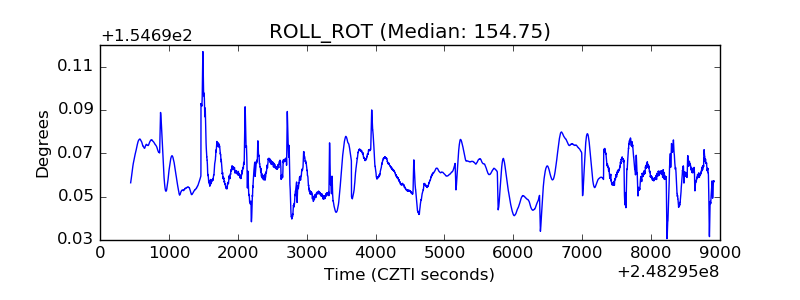 |
| _Roll_DEC | 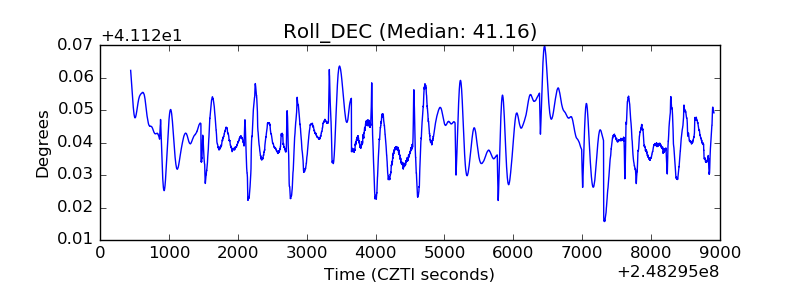 |
| _Roll_RA | 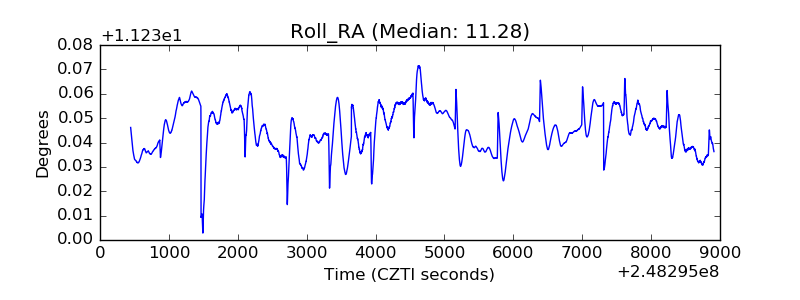 |
| Veto Counter | 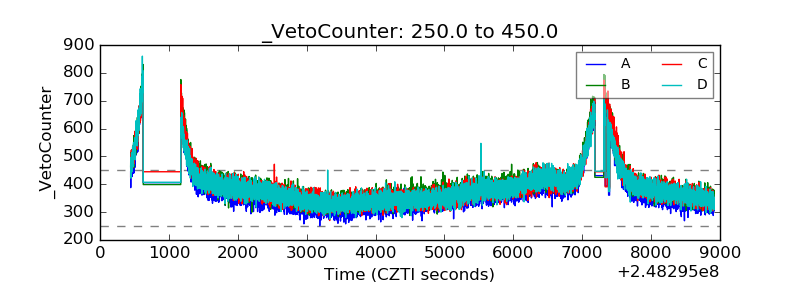 |