| Param | Original file | Final file |
|---|---|---|
| Filename | modeM0/AS1A04_021T06_9000001688_11512cztM0_level2.evt | modeM0/AS1A04_021T06_9000001688_11512cztM0_level2_quad_clean.evt |
| Size (bytes) | 717,330,240 | 115,718,400 |
| Size | 684.1 MB | 110.4 MB |
| Events in quadrant A | 7,217,454 | 696,157 |
| Events in quadrant B | 5,175,622 | 735,675 |
| Events in quadrant C | 3,829,779 | 784,090 |
| Events in quadrant D | 4,952,949 | 724,664 |
| Mode M0 | |||
|---|---|---|---|
| Quadrant | BADHDUFLAG | Total packets | Discarded packets |
| A | 0 | 27086 | 3 |
| B | 0 | 20844 | 2 |
| C | 0 | 17094 | 2 |
| D | 0 | 20495 | 2 |
| Mode SS | |||
|---|---|---|---|
| Quadrant | BADHDUFLAG | Total packets | Discarded packets |
| A | 0 | 166 | 0 |
| B | 0 | 166 | 0 |
| C | 0 | 166 | 0 |
| D | 0 | 166 | 0 |
| Mode M9 | |||
|---|---|---|---|
| Quadrant | BADHDUFLAG | Total packets | Discarded packets |
| A | 0 | 6 | 0 |
| B | 0 | 6 | 0 |
| C | 0 | 6 | 0 |
| D | 0 | 6 | 0 |
| Quadrant | Total seconds | Saturated seconds | Saturation percentage |
|---|---|---|---|
| A | 8116 | 994 | 12.247413% |
| B | 8116 | 393 | 4.842287% |
| C | 8116 | 68 | 0.837851% |
| D | 8116 | 308 | 3.794973% |
Noise dominated data is calculated using 1-second bins in cleaned event files. If a bin has >2000 counts, and if more than 50% of those come from <1% of pixels, then it is considered to be noise-dominated and hence unusable.
| Quadrant | # 1 sec bins | Bins with >0 counts | Bins with >2000 counts | High rate bins dominated by noise | Noise dominated (total time) | Noise dominated (detector-on time) | Marked lightcurve |
|---|---|---|---|---|---|---|---|
| A | 8552 | 8121 | 467 | 467 | 5.46% | 5.75% | 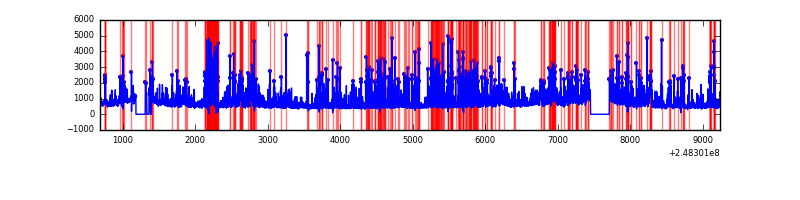 |
| B | 8552 | 8121 | 138 | 138 | 1.61% | 1.70% | 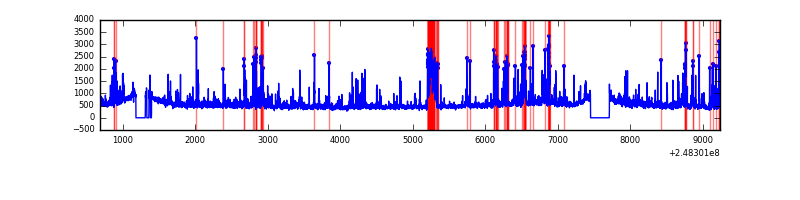 |
| C | 8552 | 8121 | 0 | 0 | 0.00% | 0.00% | 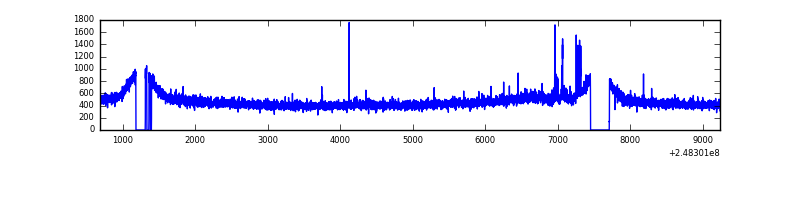 |
| D | 8552 | 8121 | 191 | 191 | 2.23% | 2.35% | 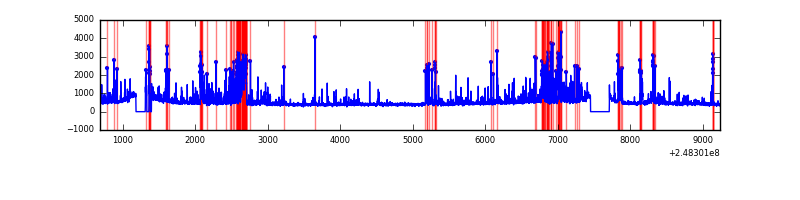 |
Top three noisy pixels from each quadrant. If the there are fewer than three noisy pixels in the level2.evt file, extra rows are filled as -1
| Pixel properties | Quadrant properties | ||||||
|---|---|---|---|---|---|---|---|
| Quadrant | DetID | PixID | Counts | Sigma | Mean | Median | Sigma |
| A | 8 | 5 | 2951327 | 15627.43 | 929 | 912 | 188.8 |
| A | 15 | 223 | 169917 | 895.17 | 929 | 912 | 188.8 |
| A | 14 | 238 | 120982 | 635.97 | 929 | 912 | 188.8 |
| B | 4 | 239 | 754846 | 4060.19 | 968 | 941 | 185.7 |
| B | 11 | 51 | 231986 | 1244.3 | 968 | 941 | 185.7 |
| B | 3 | 64 | 185858 | 995.88 | 968 | 941 | 185.7 |
| C | 0 | 207 | 46458 | 199.63 | 965 | 972 | 227.9 |
| C | 8 | 128 | 9616 | 37.94 | 965 | 972 | 227.9 |
| C | 13 | 61 | 7133 | 27.04 | 965 | 972 | 227.9 |
| D | 1 | 52 | 491230 | 2146.72 | 947 | 921 | 228.4 |
| D | 10 | 253 | 278216 | 1214.08 | 947 | 921 | 228.4 |
| D | 2 | 120 | 221818 | 967.15 | 947 | 921 | 228.4 |
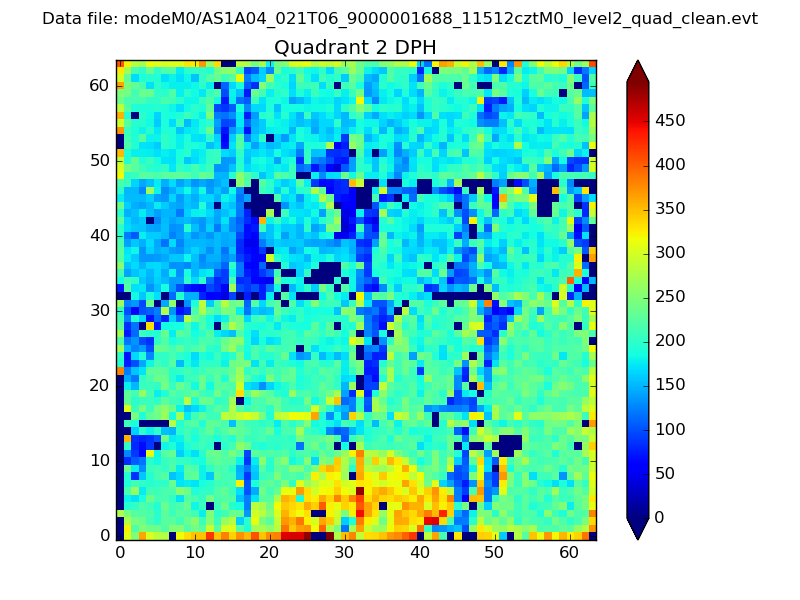
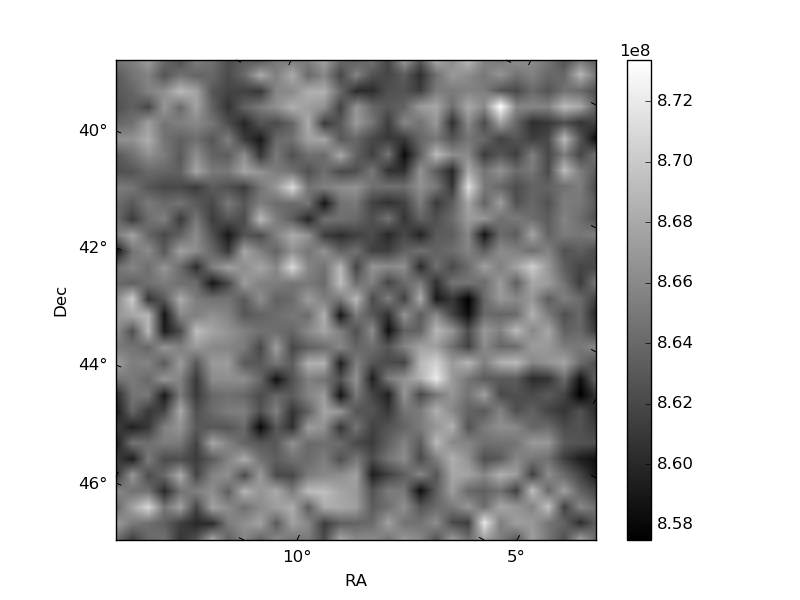
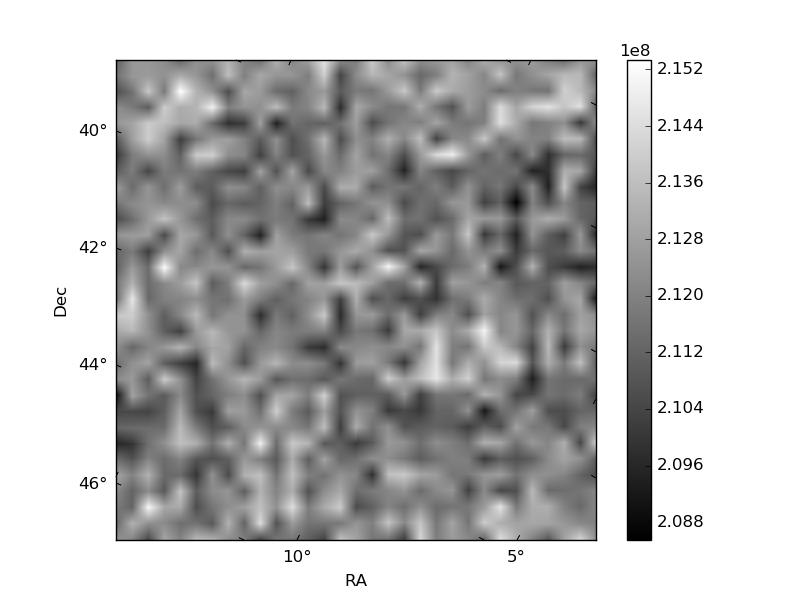
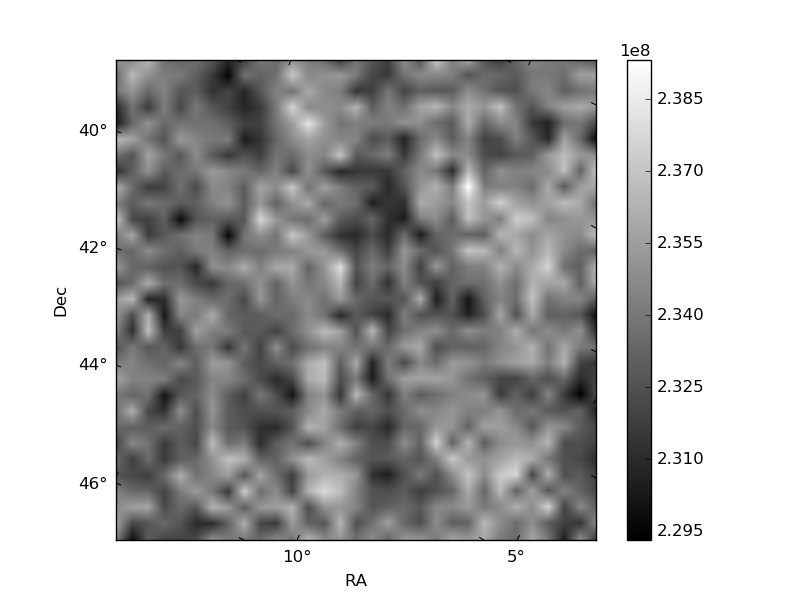
Histogram calculated using DETX and DETY for each event in the final _common_clean file
| Quadrant A | 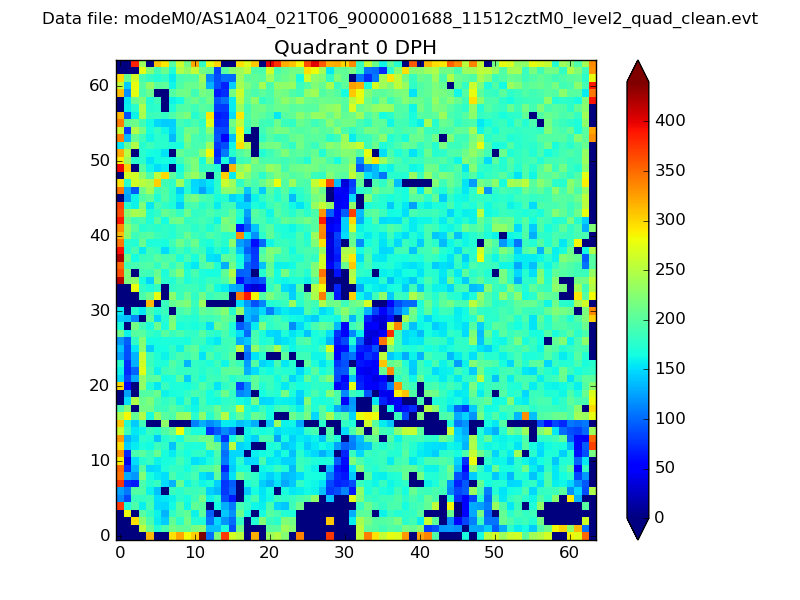 |
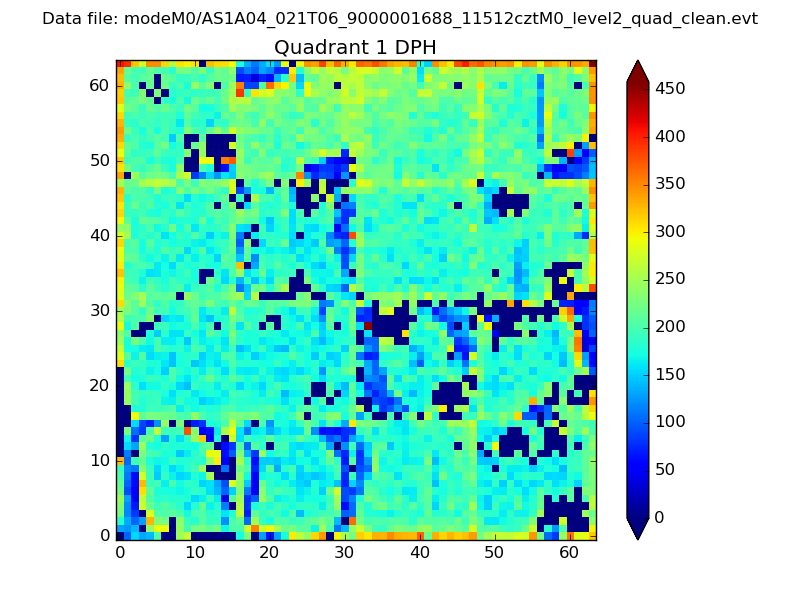 |
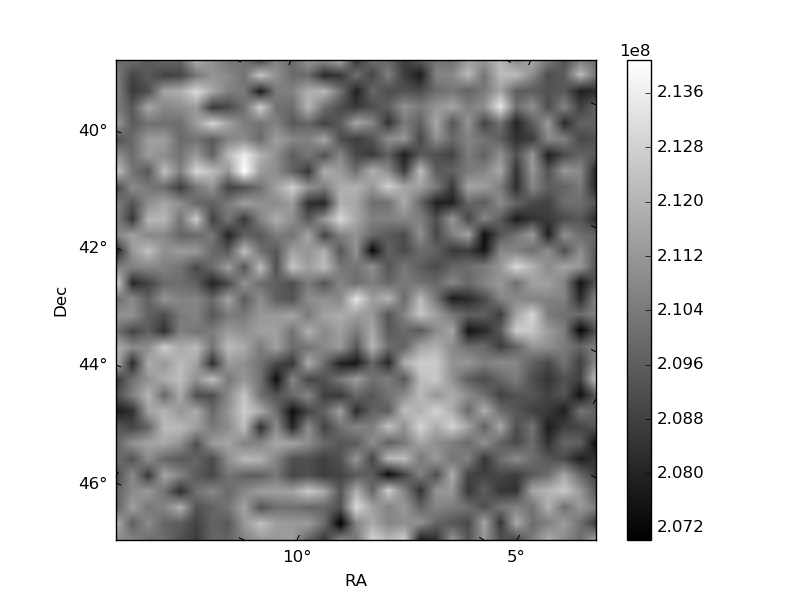
Quadrant B |
|---|---|---|---|
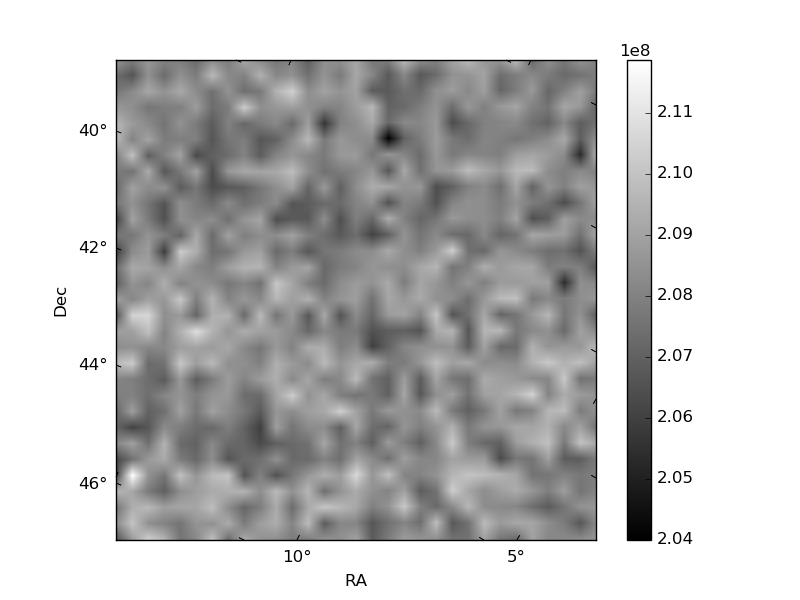
| Quadrant D | 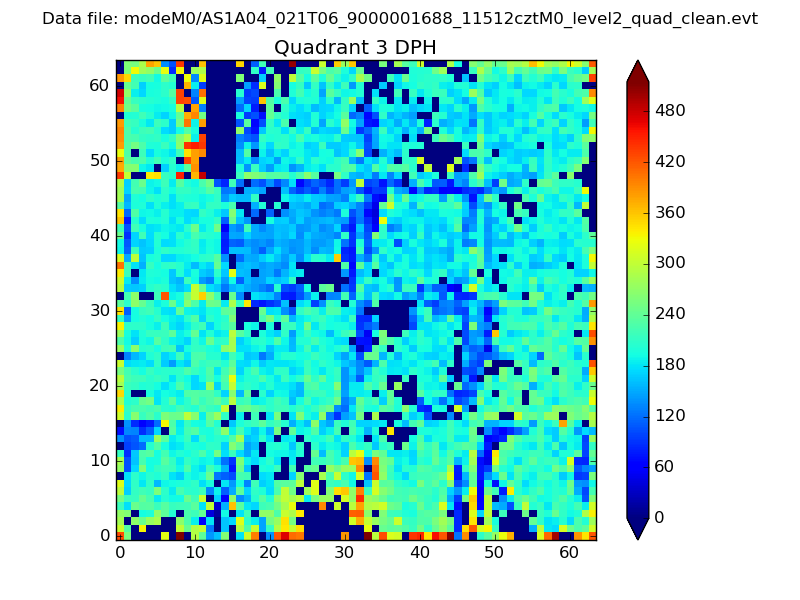 |
 |
Quadrant C |
| Plot type | Count rate plots | Images |
|---|---|---|
| Comparison with Poisson distribution Blue bars denote a histogram of data divided into 1 sec bins. Red curve is a Poisson curve with rate = median count rate of data. |
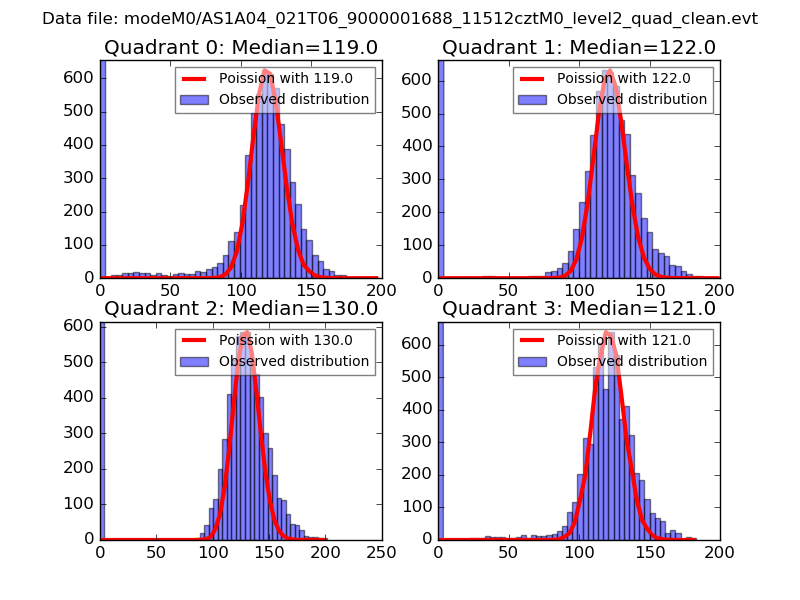 |
 |
| Quadrant-wise count rates Data is divided into 100 sec bins |
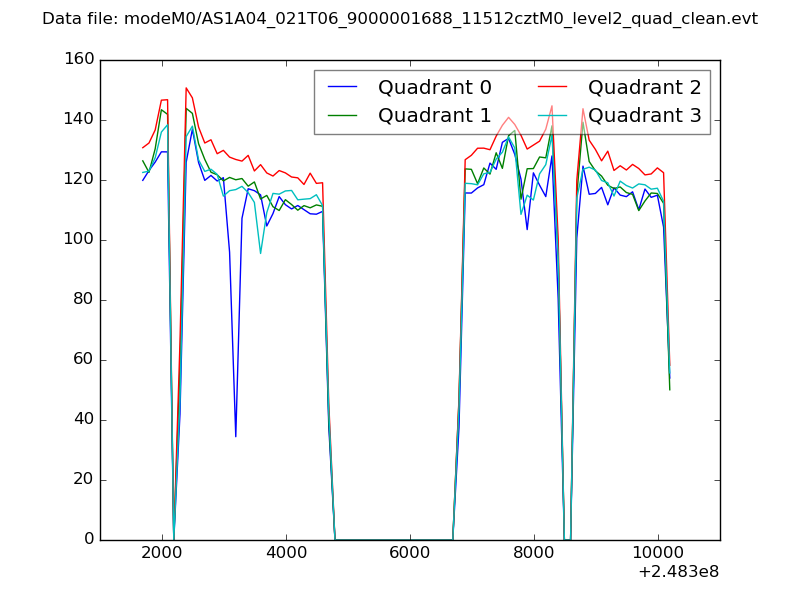 |
|
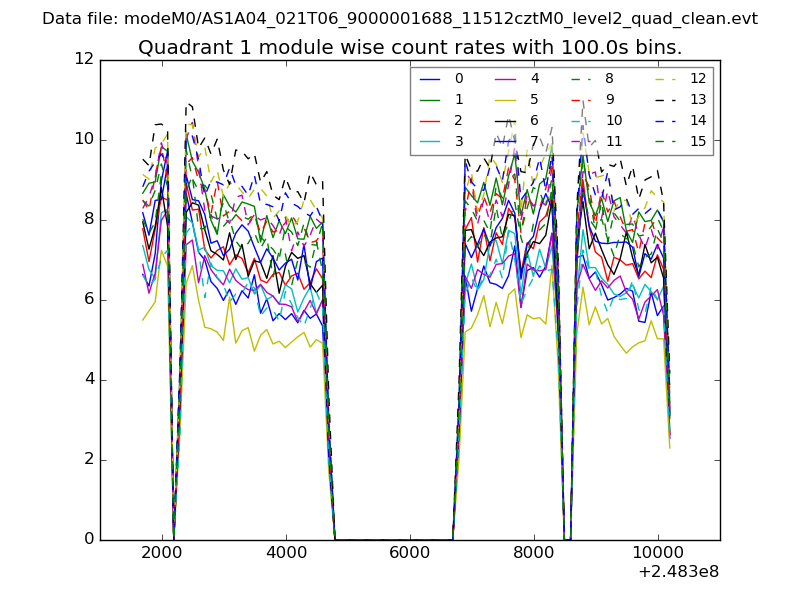
| Module-wise count rates for Quadrant A Data is divided into 100 sec bins |
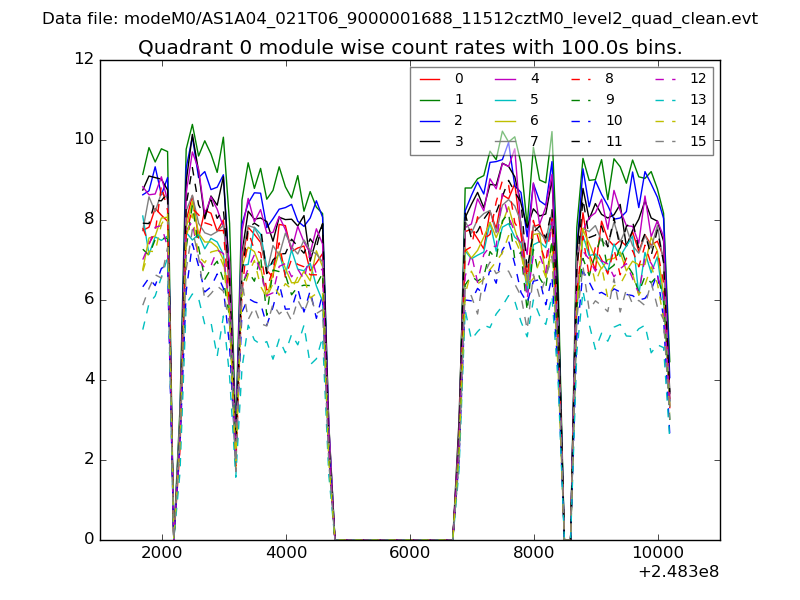 |
 |
| Module-wise count rates for Quadrant B Data is divided into 100 sec bins |
 |
 |
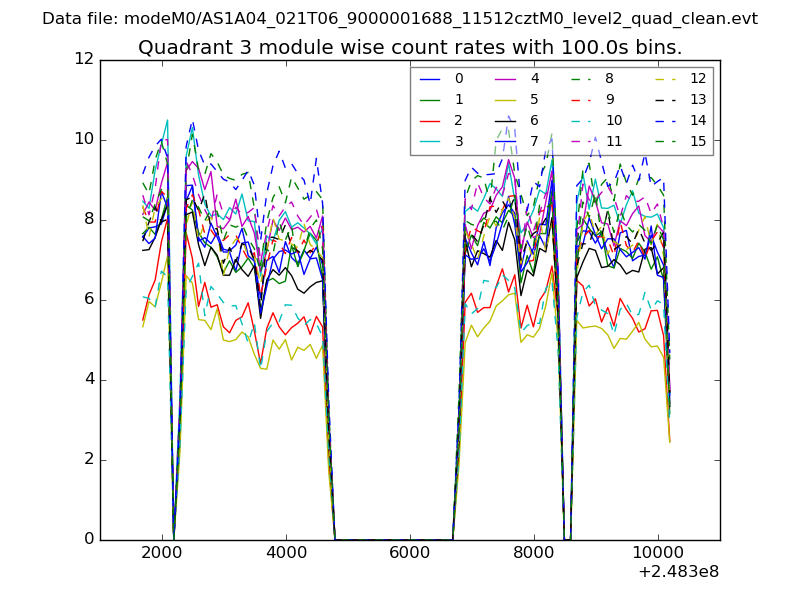
| Module-wise count rates for Quadrant C Data is divided into 100 sec bins |
 |
 |
| Module-wise count rates for Quadrant D Data is divided into 100 sec bins |
 |
 |
| Parameter | Plot |
|---|---|
| CZT HV Monitor |  |
| D_VDD | 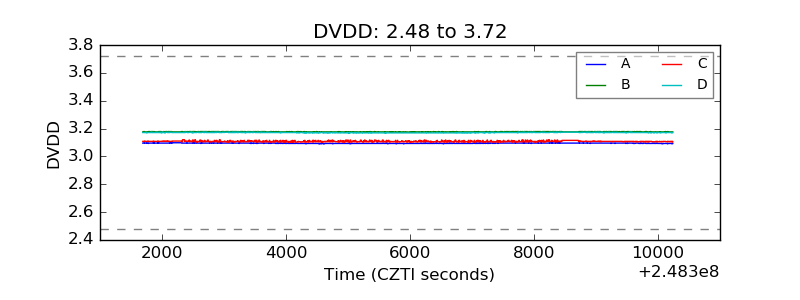 |
| Temperature 1 | 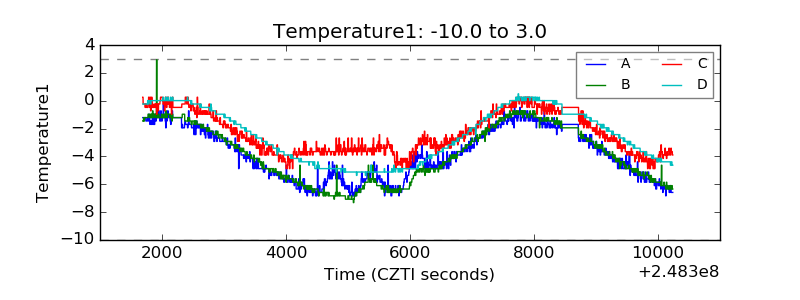 |
| Veto HV Monitor | 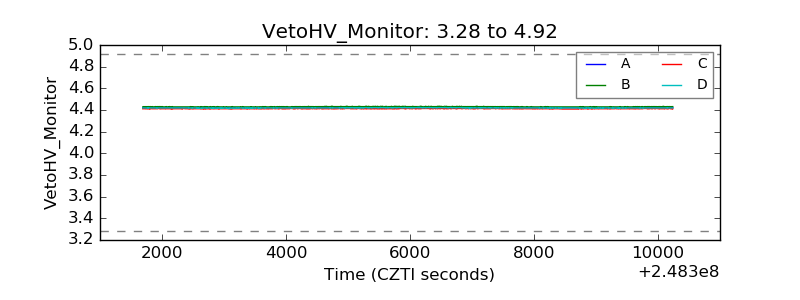 |
| Veto LLD | 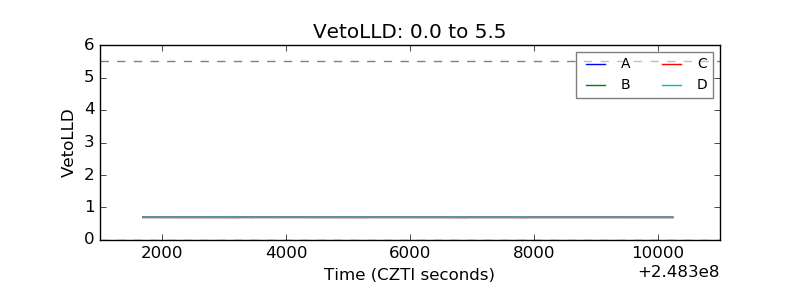 |
| Alpha Counter | 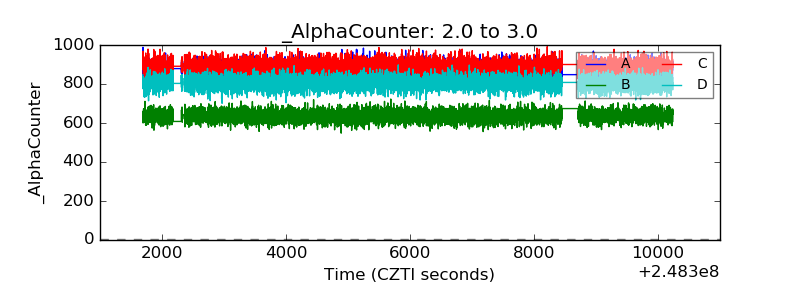 |
| _CPM_Rate | 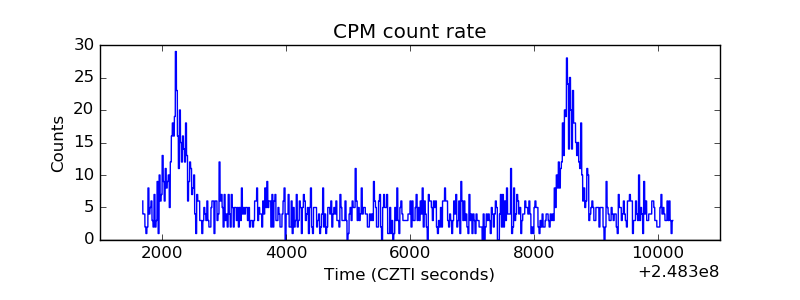 |
| CZT Counter | 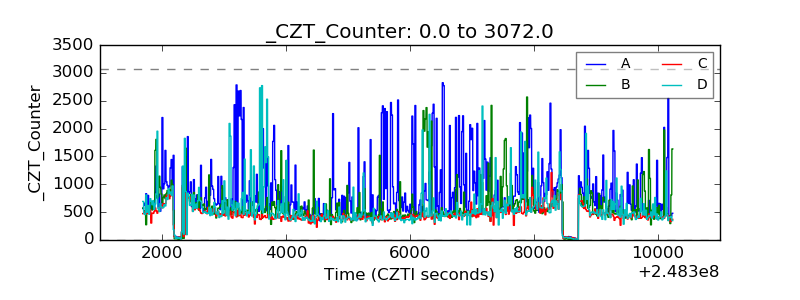 |
| +2.5 Volts monitor |  |
| +5 Volts monitor |  |
| _ROLL_ROT | 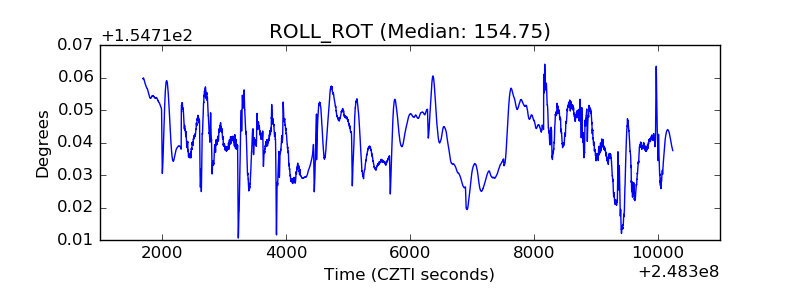 |
| _Roll_DEC | 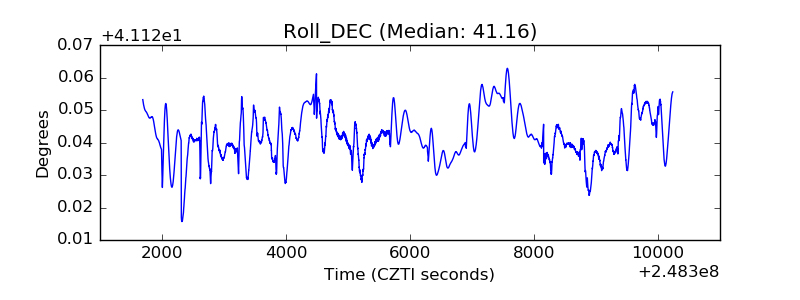 |
| _Roll_RA | 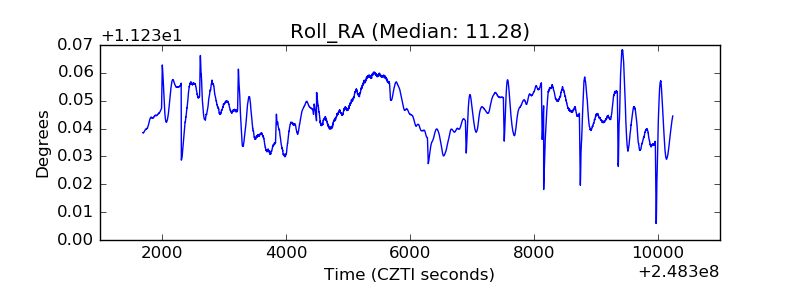 |
| Veto Counter |  |