| Param | Original file | Final file |
|---|---|---|
| Filename | modeM0/AS1A04_021T06_9000001688_11515cztM0_level2.evt | modeM0/AS1A04_021T06_9000001688_11515cztM0_level2_quad_clean.evt |
| Size (bytes) | 1,722,542,400 | 229,196,160 |
| Size | 1.6 GB | 218.6 MB |
| Events in quadrant A | 19,902,052 | 1,234,715 |
| Events in quadrant B | 12,191,430 | 1,407,825 |
| Events in quadrant C | 8,720,969 | 1,537,941 |
| Events in quadrant D | 10,060,662 | 1,439,433 |
| Mode M0 | |||
|---|---|---|---|
| Quadrant | BADHDUFLAG | Total packets | Discarded packets |
| A | 0 | 72239 | 5 |
| B | 0 | 49334 | 4 |
| C | 0 | 39326 | 4 |
| D | 0 | 43662 | 4 |
| Mode SS | |||
|---|---|---|---|
| Quadrant | BADHDUFLAG | Total packets | Discarded packets |
| A | 0 | 392 | 0 |
| B | 0 | 392 | 0 |
| C | 0 | 392 | 0 |
| D | 0 | 392 | 0 |
| Mode M9 | |||
|---|---|---|---|
| Quadrant | BADHDUFLAG | Total packets | Discarded packets |
| A | 0 | 21 | 0 |
| B | 0 | 21 | 0 |
| C | 0 | 21 | 0 |
| D | 0 | 21 | 0 |
| Quadrant | Total seconds | Saturated seconds | Saturation percentage |
|---|---|---|---|
| A | 19156 | 4169 | 21.763416% |
| B | 19156 | 982 | 5.126331% |
| C | 19156 | 59 | 0.307997% |
| D | 19156 | 291 | 1.519106% |
Noise dominated data is calculated using 1-second bins in cleaned event files. If a bin has >2000 counts, and if more than 50% of those come from <1% of pixels, then it is considered to be noise-dominated and hence unusable.
| Quadrant | # 1 sec bins | Bins with >0 counts | Bins with >2000 counts | High rate bins dominated by noise | Noise dominated (total time) | Noise dominated (detector-on time) | Marked lightcurve |
|---|---|---|---|---|---|---|---|
| A | 21262 | 19156 | 2441 | 2441 | 11.48% | 12.74% | 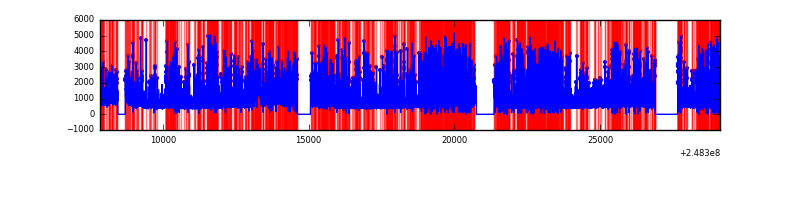 |
| B | 21262 | 19161 | 494 | 494 | 2.32% | 2.58% | 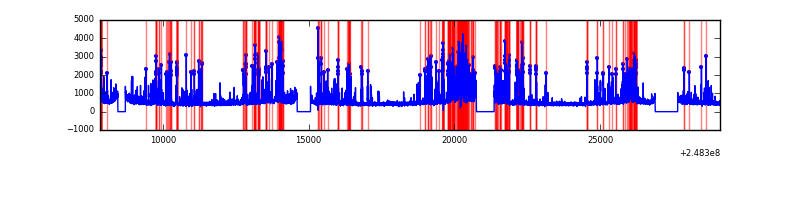 |
| C | 21262 | 19161 | 2 | 2 | 0.01% | 0.01% | 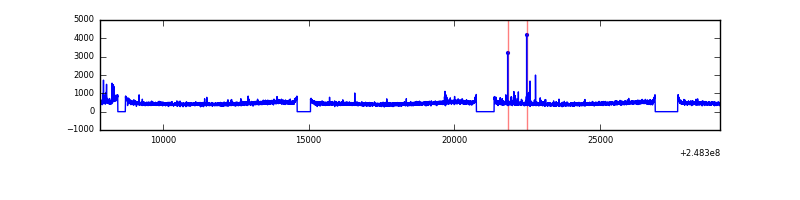 |
| D | 21262 | 19161 | 175 | 175 | 0.82% | 0.91% | 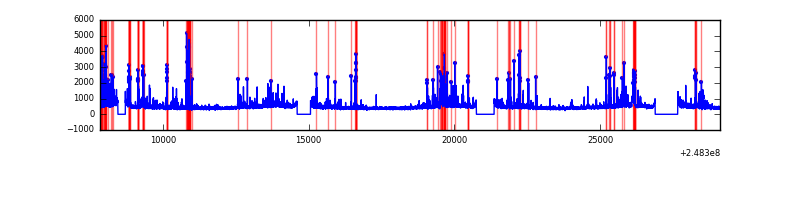 |
Top three noisy pixels from each quadrant. If the there are fewer than three noisy pixels in the level2.evt file, extra rows are filled as -1
| Pixel properties | Quadrant properties | ||||||
|---|---|---|---|---|---|---|---|
| Quadrant | DetID | PixID | Counts | Sigma | Mean | Median | Sigma |
| A | 8 | 5 | 11464875 | 29082.07 | 1961 | 1922 | 394.2 |
| A | 15 | 223 | 208777 | 524.8 | 1961 | 1922 | 394.2 |
| A | 1 | 162 | 117897 | 294.23 | 1961 | 1922 | 394.2 |
| B | 4 | 239 | 2050759 | 4919.27 | 2193 | 2137 | 416.4 |
| B | 3 | 64 | 1028933 | 2465.6 | 2193 | 2137 | 416.4 |
| B | 15 | 204 | 270975 | 645.55 | 2193 | 2137 | 416.4 |
| C | 7 | 87 | 57772 | 108.18 | 2210 | 2225 | 513.4 |
| C | 0 | 207 | 46899 | 87.01 | 2210 | 2225 | 513.4 |
| C | 13 | 61 | 15852 | 26.54 | 2210 | 2225 | 513.4 |
| D | 2 | 120 | 371769 | 708.85 | 2177 | 2114 | 521.5 |
| D | 13 | 104 | 354141 | 675.05 | 2177 | 2114 | 521.5 |
| D | 10 | 253 | 323994 | 617.24 | 2177 | 2114 | 521.5 |
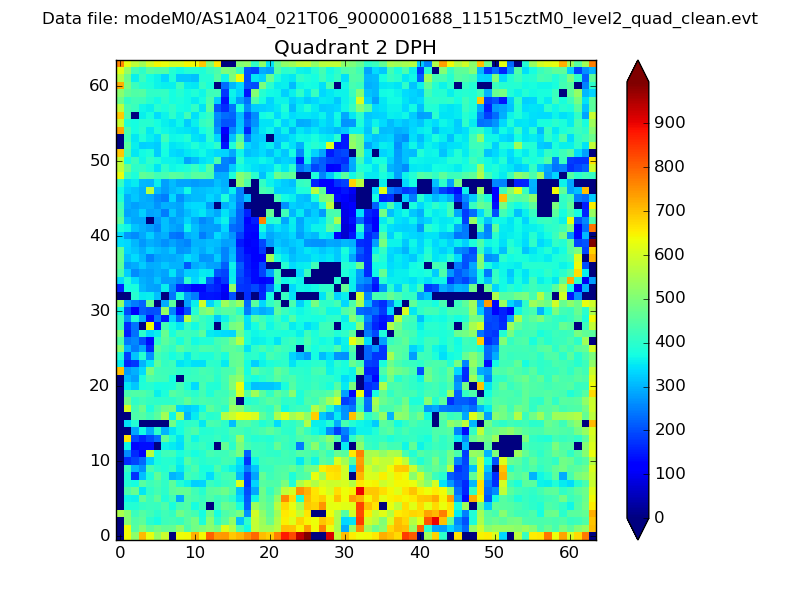
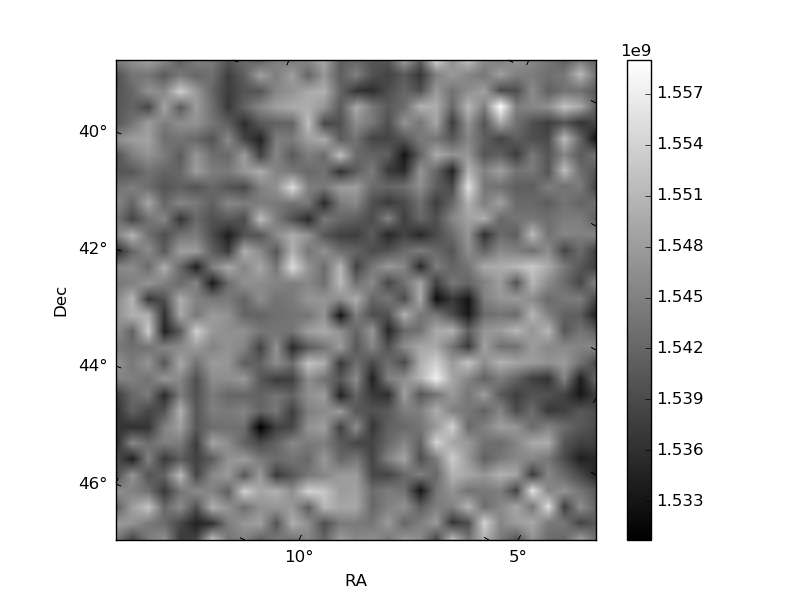
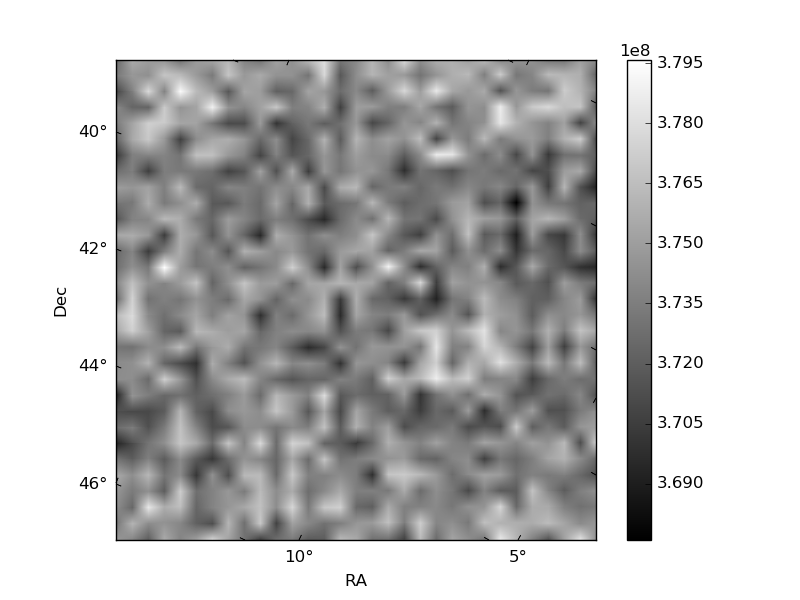
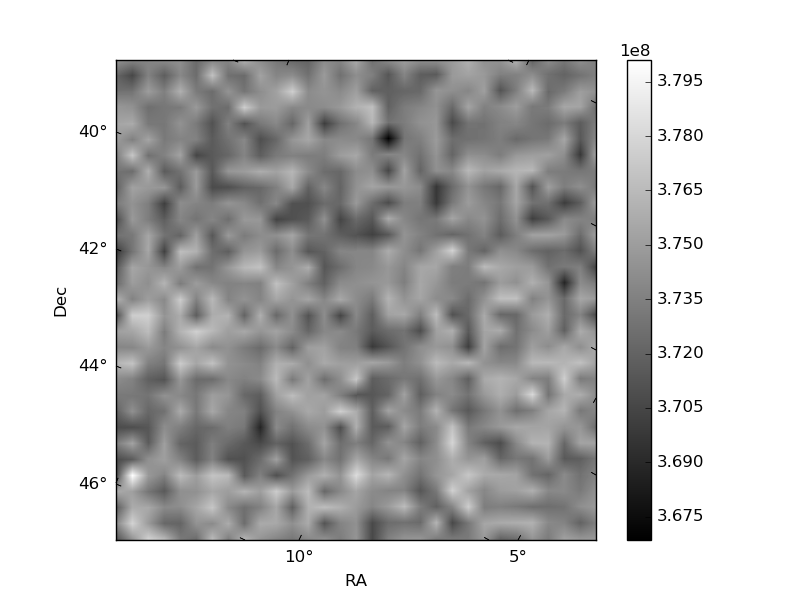
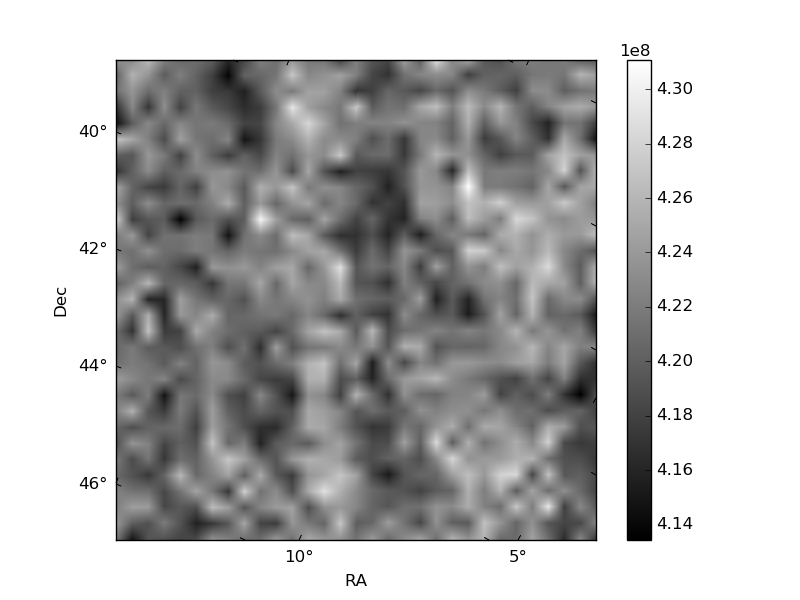
Histogram calculated using DETX and DETY for each event in the final _common_clean file
| Quadrant A | 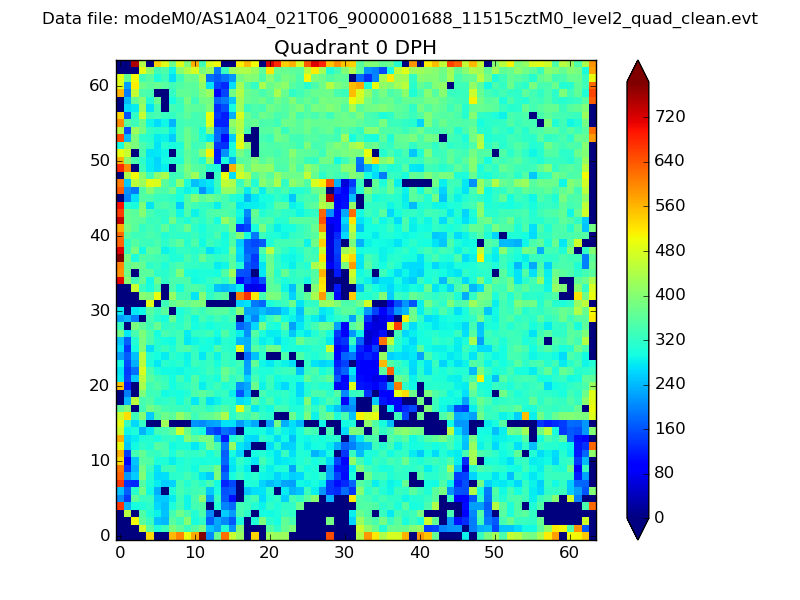 |
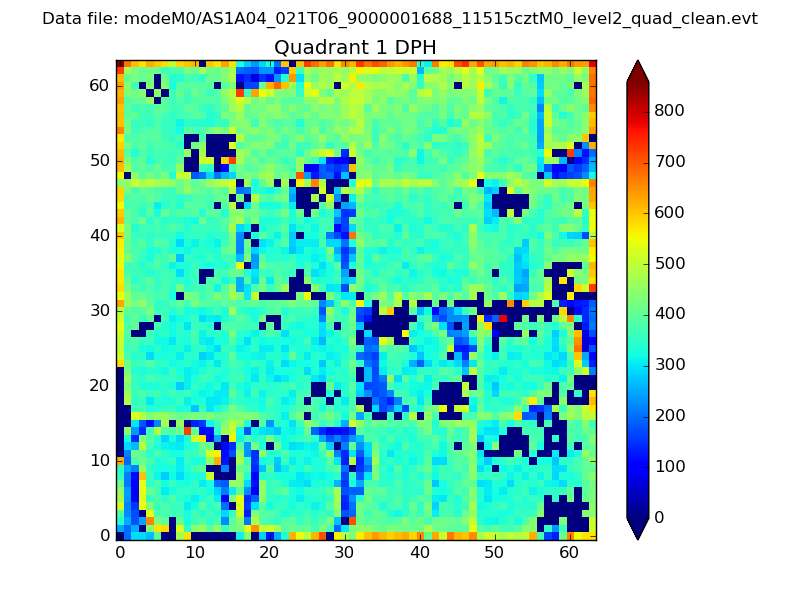 |
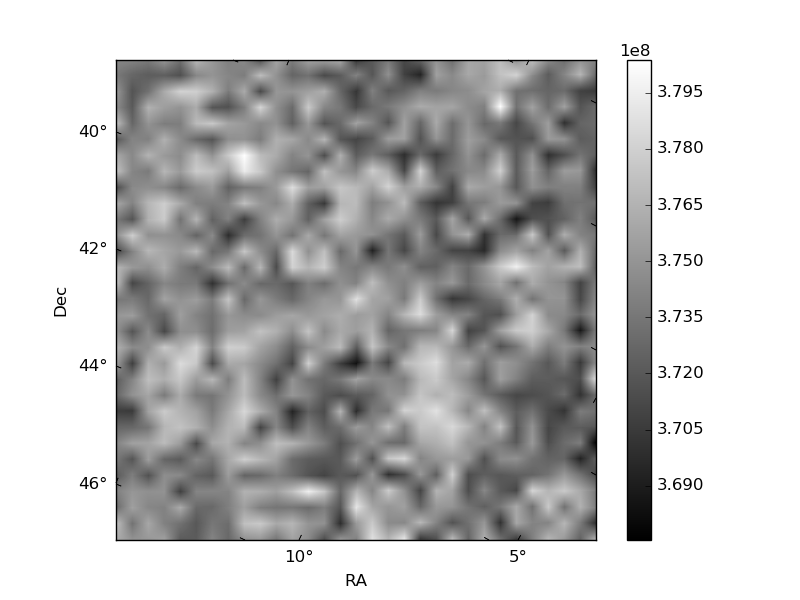
Quadrant B |
|---|---|---|---|
| Quadrant D | 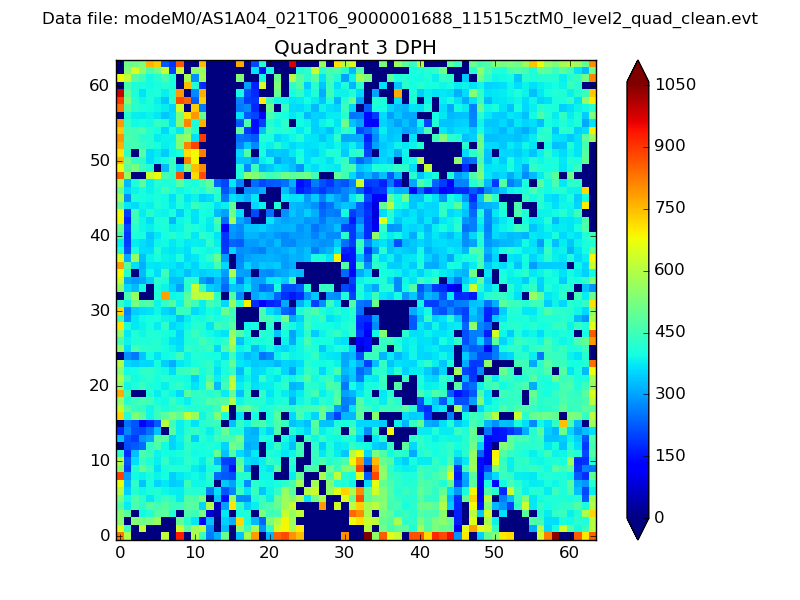 |
 |
Quadrant C |
| Plot type | Count rate plots | Images |
|---|---|---|
| Comparison with Poisson distribution Blue bars denote a histogram of data divided into 1 sec bins. Red curve is a Poisson curve with rate = median count rate of data. |
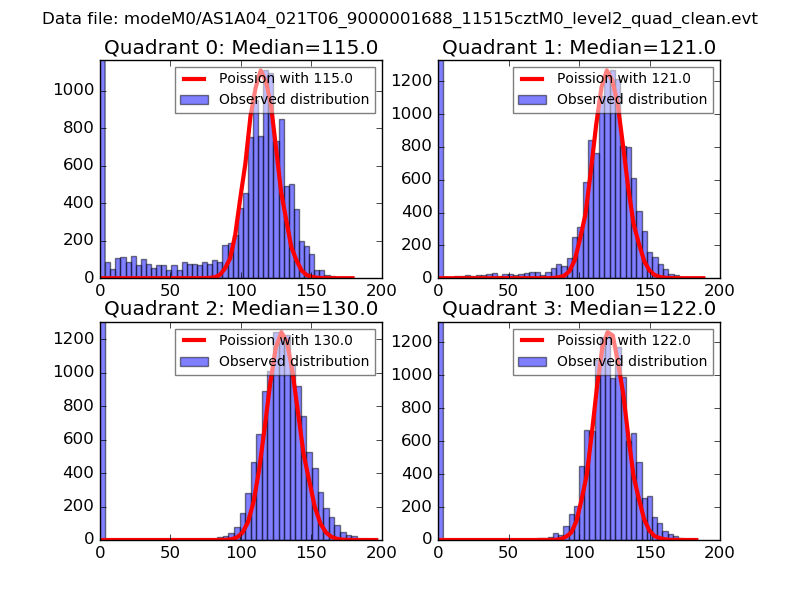 |
 |
| Quadrant-wise count rates Data is divided into 100 sec bins |
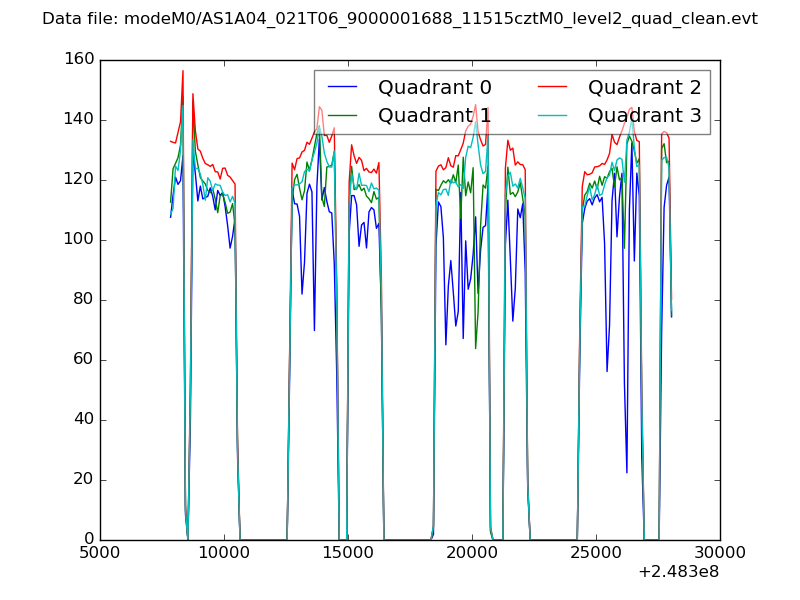 |
|
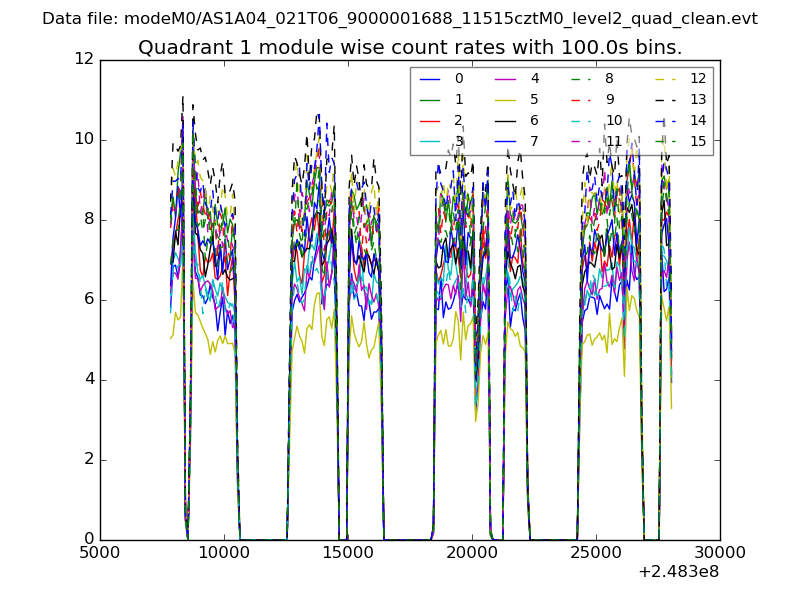
| Module-wise count rates for Quadrant A Data is divided into 100 sec bins |
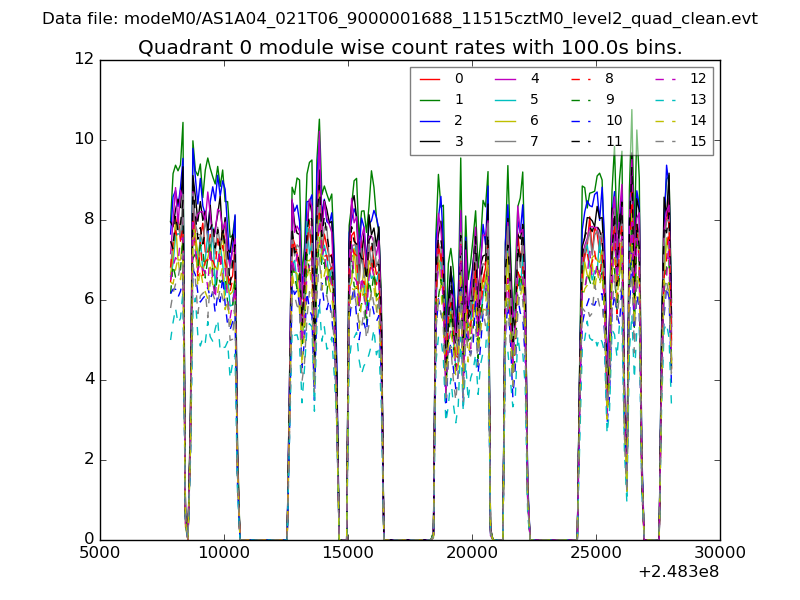 |
 |
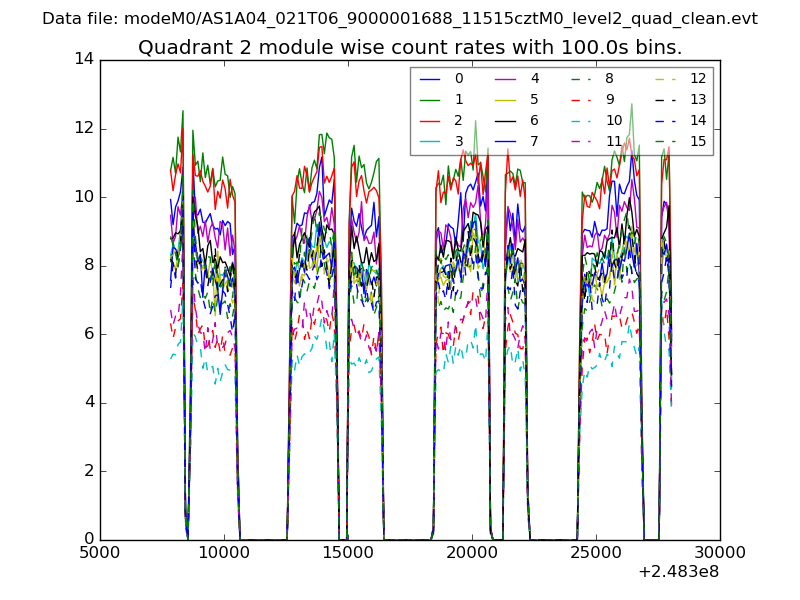
| Module-wise count rates for Quadrant B Data is divided into 100 sec bins |
 |
 |
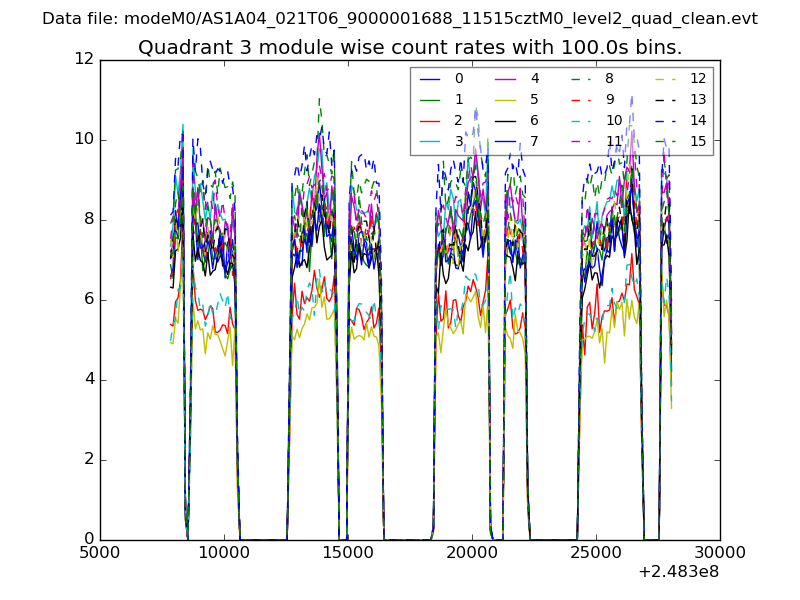
| Module-wise count rates for Quadrant C Data is divided into 100 sec bins |
 |
 |
| Module-wise count rates for Quadrant D Data is divided into 100 sec bins |
 |
 |
| Parameter | Plot |
|---|---|
| CZT HV Monitor | 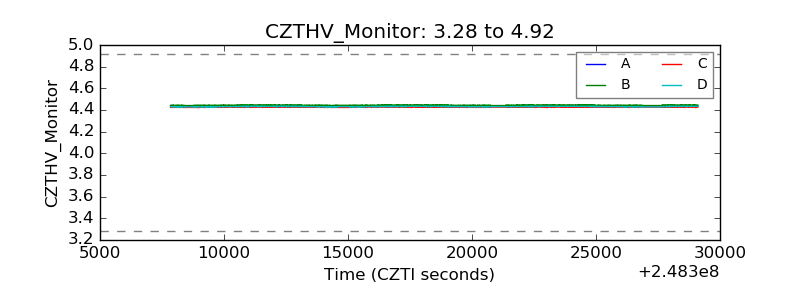 |
| D_VDD | 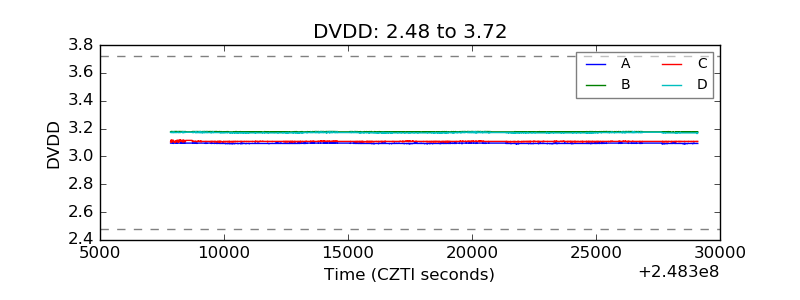 |
| Temperature 1 | 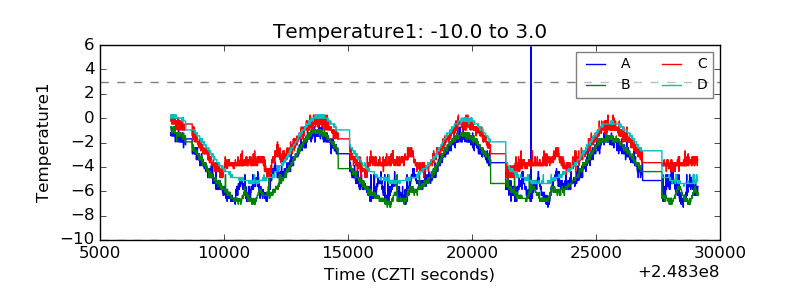 |
| Veto HV Monitor | 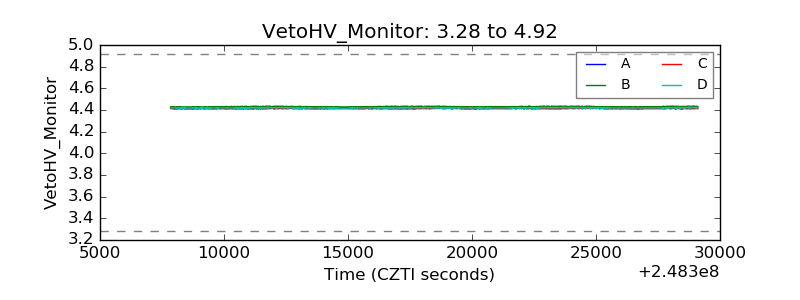 |
| Veto LLD | 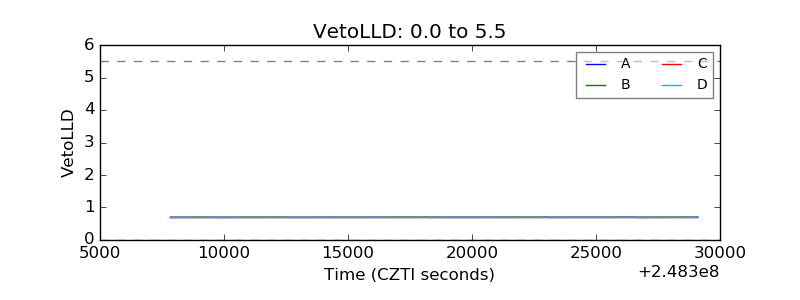 |
| Alpha Counter | 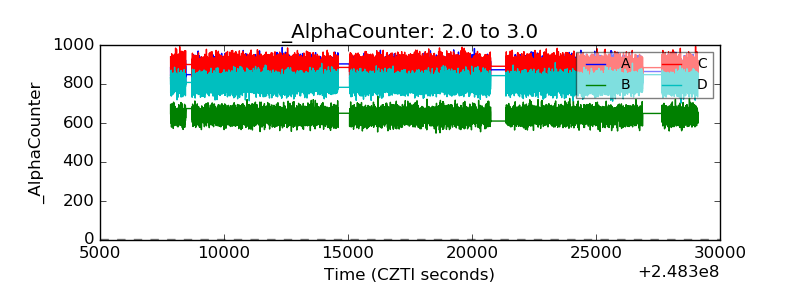 |
| _CPM_Rate | 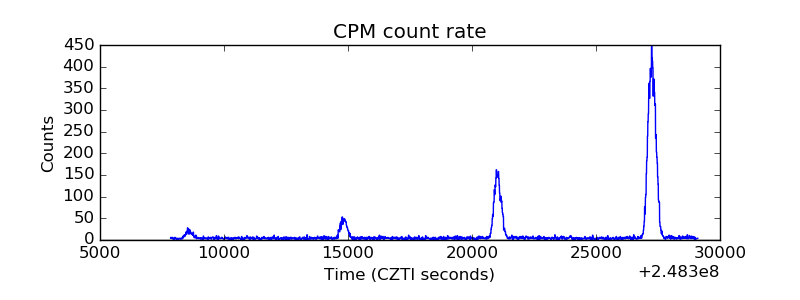 |
| CZT Counter | 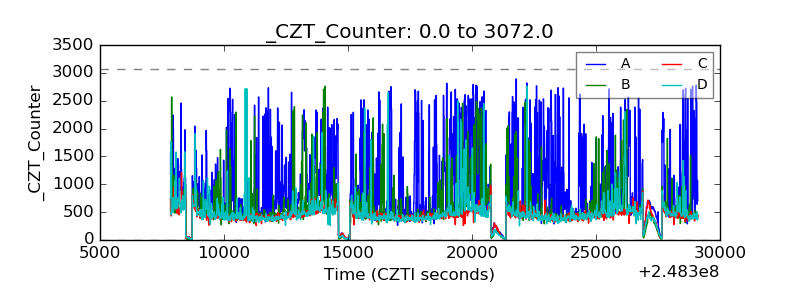 |
| +2.5 Volts monitor | 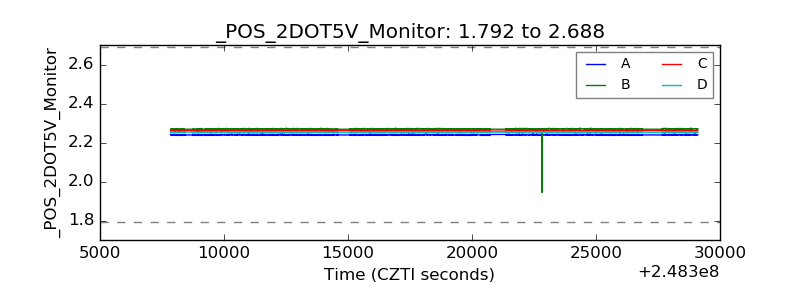 |
| +5 Volts monitor |  |
| _ROLL_ROT | 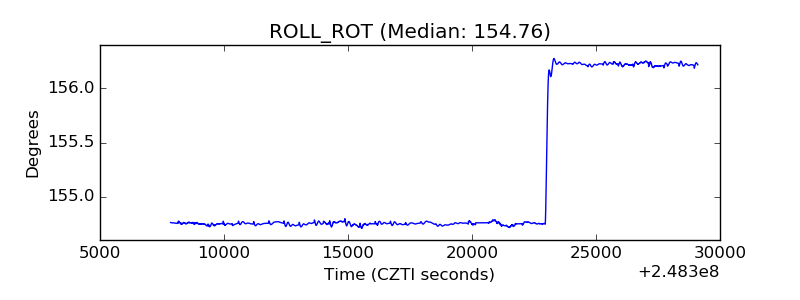 |
| _Roll_DEC | 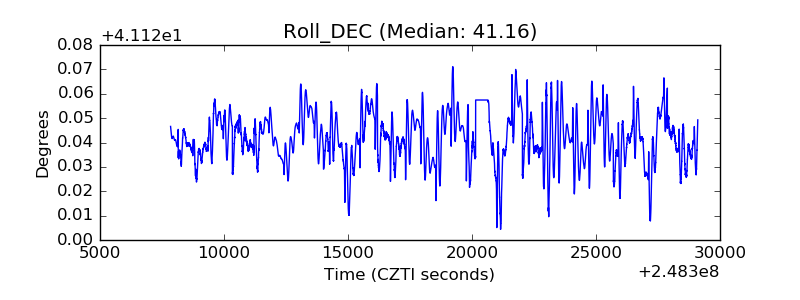 |
| _Roll_RA | 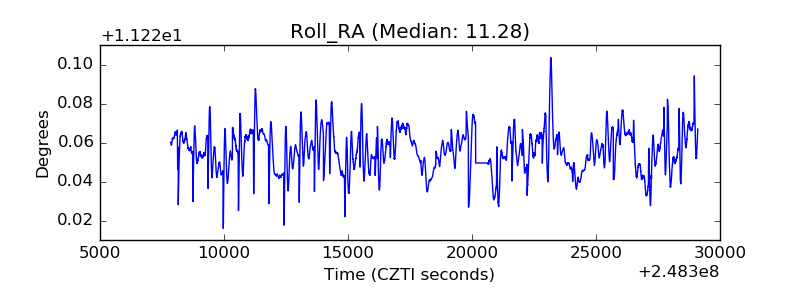 |
| Veto Counter | 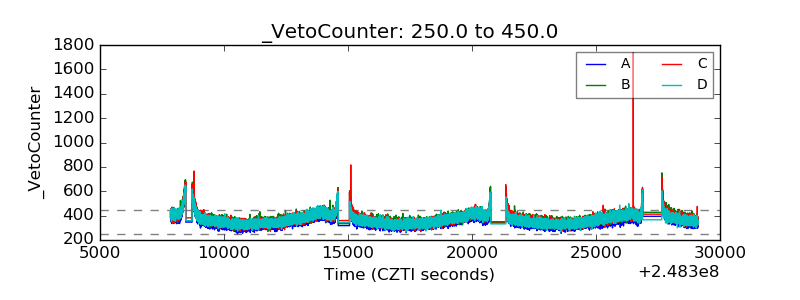 |