| Param | Original file | Final file |
|---|---|---|
| Filename | modeM0/AS1A04_021T06_9000001688_11516cztM0_level2.evt | modeM0/AS1A04_021T06_9000001688_11516cztM0_level2_quad_clean.evt |
| Size (bytes) | 648,521,280 | 66,890,880 |
| Size | 618.5 MB | 63.8 MB |
| Events in quadrant A | 8,136,786 | 322,956 |
| Events in quadrant B | 4,401,561 | 391,491 |
| Events in quadrant C | 3,155,374 | 425,120 |
| Events in quadrant D | 3,476,294 | 401,800 |
| Mode M0 | |||
|---|---|---|---|
| Quadrant | BADHDUFLAG | Total packets | Discarded packets |
| A | 0 | 28798 | 3 |
| B | 0 | 17692 | 2 |
| C | 0 | 14111 | 2 |
| D | 0 | 15009 | 2 |
| Mode SS | |||
|---|---|---|---|
| Quadrant | BADHDUFLAG | Total packets | Discarded packets |
| A | 0 | 142 | 0 |
| B | 0 | 142 | 0 |
| C | 0 | 142 | 0 |
| D | 0 | 142 | 0 |
| Mode M9 | |||
|---|---|---|---|
| Quadrant | BADHDUFLAG | Total packets | Discarded packets |
| A | 0 | 9 | 0 |
| B | 0 | 9 | 0 |
| C | 0 | 9 | 0 |
| D | 0 | 9 | 0 |
| Quadrant | Total seconds | Saturated seconds | Saturation percentage |
|---|---|---|---|
| A | 6933 | 2183 | 31.487091% |
| B | 6933 | 300 | 4.327131% |
| C | 6933 | 36 | 0.519256% |
| D | 6934 | 54 | 0.778771% |
Noise dominated data is calculated using 1-second bins in cleaned event files. If a bin has >2000 counts, and if more than 50% of those come from <1% of pixels, then it is considered to be noise-dominated and hence unusable.
| Quadrant | # 1 sec bins | Bins with >0 counts | Bins with >2000 counts | High rate bins dominated by noise | Noise dominated (total time) | Noise dominated (detector-on time) | Marked lightcurve |
|---|---|---|---|---|---|---|---|
| A | 7859 | 6932 | 1350 | 1350 | 17.18% | 19.47% | 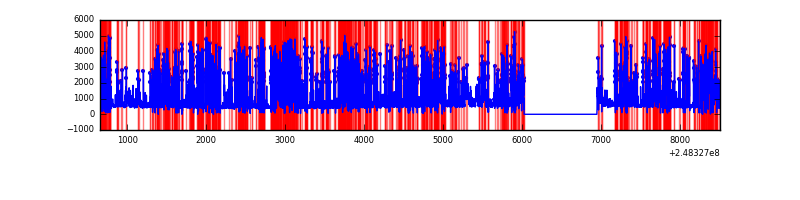 |
| B | 7859 | 6935 | 140 | 140 | 1.78% | 2.02% | 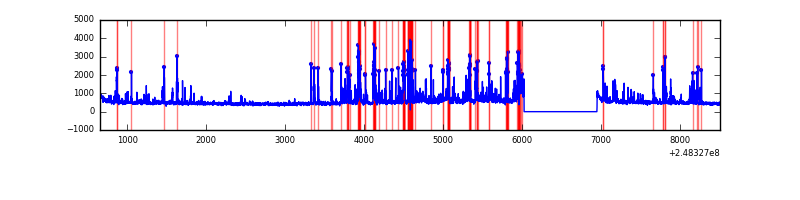 |
| C | 7859 | 6935 | 0 | 0 | 0.00% | 0.00% | 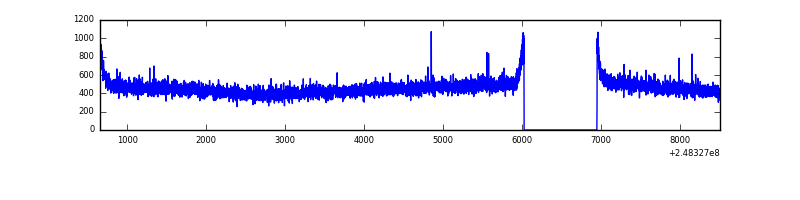 |
| D | 7860 | 6936 | 24 | 24 | 0.31% | 0.35% | 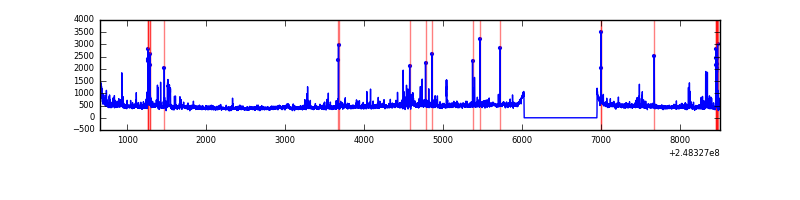 |
Top three noisy pixels from each quadrant. If the there are fewer than three noisy pixels in the level2.evt file, extra rows are filled as -1
| Pixel properties | Quadrant properties | ||||||
|---|---|---|---|---|---|---|---|
| Quadrant | DetID | PixID | Counts | Sigma | Mean | Median | Sigma |
| A | 8 | 5 | 5551861 | 41556.91 | 648 | 633 | 133.6 |
| A | 9 | 143 | 38775 | 285.53 | 648 | 633 | 133.6 |
| A | 8 | 15 | 11061 | 78.06 | 648 | 633 | 133.6 |
| B | 4 | 239 | 667286 | 4262.7 | 813 | 792 | 156.4 |
| B | 3 | 64 | 303823 | 1938.1 | 813 | 792 | 156.4 |
| B | 15 | 204 | 76244 | 482.57 | 813 | 792 | 156.4 |
| C | 13 | 61 | 6045 | 27.77 | 809 | 815 | 188.4 |
| C | 3 | 202 | 1925 | 5.89 | 809 | 815 | 188.4 |
| C | 12 | 4 | 1792 | 5.19 | 809 | 815 | 188.4 |
| D | 2 | 120 | 107935 | 557.15 | 798 | 775 | 192.3 |
| D | 1 | 52 | 74658 | 384.14 | 798 | 775 | 192.3 |
| D | 13 | 122 | 56499 | 289.72 | 798 | 775 | 192.3 |
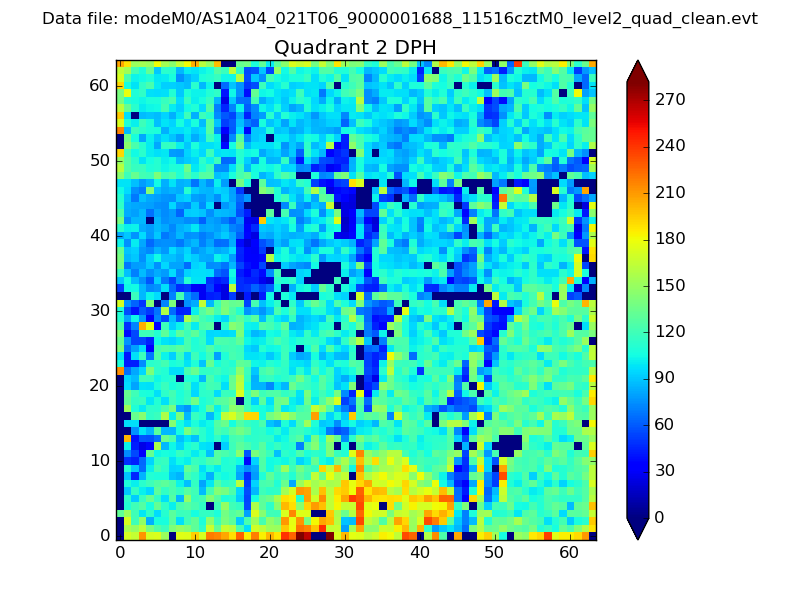
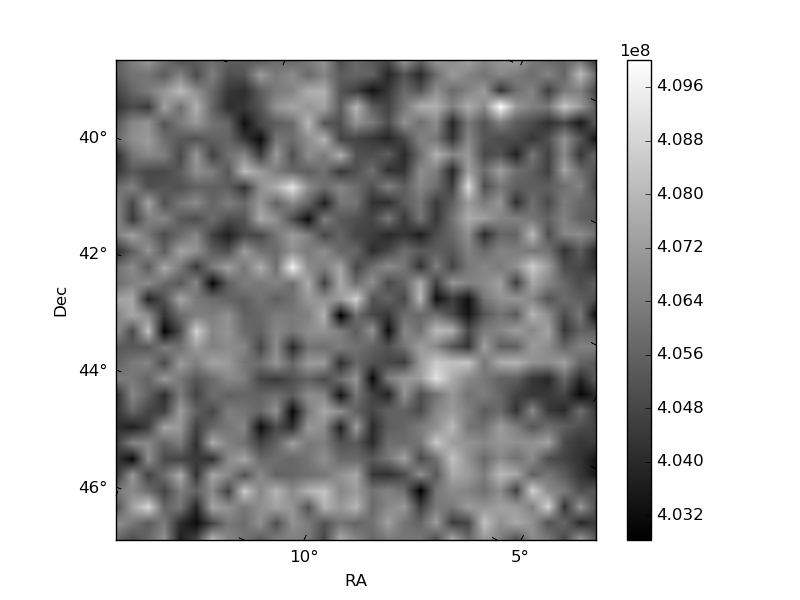
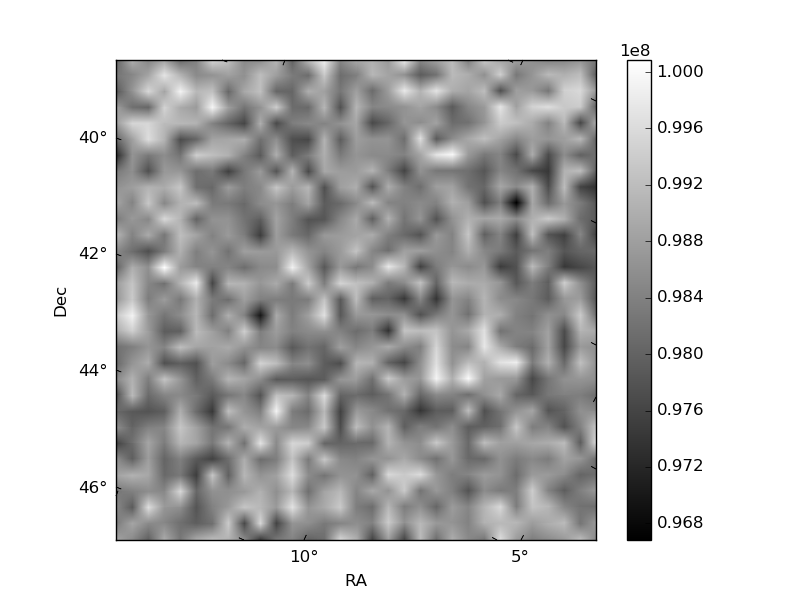
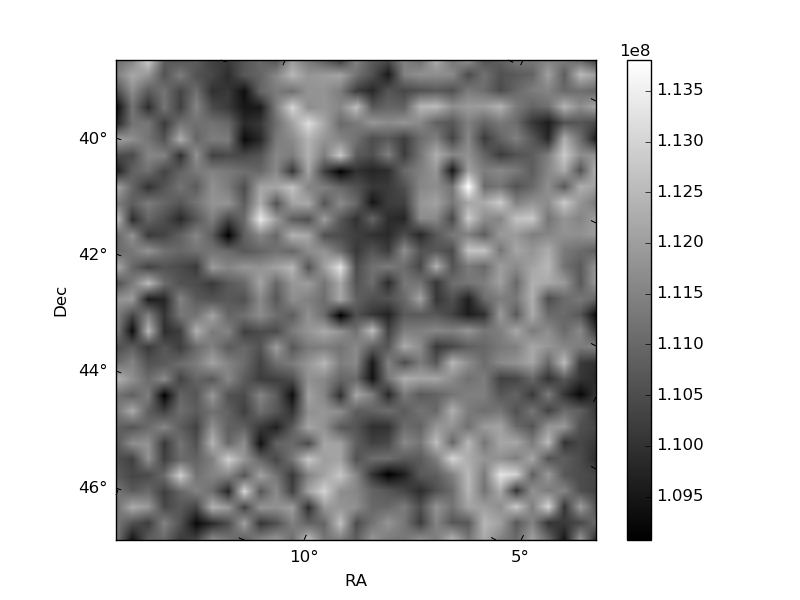
Histogram calculated using DETX and DETY for each event in the final _common_clean file
| Quadrant A | 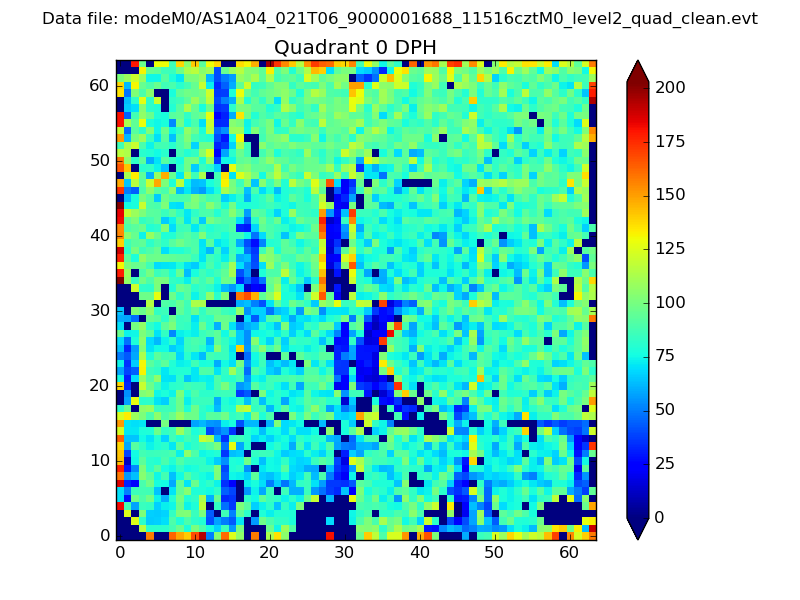 |
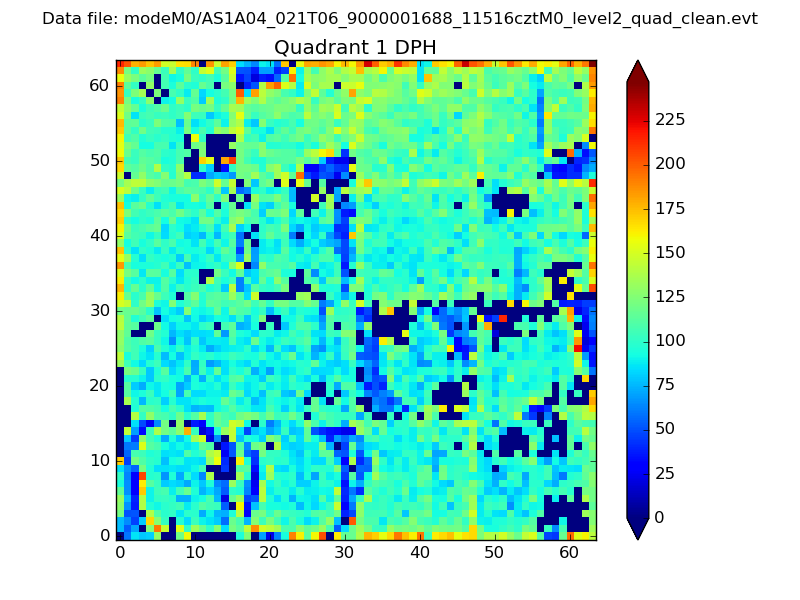 |
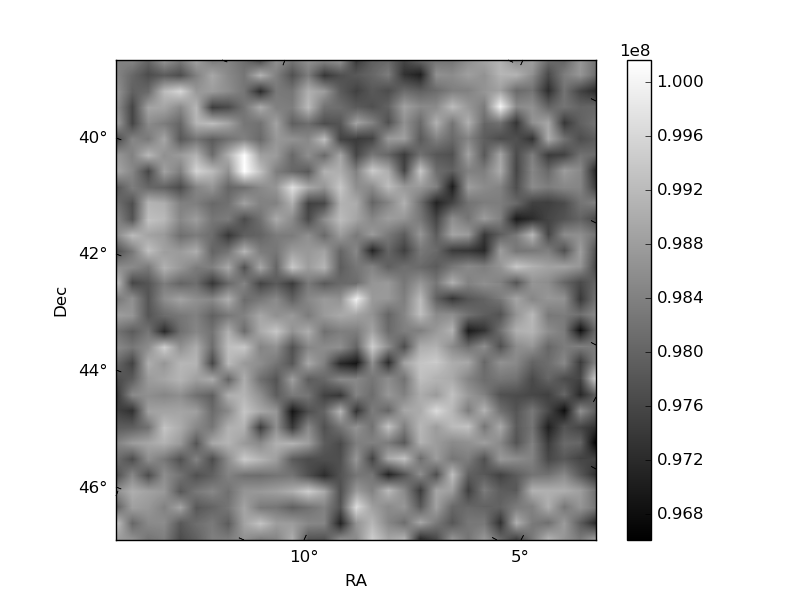
Quadrant B |
|---|---|---|---|
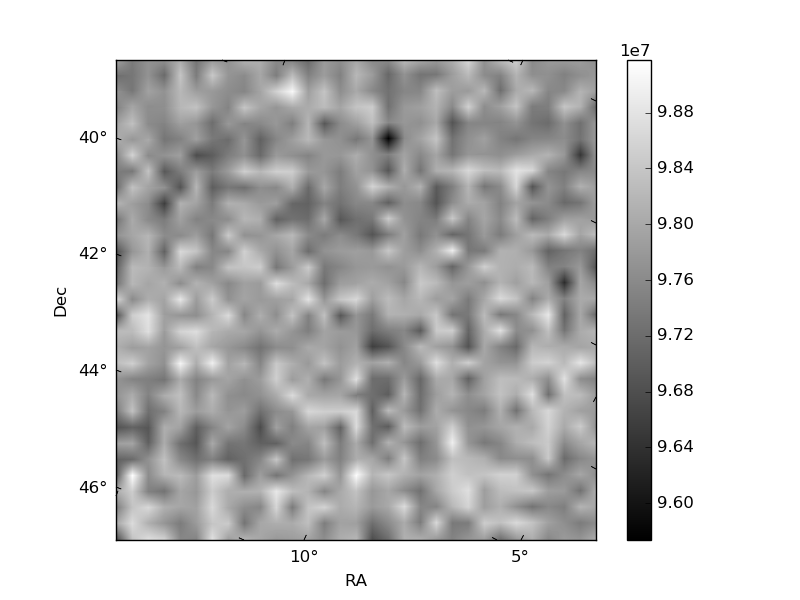
| Quadrant D | 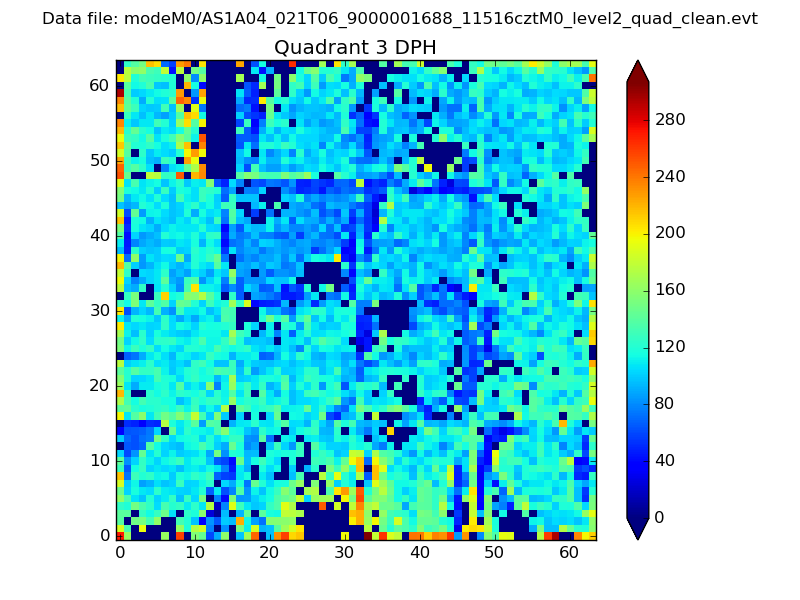 |
 |
Quadrant C |
| Plot type | Count rate plots | Images |
|---|---|---|
| Comparison with Poisson distribution Blue bars denote a histogram of data divided into 1 sec bins. Red curve is a Poisson curve with rate = median count rate of data. |
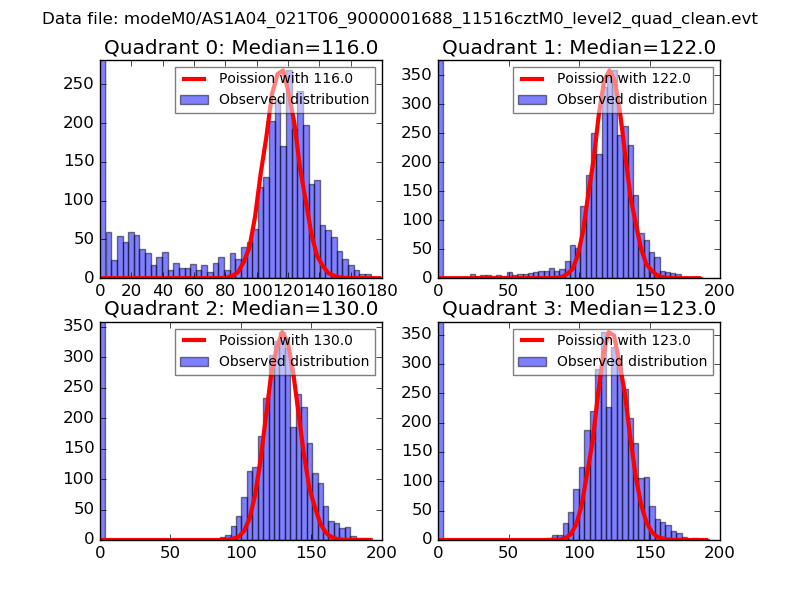 |
 |
| Quadrant-wise count rates Data is divided into 100 sec bins |
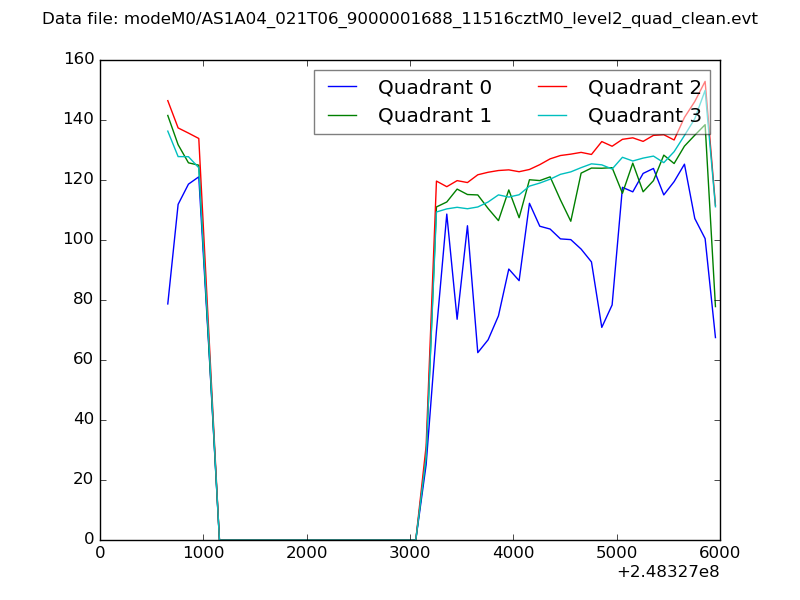 |
|
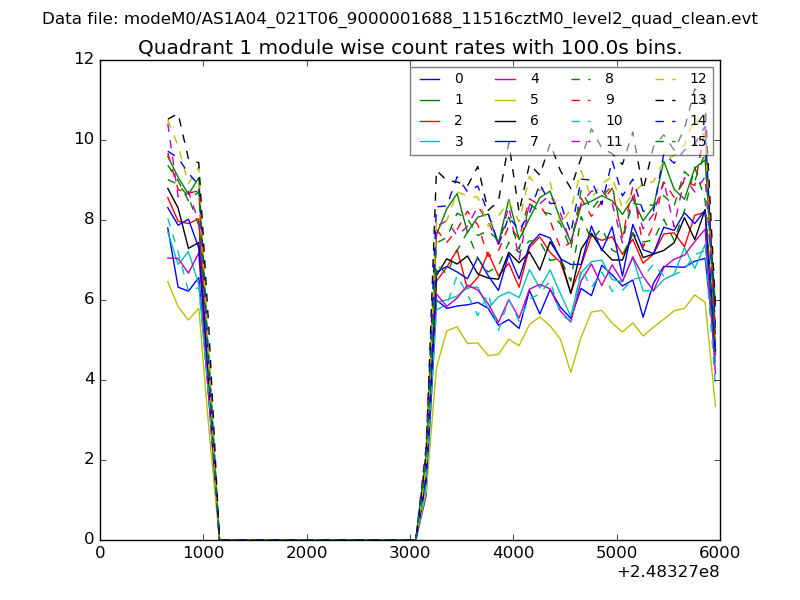
| Module-wise count rates for Quadrant A Data is divided into 100 sec bins |
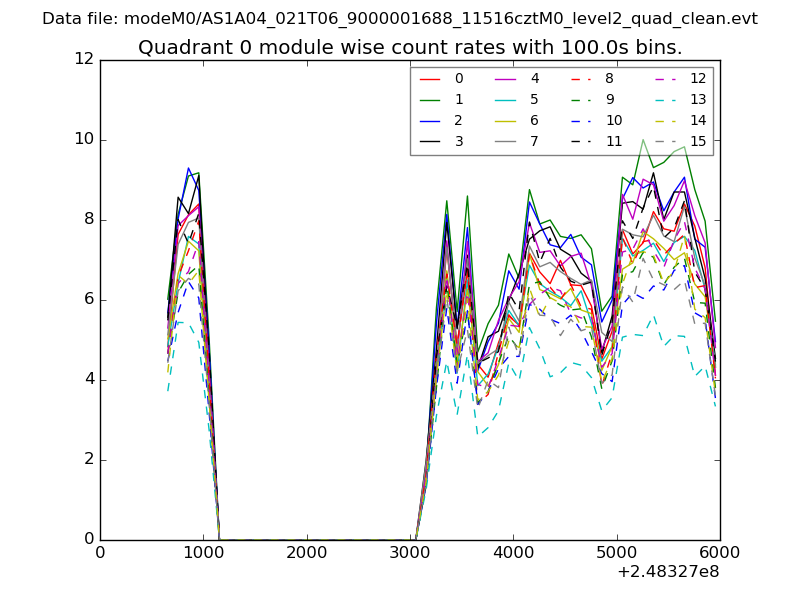 |
 |
| Module-wise count rates for Quadrant B Data is divided into 100 sec bins |
 |
 |
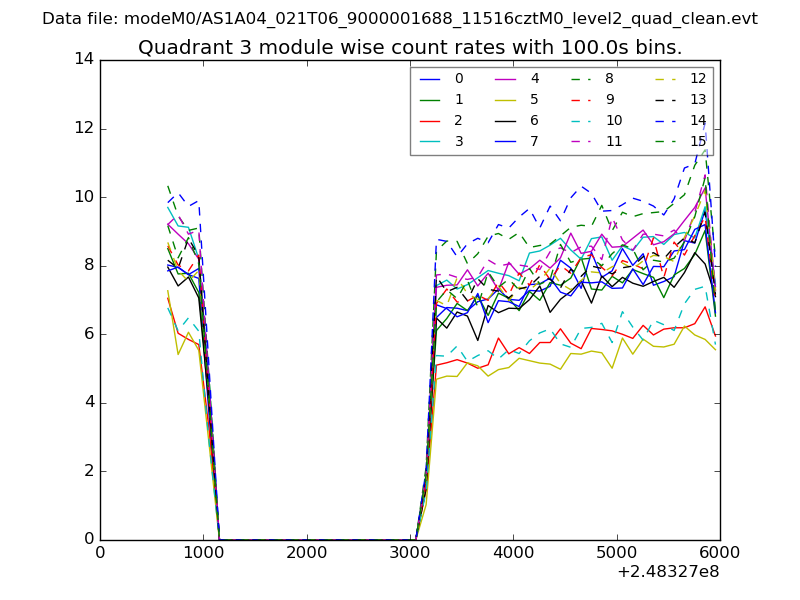
| Module-wise count rates for Quadrant C Data is divided into 100 sec bins |
 |
 |
| Module-wise count rates for Quadrant D Data is divided into 100 sec bins |
 |
 |
| Parameter | Plot |
|---|---|
| CZT HV Monitor | 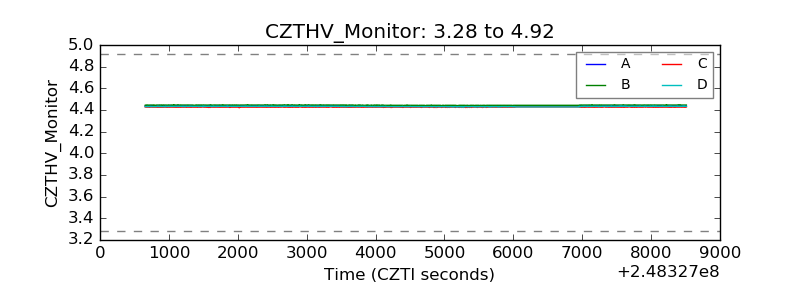 |
| D_VDD | 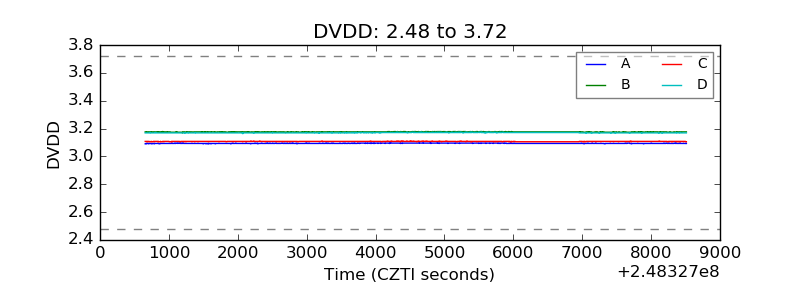 |
| Temperature 1 | 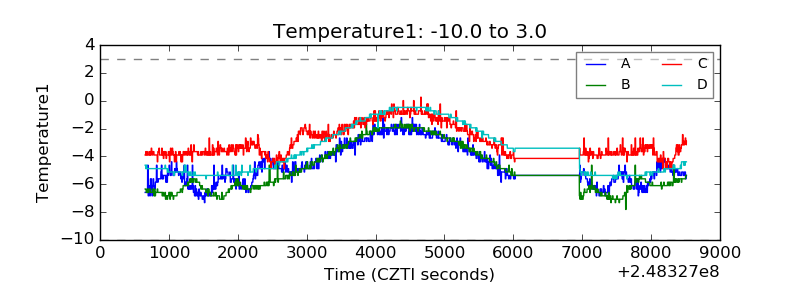 |
| Veto HV Monitor | 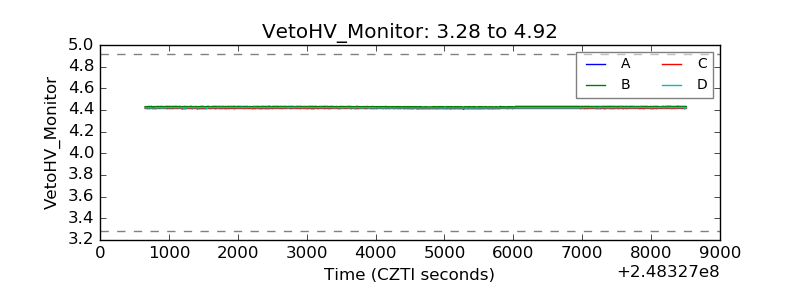 |
| Veto LLD | 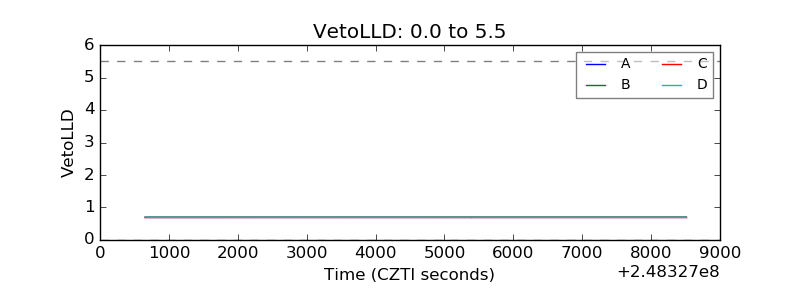 |
| Alpha Counter | 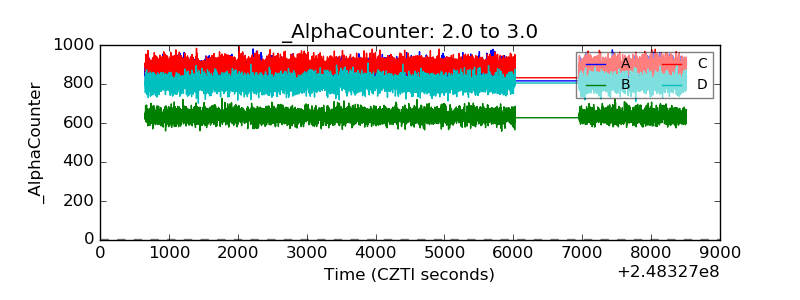 |
| _CPM_Rate | 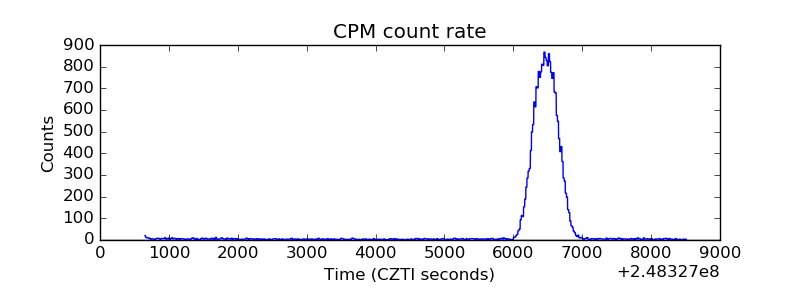 |
| CZT Counter | 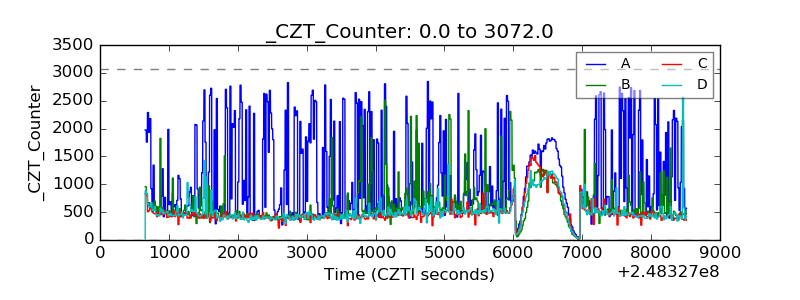 |
| +2.5 Volts monitor |  |
| +5 Volts monitor |  |
| _ROLL_ROT | 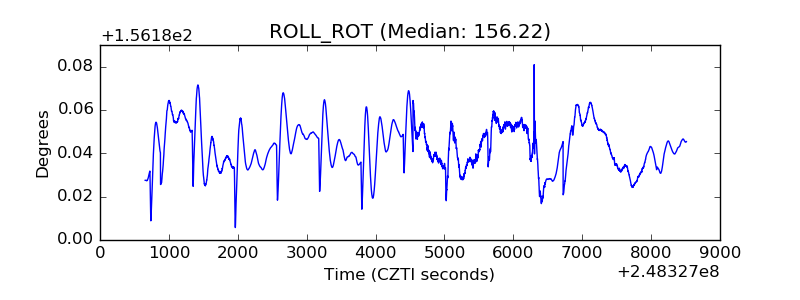 |
| _Roll_DEC | 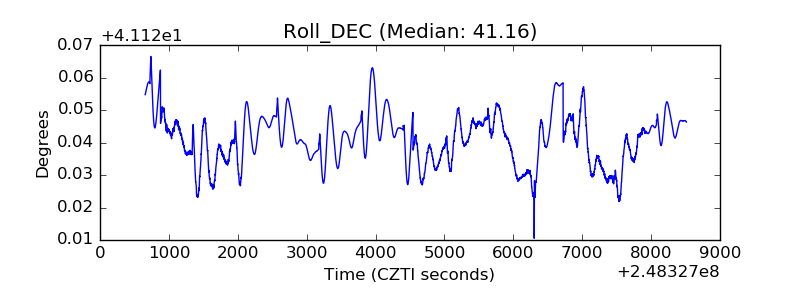 |
| _Roll_RA | 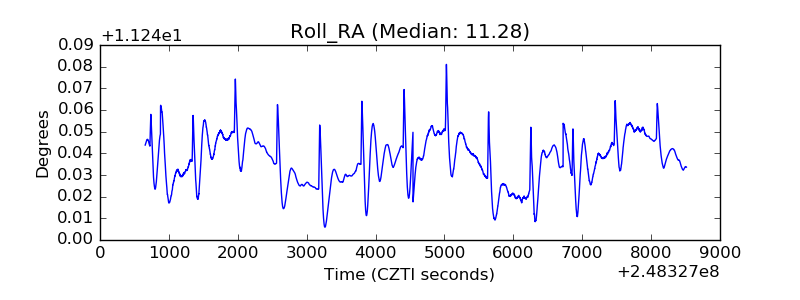 |
| Veto Counter | 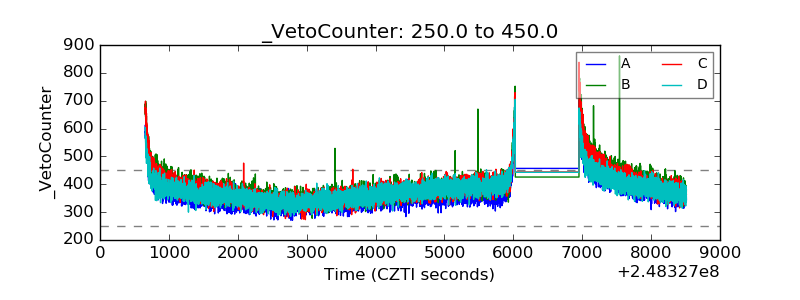 |