| Param | Original file | Final file |
|---|---|---|
| Filename | modeM0/AS1A04_021T06_9000001688_11518cztM0_level2.evt | modeM0/AS1A04_021T06_9000001688_11518cztM0_level2_quad_clean.evt |
| Size (bytes) | 645,811,200 | 64,005,120 |
| Size | 615.9 MB | 61.0 MB |
| Events in quadrant A | 7,136,376 | 337,632 |
| Events in quadrant B | 4,166,333 | 374,937 |
| Events in quadrant C | 3,053,314 | 400,926 |
| Events in quadrant D | 4,758,899 | 366,903 |
| Mode M0 | |||
|---|---|---|---|
| Quadrant | BADHDUFLAG | Total packets | Discarded packets |
| A | 0 | 25636 | 2 |
| B | 0 | 16571 | 1 |
| C | 0 | 13432 | 1 |
| D | 0 | 18546 | 1 |
| Mode SS | |||
|---|---|---|---|
| Quadrant | BADHDUFLAG | Total packets | Discarded packets |
| A | 0 | 132 | 0 |
| B | 0 | 132 | 0 |
| C | 0 | 132 | 0 |
| D | 0 | 132 | 0 |
| Mode M9 | |||
|---|---|---|---|
| Quadrant | BADHDUFLAG | Total packets | Discarded packets |
| A | 0 | 11 | 0 |
| B | 0 | 11 | 0 |
| C | 0 | 11 | 0 |
| D | 0 | 11 | 0 |
| Quadrant | Total seconds | Saturated seconds | Saturation percentage |
|---|---|---|---|
| A | 6555 | 1547 | 23.600305% |
| B | 6555 | 248 | 3.783371% |
| C | 6555 | 36 | 0.549199% |
| D | 6555 | 308 | 4.698703% |
Noise dominated data is calculated using 1-second bins in cleaned event files. If a bin has >2000 counts, and if more than 50% of those come from <1% of pixels, then it is considered to be noise-dominated and hence unusable.
| Quadrant | # 1 sec bins | Bins with >0 counts | Bins with >2000 counts | High rate bins dominated by noise | Noise dominated (total time) | Noise dominated (detector-on time) | Marked lightcurve |
|---|---|---|---|---|---|---|---|
| A | 7626 | 6555 | 955 | 955 | 12.52% | 14.57% | 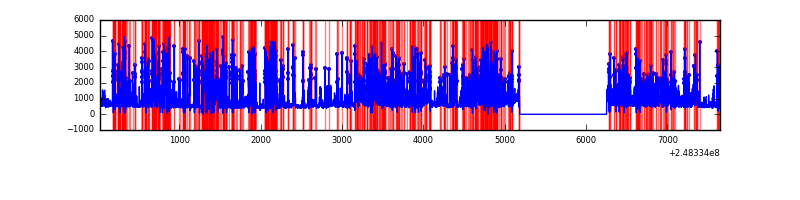 |
| B | 7626 | 6557 | 115 | 115 | 1.51% | 1.75% | 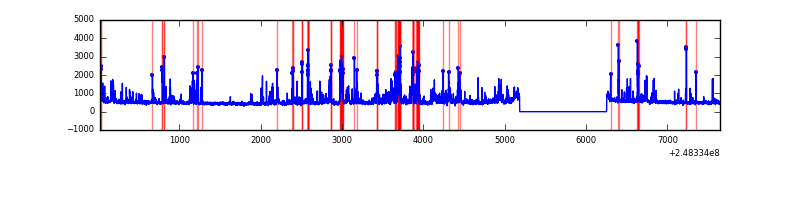 |
| C | 7626 | 6557 | 0 | 0 | 0.00% | 0.00% | 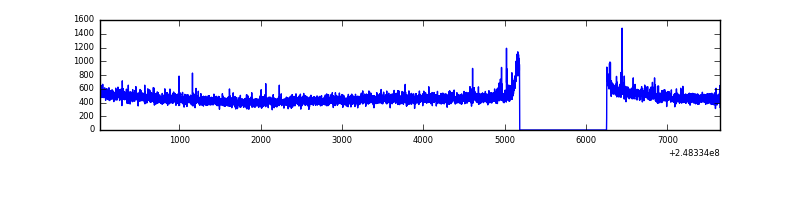 |
| D | 7626 | 6557 | 212 | 212 | 2.78% | 3.23% | 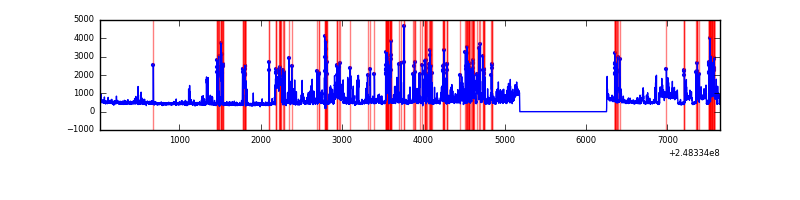 |
Top three noisy pixels from each quadrant. If the there are fewer than three noisy pixels in the level2.evt file, extra rows are filled as -1
| Pixel properties | Quadrant properties | ||||||
|---|---|---|---|---|---|---|---|
| Quadrant | DetID | PixID | Counts | Sigma | Mean | Median | Sigma |
| A | 8 | 5 | 4376488 | 30945.77 | 692 | 675 | 141.4 |
| A | 13 | 251 | 33777 | 234.1 | 692 | 675 | 141.4 |
| A | 9 | 143 | 18964 | 129.34 | 692 | 675 | 141.4 |
| B | 4 | 239 | 592971 | 3954.9 | 790 | 772 | 149.7 |
| B | 3 | 64 | 176231 | 1171.77 | 790 | 772 | 149.7 |
| B | 10 | 245 | 109217 | 724.23 | 790 | 772 | 149.7 |
| C | 7 | 87 | 20924 | 112.01 | 776 | 784 | 179.8 |
| C | 12 | 4 | 6683 | 32.81 | 776 | 784 | 179.8 |
| C | 13 | 61 | 5713 | 27.41 | 776 | 784 | 179.8 |
| D | 1 | 52 | 1398412 | 7626.64 | 759 | 739 | 183.3 |
| D | 6 | 219 | 200594 | 1090.54 | 759 | 739 | 183.3 |
| D | 2 | 120 | 85842 | 464.38 | 759 | 739 | 183.3 |
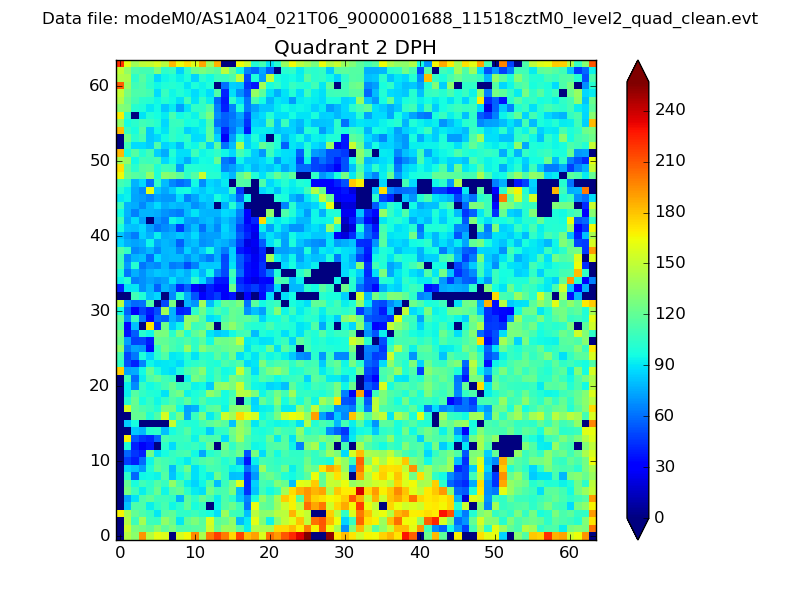
Histogram calculated using DETX and DETY for each event in the final _common_clean file
| Quadrant A | 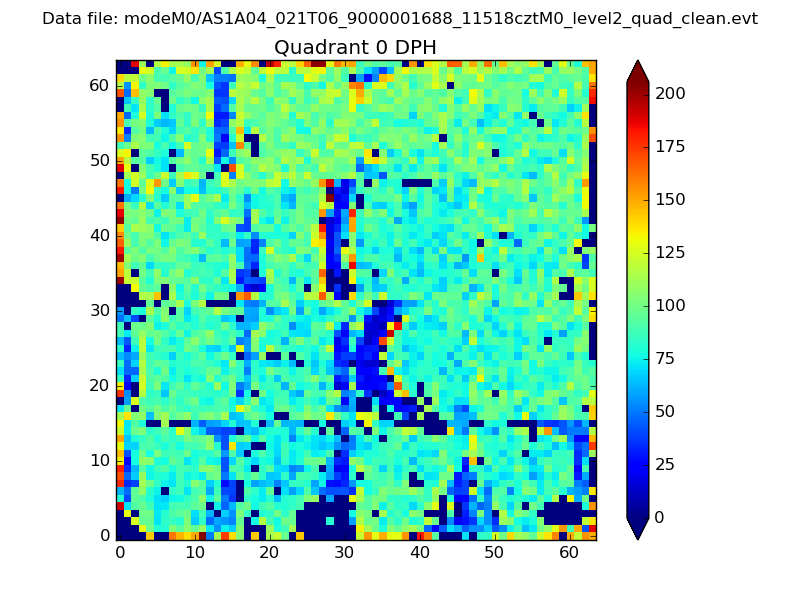 |
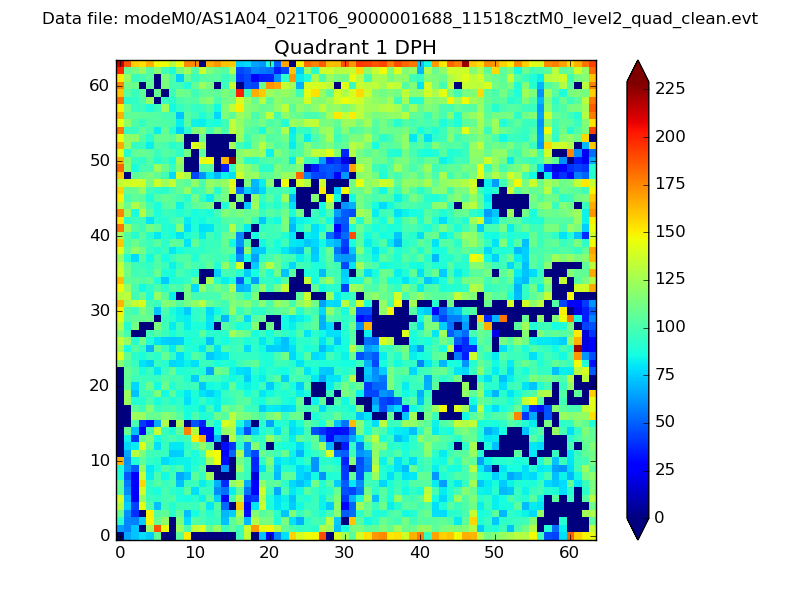 |
Quadrant B |
|---|---|---|---|
| Quadrant D | 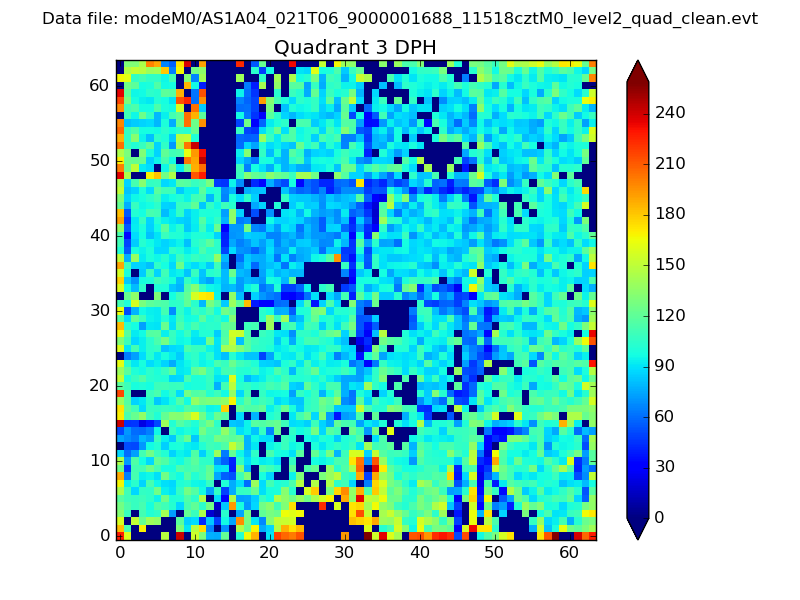 |
 |
Quadrant C |
| Plot type | Count rate plots | Images |
|---|---|---|
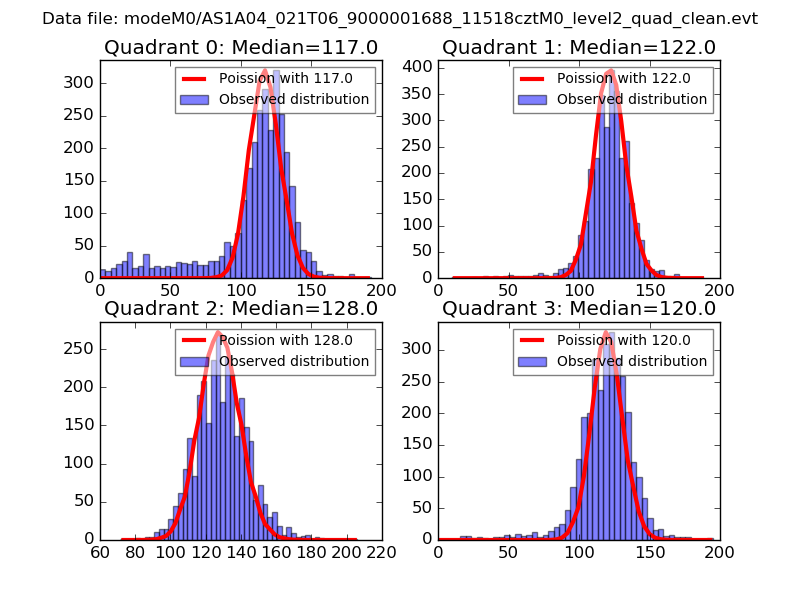
| Comparison with Poisson distribution Blue bars denote a histogram of data divided into 1 sec bins. Red curve is a Poisson curve with rate = median count rate of data. |
 |
 |
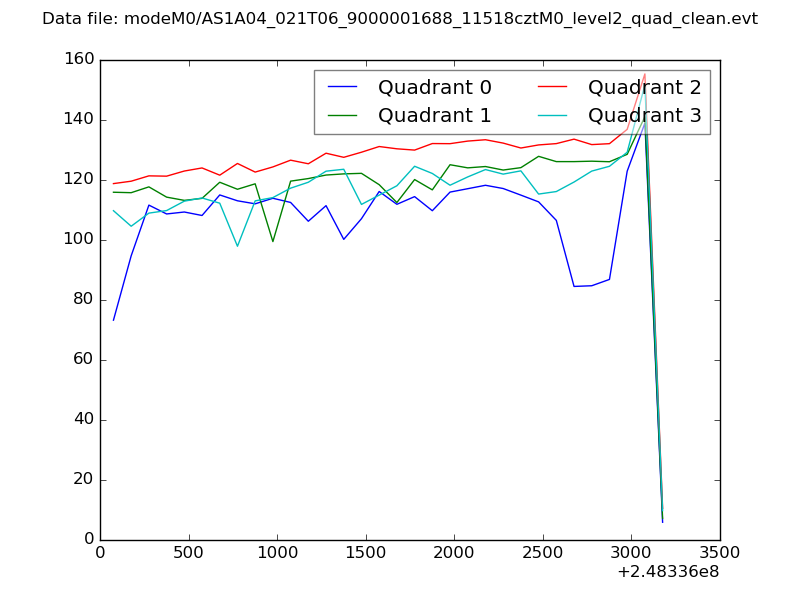
| Quadrant-wise count rates Data is divided into 100 sec bins |
 |
|
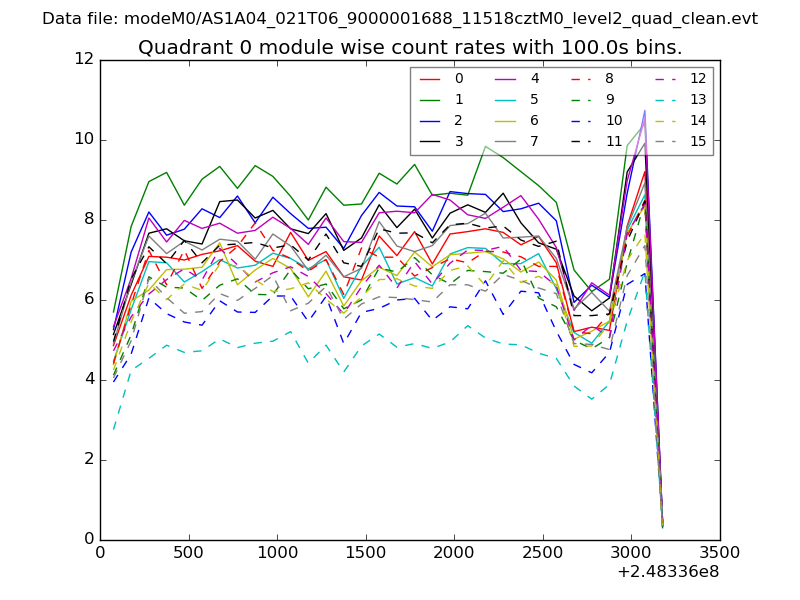
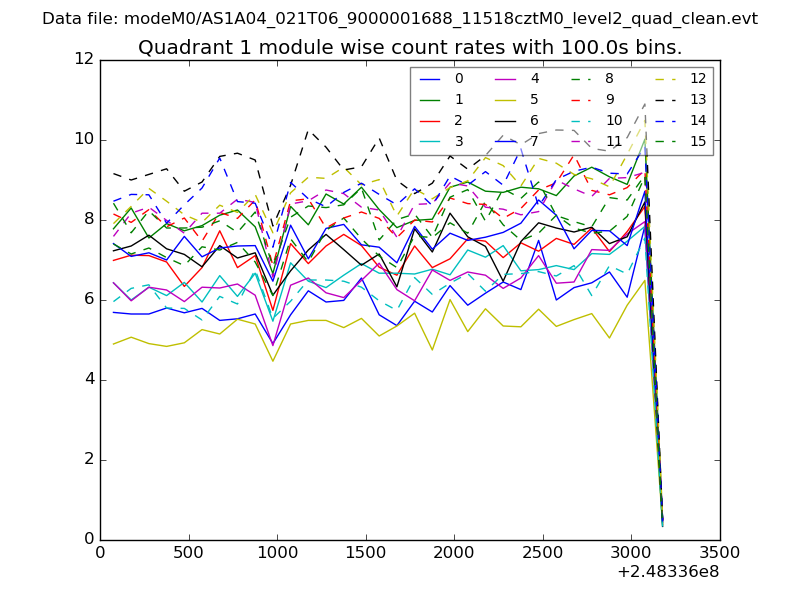
| Module-wise count rates for Quadrant A Data is divided into 100 sec bins |
 |
 |
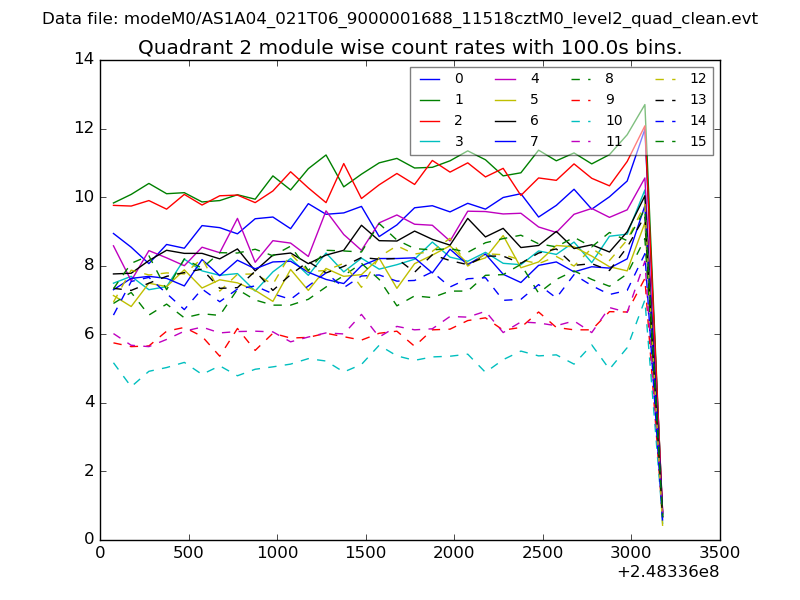
| Module-wise count rates for Quadrant B Data is divided into 100 sec bins |
 |
 |
| Module-wise count rates for Quadrant C Data is divided into 100 sec bins |
 |
 |
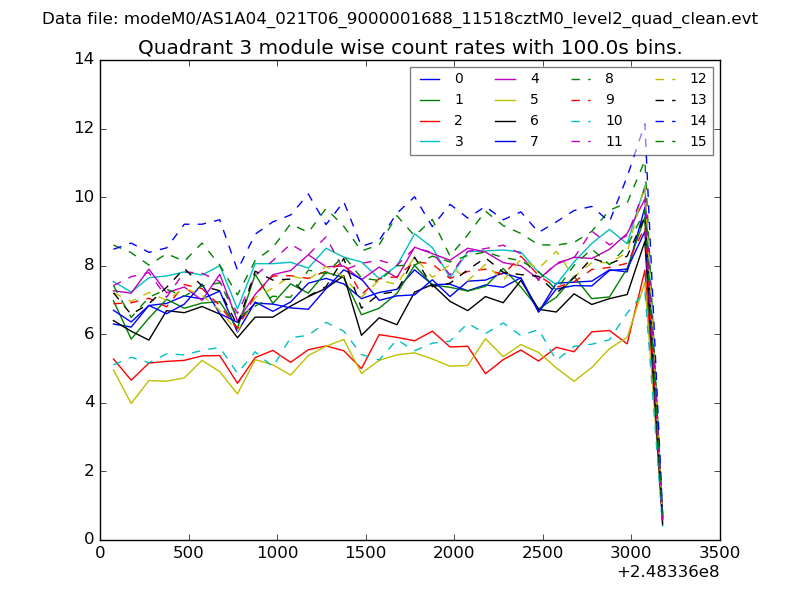
| Module-wise count rates for Quadrant D Data is divided into 100 sec bins |
 |
 |
| Parameter | Plot |
|---|---|
| CZT HV Monitor | 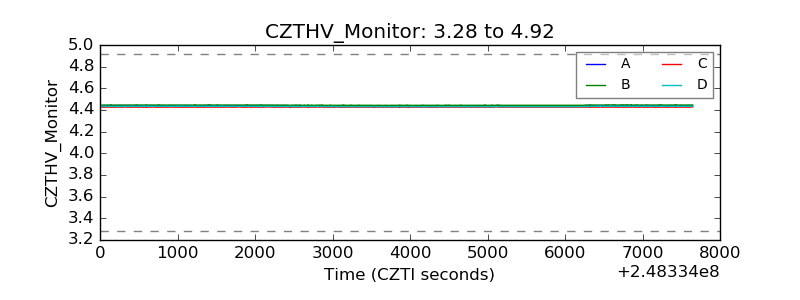 |
| D_VDD | 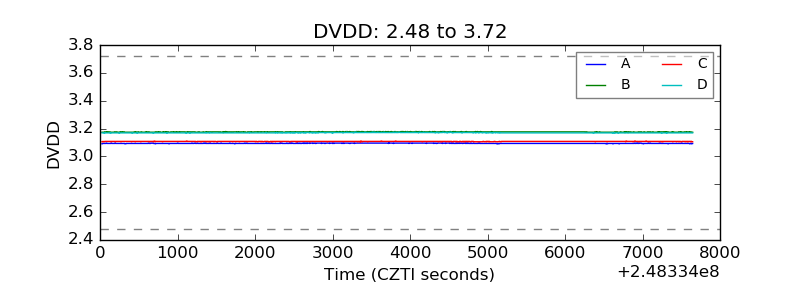 |
| Temperature 1 | 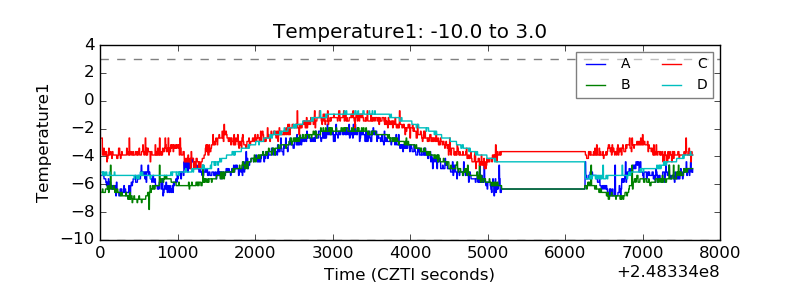 |
| Veto HV Monitor | 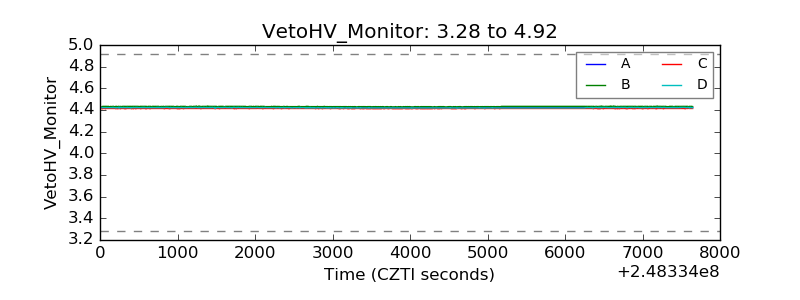 |
| Veto LLD | 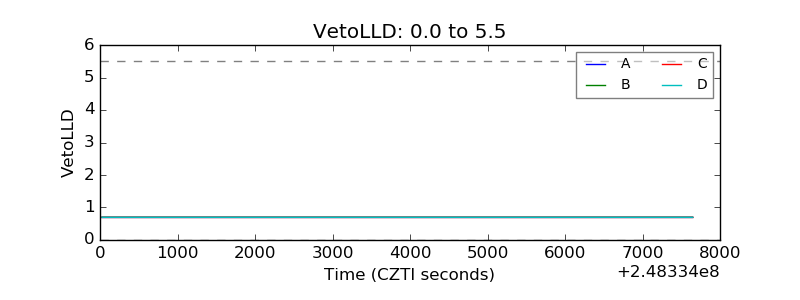 |
| Alpha Counter | 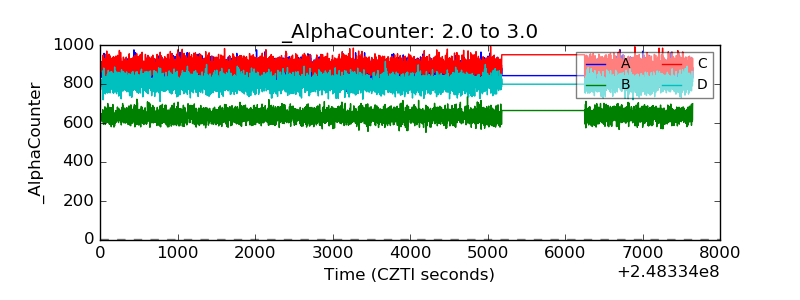 |
| _CPM_Rate | 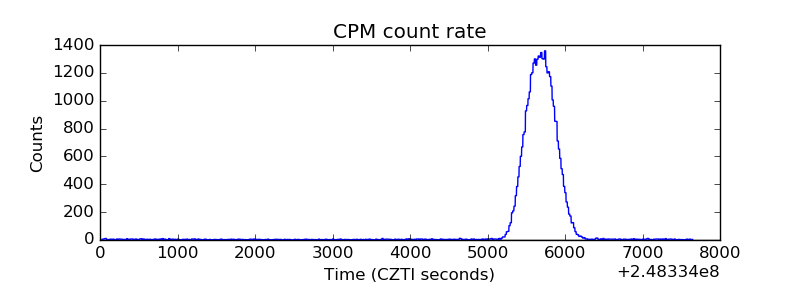 |
| CZT Counter | 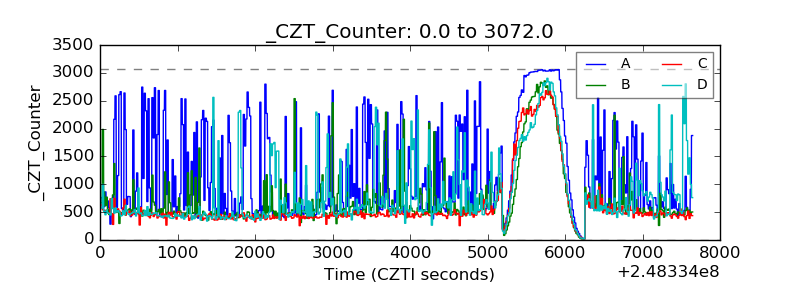 |
| +2.5 Volts monitor |  |
| +5 Volts monitor |  |
| _ROLL_ROT | 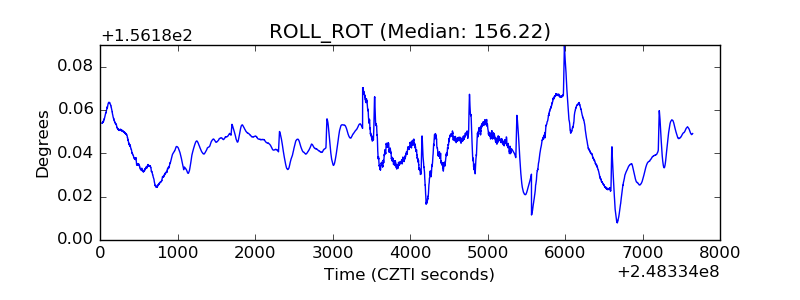 |
| _Roll_DEC | 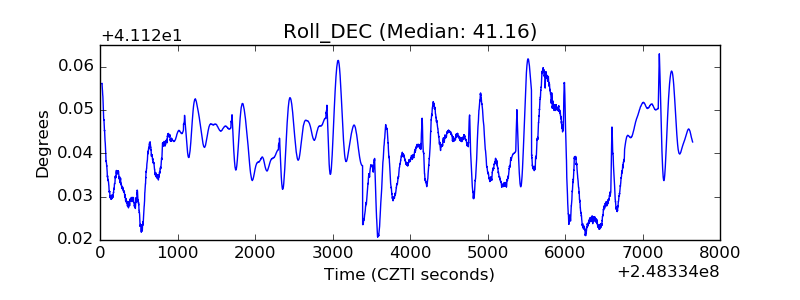 |
| _Roll_RA | 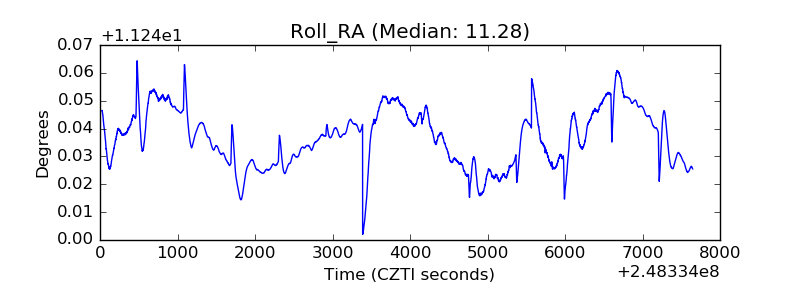 |
| Veto Counter | 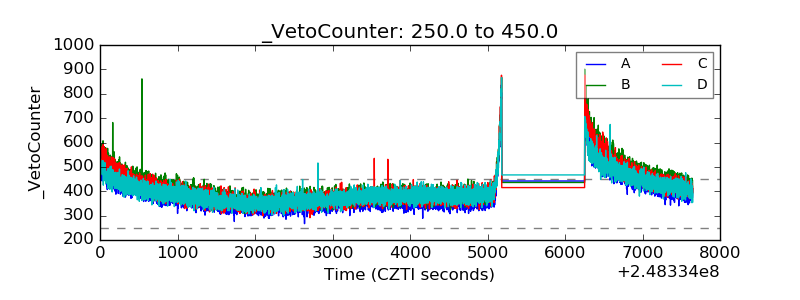 |