| Param | Original file | Final file |
|---|---|---|
| Filename | modeM0/AS1A04_021T06_9000001688_11520cztM0_level2.evt | modeM0/AS1A04_021T06_9000001688_11520cztM0_level2_quad_clean.evt |
| Size (bytes) | 571,878,720 | 88,911,360 |
| Size | 545.4 MB | 84.8 MB |
| Events in quadrant A | 5,236,889 | 543,399 |
| Events in quadrant B | 4,407,697 | 563,633 |
| Events in quadrant C | 3,168,965 | 587,948 |
| Events in quadrant D | 4,073,032 | 551,530 |
| Mode M0 | |||
|---|---|---|---|
| Quadrant | BADHDUFLAG | Total packets | Discarded packets |
| A | 0 | 19884 | 3 |
| B | 0 | 17305 | 2 |
| C | 0 | 13342 | 2 |
| D | 0 | 16151 | 2 |
| Mode SS | |||
|---|---|---|---|
| Quadrant | BADHDUFLAG | Total packets | Discarded packets |
| A | 0 | 130 | 0 |
| B | 0 | 130 | 0 |
| C | 0 | 130 | 0 |
| D | 0 | 130 | 0 |
| Mode M9 | |||
|---|---|---|---|
| Quadrant | BADHDUFLAG | Total packets | Discarded packets |
| A | 0 | 12 | 0 |
| B | 0 | 12 | 0 |
| C | 0 | 12 | 0 |
| D | 0 | 13 | 0 |
| Quadrant | Total seconds | Saturated seconds | Saturation percentage |
|---|---|---|---|
| A | 6388 | 650 | 10.175329% |
| B | 6388 | 291 | 4.555416% |
| C | 6388 | 73 | 1.142768% |
| D | 6388 | 150 | 2.348153% |
Noise dominated data is calculated using 1-second bins in cleaned event files. If a bin has >2000 counts, and if more than 50% of those come from <1% of pixels, then it is considered to be noise-dominated and hence unusable.
| Quadrant | # 1 sec bins | Bins with >0 counts | Bins with >2000 counts | High rate bins dominated by noise | Noise dominated (total time) | Noise dominated (detector-on time) | Marked lightcurve |
|---|---|---|---|---|---|---|---|
| A | 7614 | 6390 | 350 | 350 | 4.60% | 5.48% | 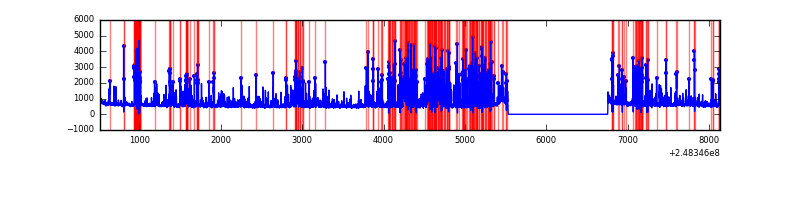 |
| B | 7614 | 6390 | 108 | 108 | 1.42% | 1.69% | 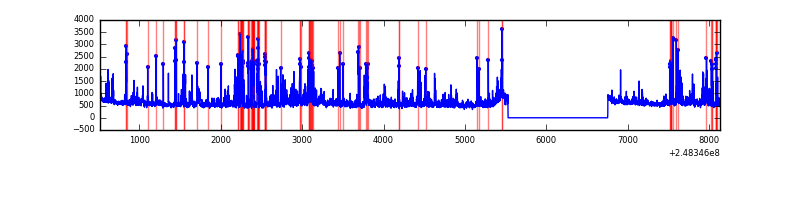 |
| C | 7614 | 6390 | 0 | 0 | 0.00% | 0.00% | 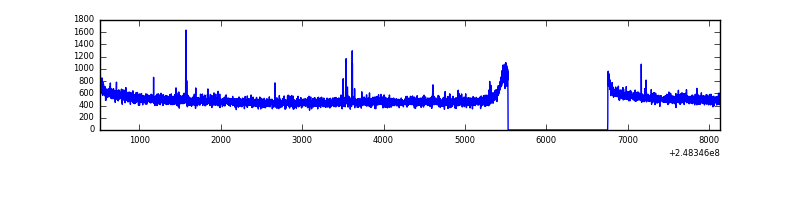 |
| D | 7614 | 6390 | 73 | 73 | 0.96% | 1.14% | 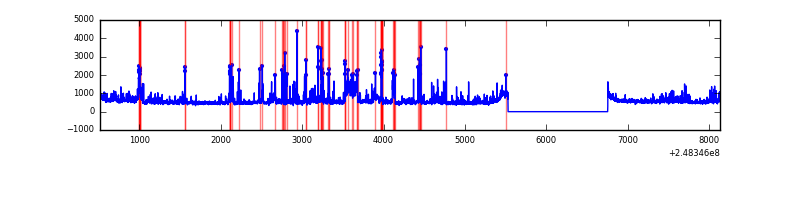 |
Top three noisy pixels from each quadrant. If the there are fewer than three noisy pixels in the level2.evt file, extra rows are filled as -1
| Pixel properties | Quadrant properties | ||||||
|---|---|---|---|---|---|---|---|
| Quadrant | DetID | PixID | Counts | Sigma | Mean | Median | Sigma |
| A | 8 | 5 | 2007889 | 12442.68 | 807 | 793 | 161.3 |
| A | 1 | 162 | 36593 | 221.94 | 807 | 793 | 161.3 |
| A | 9 | 143 | 23056 | 138.02 | 807 | 793 | 161.3 |
| B | 4 | 239 | 605081 | 3882.56 | 826 | 807 | 155.6 |
| B | 3 | 64 | 235827 | 1510.04 | 826 | 807 | 155.6 |
| B | 11 | 51 | 173022 | 1106.51 | 826 | 807 | 155.6 |
| C | 7 | 87 | 21585 | 111.43 | 807 | 814 | 186.4 |
| C | 13 | 61 | 5820 | 26.86 | 807 | 814 | 186.4 |
| C | 12 | 4 | 3488 | 14.34 | 807 | 814 | 186.4 |
| D | 1 | 52 | 596428 | 3100.1 | 808 | 789 | 192.1 |
| D | 2 | 120 | 88651 | 457.29 | 808 | 789 | 192.1 |
| D | 2 | 14 | 86175 | 444.41 | 808 | 789 | 192.1 |
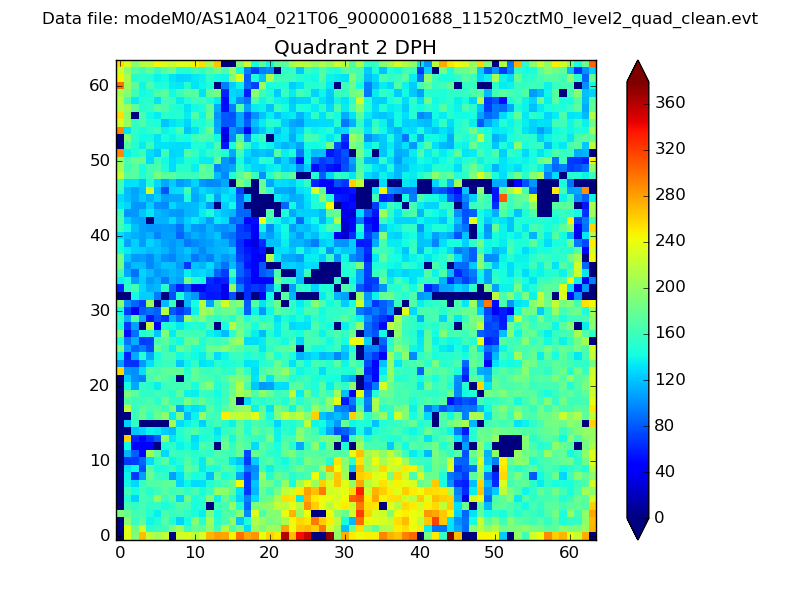
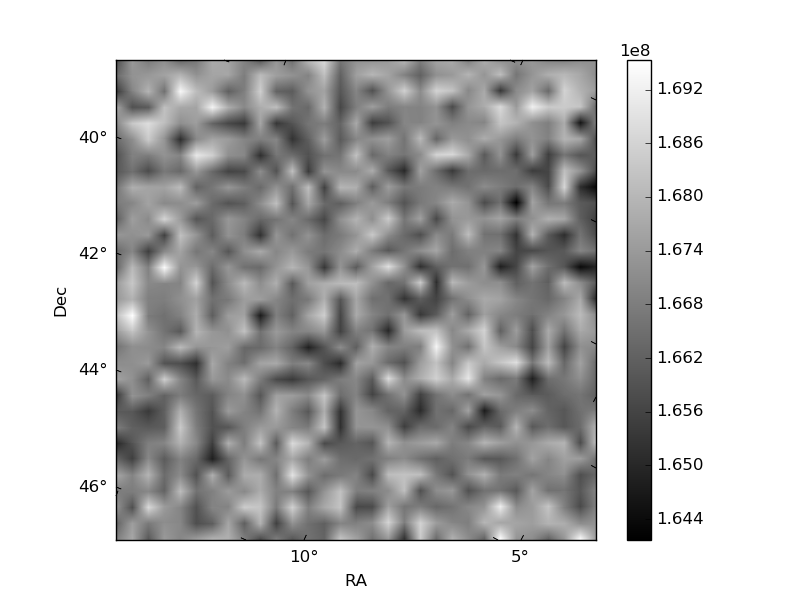
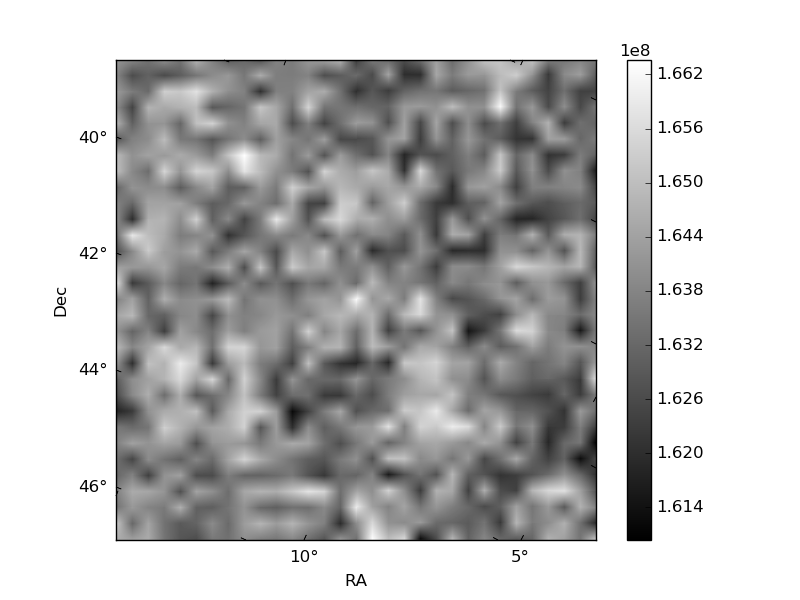
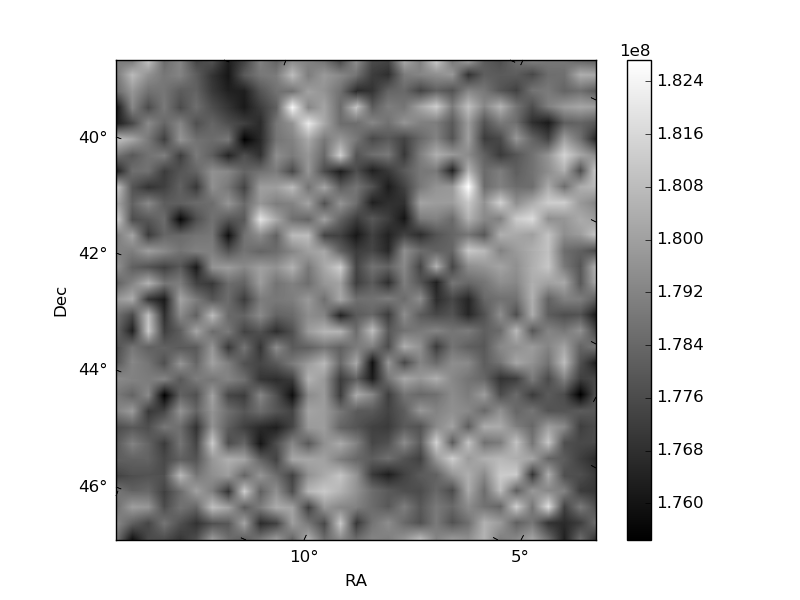
Histogram calculated using DETX and DETY for each event in the final _common_clean file
| Quadrant A | 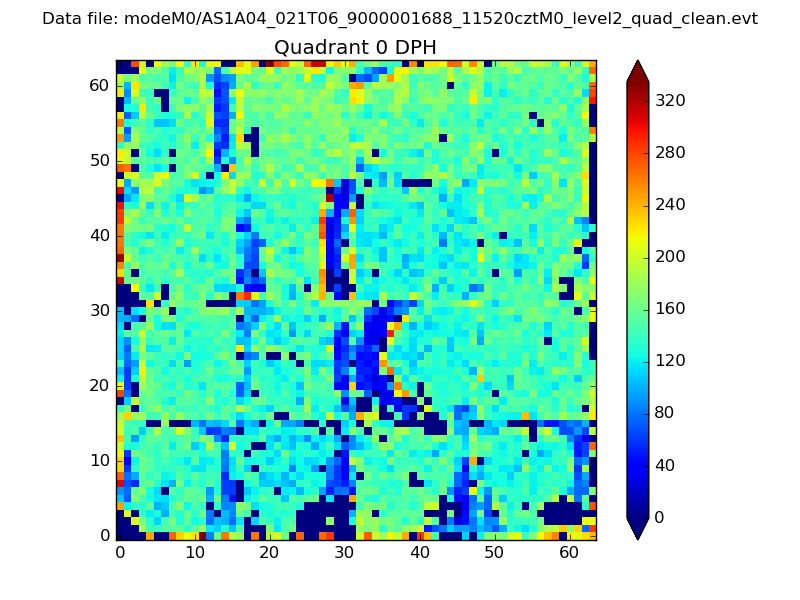 |
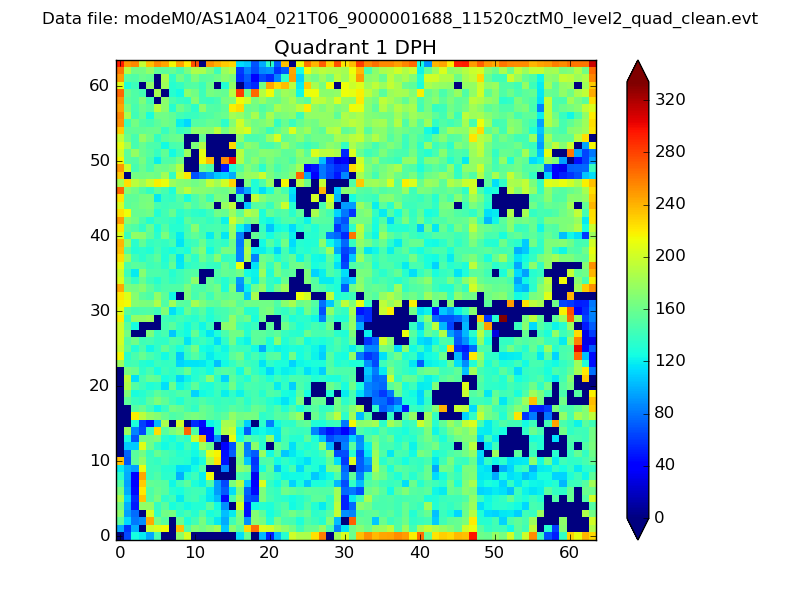 |
Quadrant B |
|---|---|---|---|
| Quadrant D | 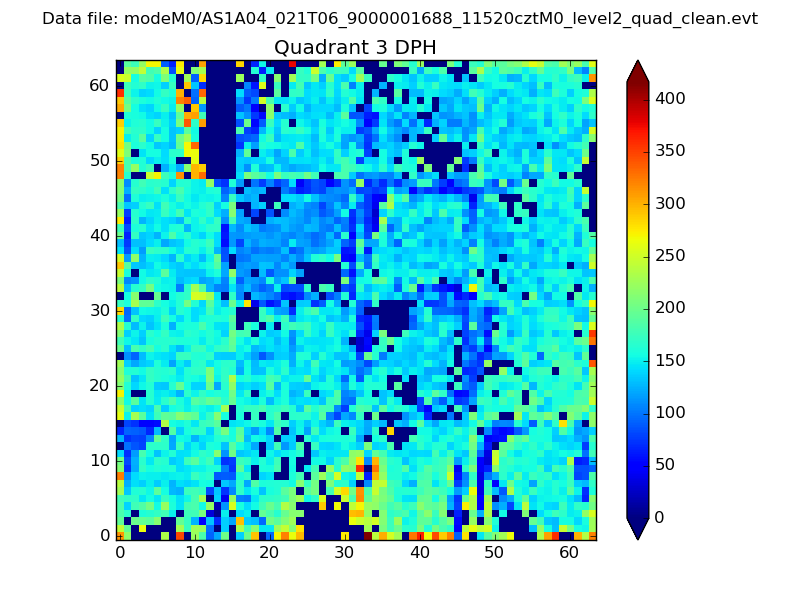 |
 |
Quadrant C |
| Plot type | Count rate plots | Images |
|---|---|---|
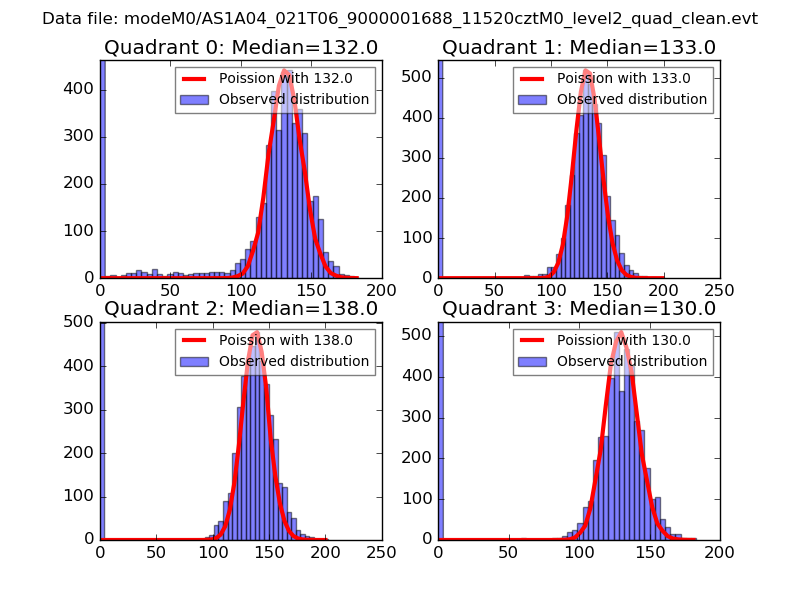
| Comparison with Poisson distribution Blue bars denote a histogram of data divided into 1 sec bins. Red curve is a Poisson curve with rate = median count rate of data. |
 |
 |
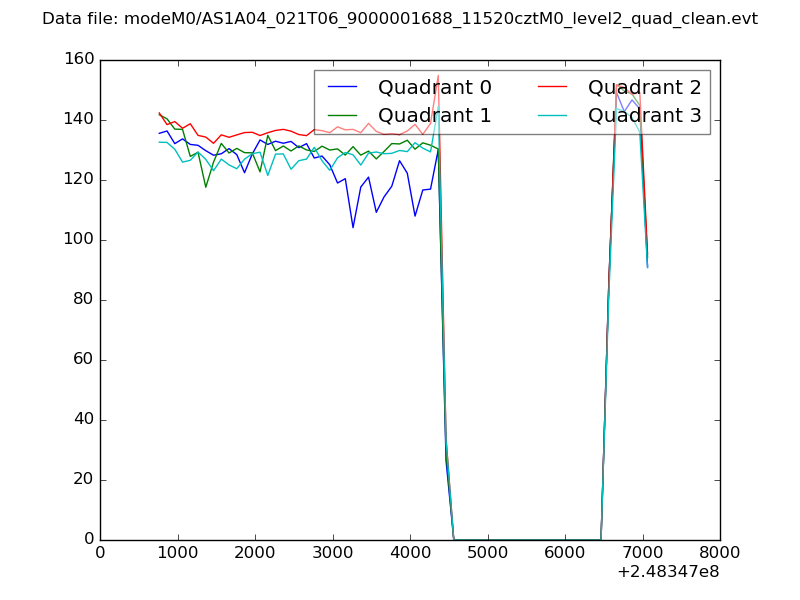
| Quadrant-wise count rates Data is divided into 100 sec bins |
 |
|
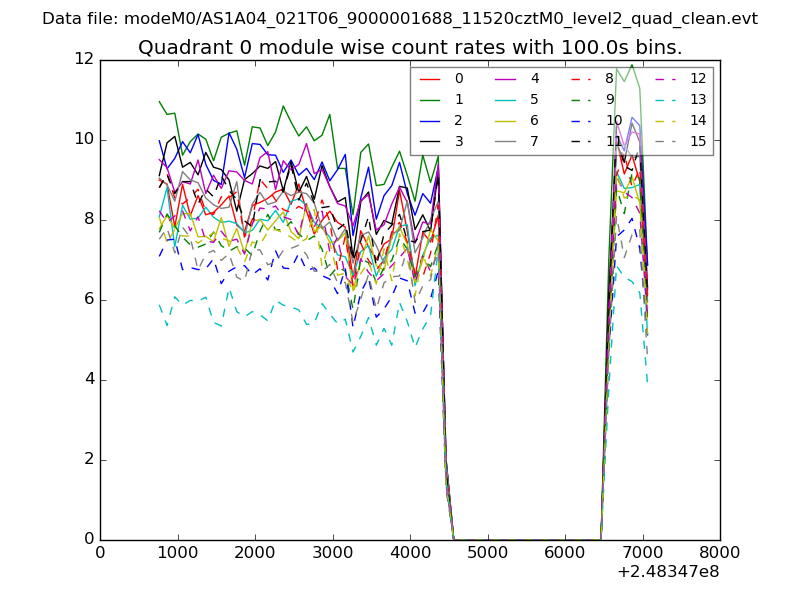
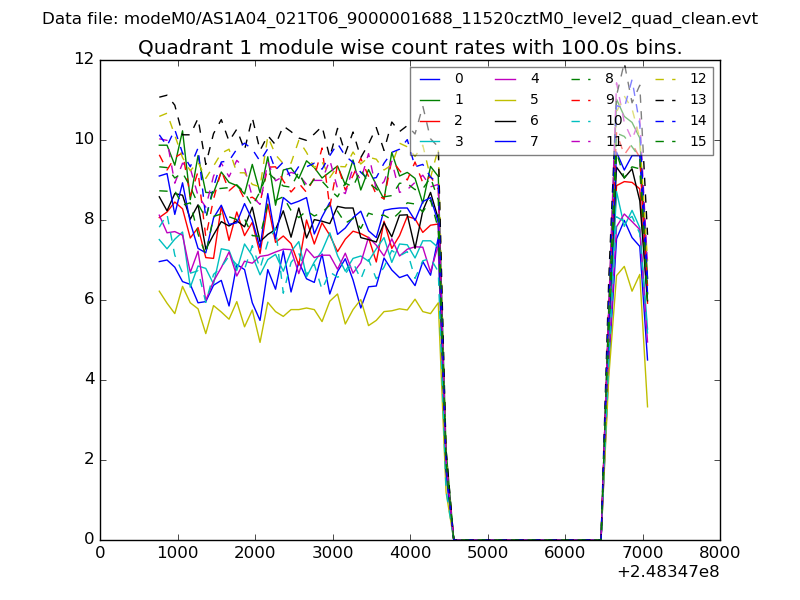
| Module-wise count rates for Quadrant A Data is divided into 100 sec bins |
 |
 |
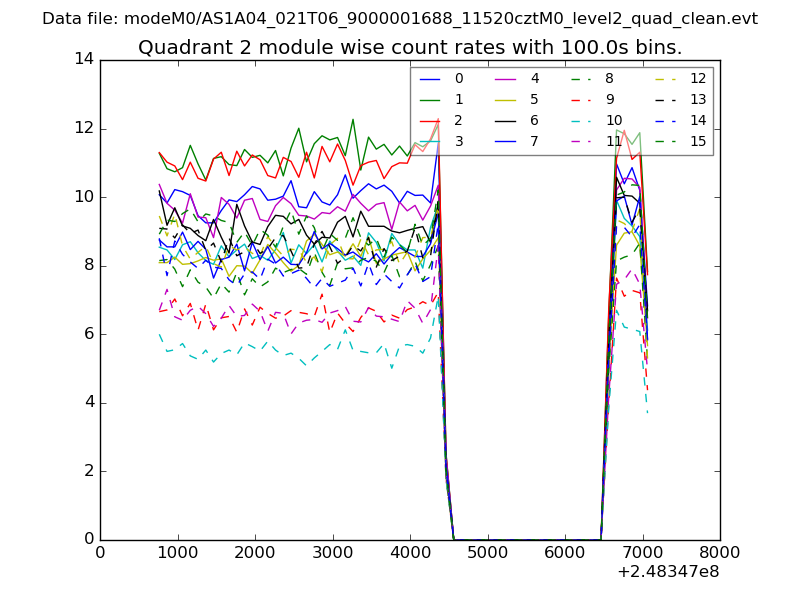
| Module-wise count rates for Quadrant B Data is divided into 100 sec bins |
 |
 |
| Module-wise count rates for Quadrant C Data is divided into 100 sec bins |
 |
 |
| Module-wise count rates for Quadrant D Data is divided into 100 sec bins |
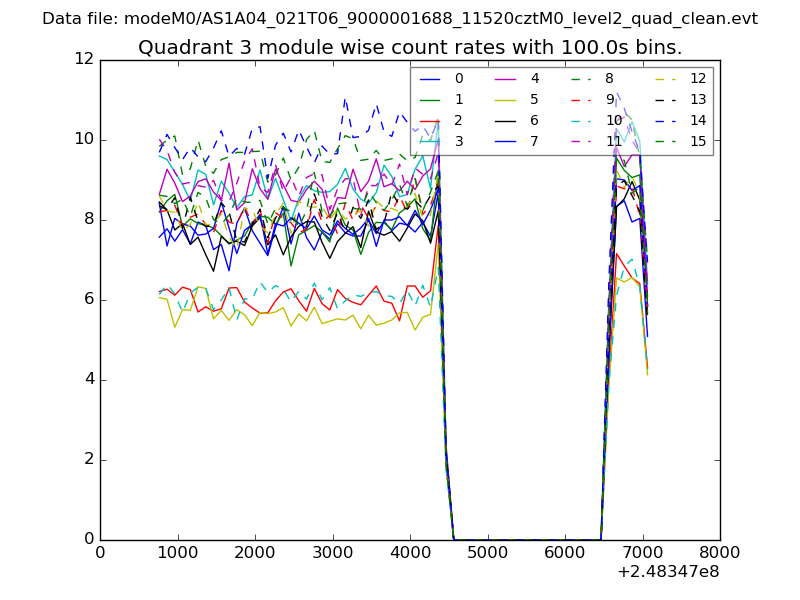 |
 |
| Parameter | Plot |
|---|---|
| CZT HV Monitor | 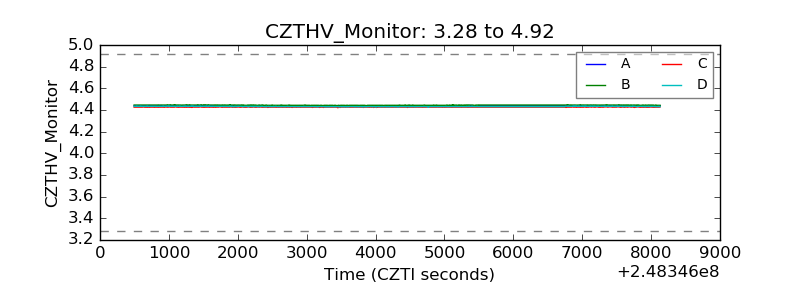 |
| D_VDD |  |
| Temperature 1 | 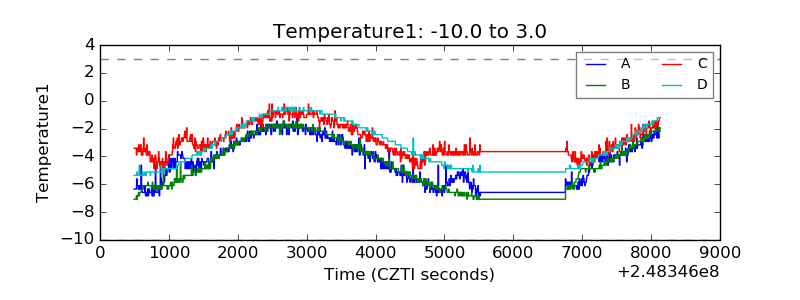 |
| Veto HV Monitor | 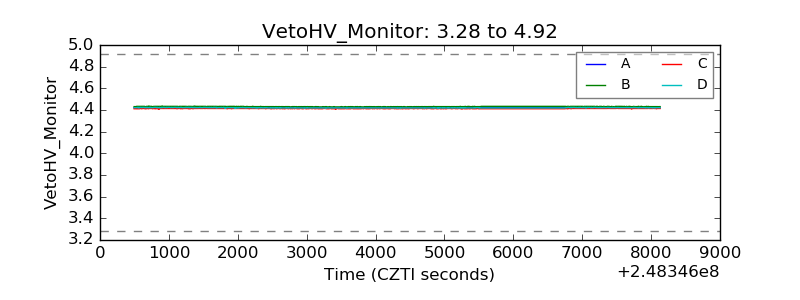 |
| Veto LLD | 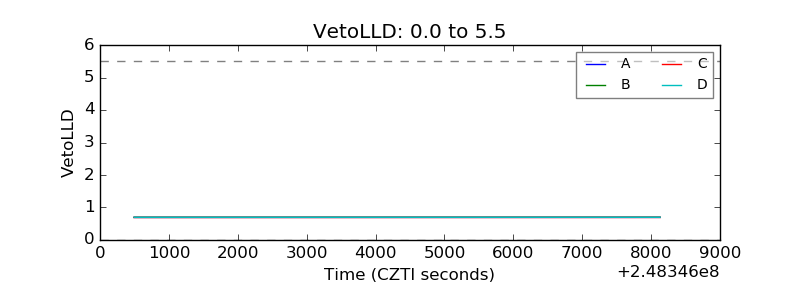 |
| Alpha Counter | 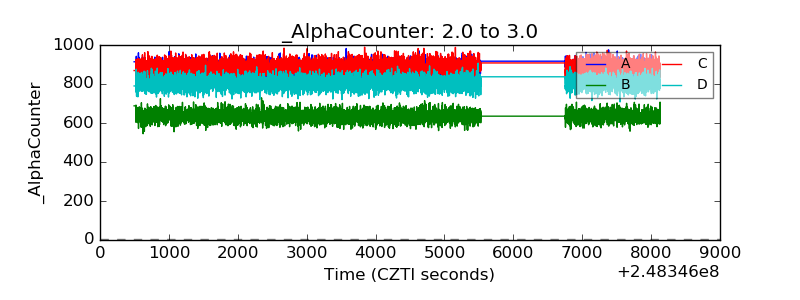 |
| _CPM_Rate | 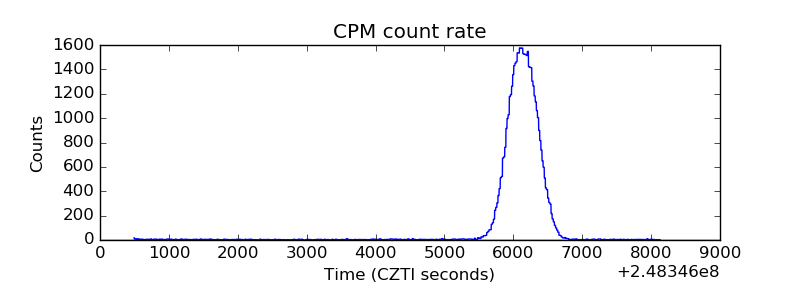 |
| CZT Counter | 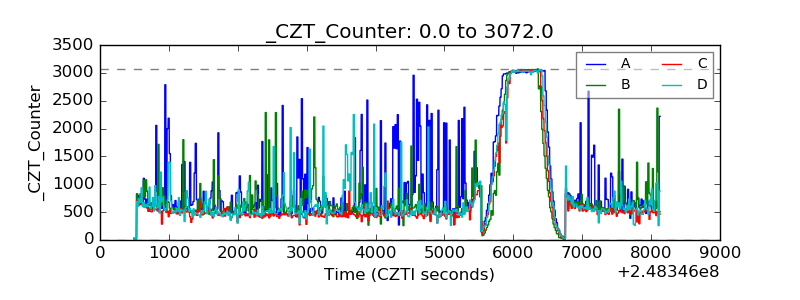 |
| +2.5 Volts monitor |  |
| +5 Volts monitor |  |
| _ROLL_ROT | 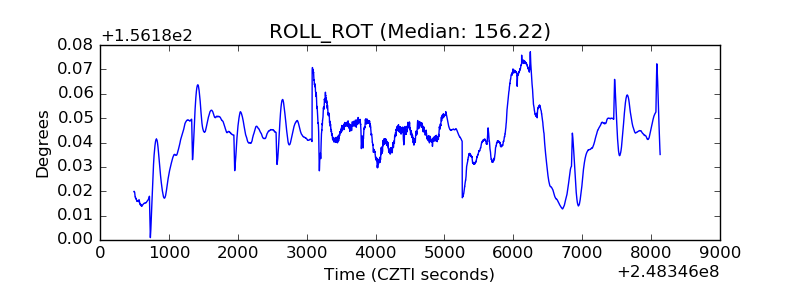 |
| _Roll_DEC | 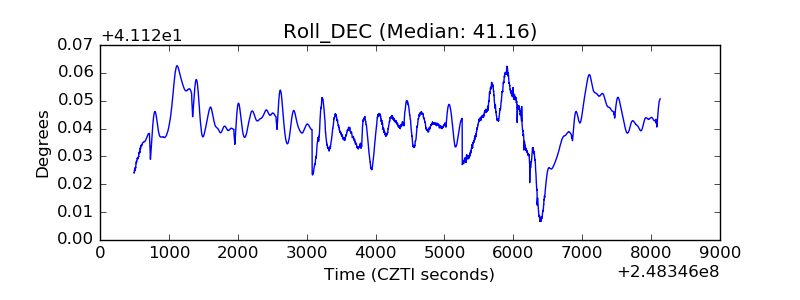 |
| _Roll_RA | 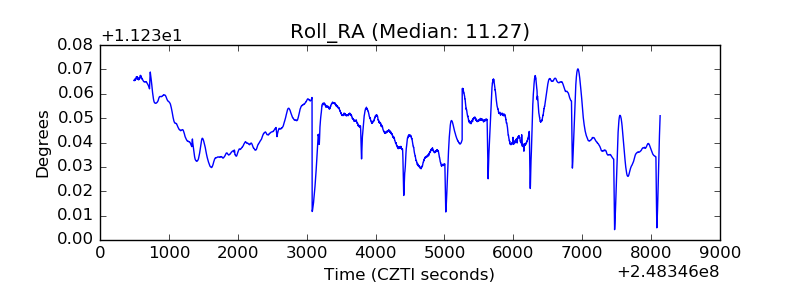 |
| Veto Counter | 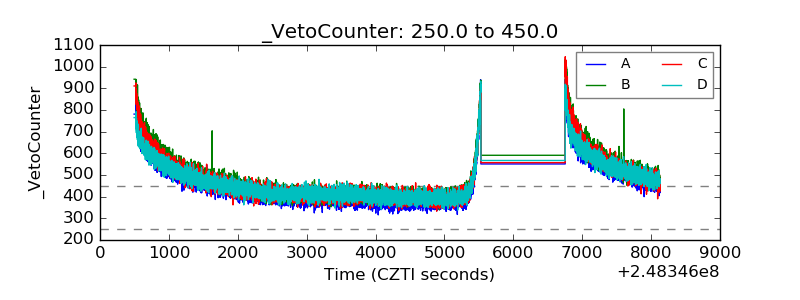 |