| Param | Original file | Final file |
|---|---|---|
| Filename | modeM0/AS1A04_021T06_9000001688_11521cztM0_level2.evt | modeM0/AS1A04_021T06_9000001688_11521cztM0_level2_quad_clean.evt |
| Size (bytes) | 616,510,080 | 96,811,200 |
| Size | 587.9 MB | 92.3 MB |
| Events in quadrant A | 5,403,143 | 610,563 |
| Events in quadrant B | 5,367,277 | 608,422 |
| Events in quadrant C | 3,131,071 | 656,429 |
| Events in quadrant D | 4,343,731 | 616,880 |
| Mode M0 | |||
|---|---|---|---|
| Quadrant | BADHDUFLAG | Total packets | Discarded packets |
| A | 0 | 20476 | 3 |
| B | 0 | 20232 | 2 |
| C | 0 | 13106 | 2 |
| D | 0 | 17126 | 2 |
| Mode SS | |||
|---|---|---|---|
| Quadrant | BADHDUFLAG | Total packets | Discarded packets |
| A | 0 | 128 | 0 |
| B | 0 | 128 | 0 |
| C | 0 | 128 | 0 |
| D | 0 | 128 | 0 |
| Mode M9 | |||
|---|---|---|---|
| Quadrant | BADHDUFLAG | Total packets | Discarded packets |
| A | 0 | 24 | 0 |
| B | 0 | 24 | 0 |
| C | 0 | 24 | 0 |
| D | 0 | 24 | 0 |
| Quadrant | Total seconds | Saturated seconds | Saturation percentage |
|---|---|---|---|
| A | 6293 | 650 | 10.328937% |
| B | 6293 | 667 | 10.599078% |
| C | 6293 | 63 | 1.001112% |
| D | 6293 | 122 | 1.938662% |
Noise dominated data is calculated using 1-second bins in cleaned event files. If a bin has >2000 counts, and if more than 50% of those come from <1% of pixels, then it is considered to be noise-dominated and hence unusable.
| Quadrant | # 1 sec bins | Bins with >0 counts | Bins with >2000 counts | High rate bins dominated by noise | Noise dominated (total time) | Noise dominated (detector-on time) | Marked lightcurve |
|---|---|---|---|---|---|---|---|
| A | 7594 | 6295 | 343 | 343 | 4.52% | 5.45% | 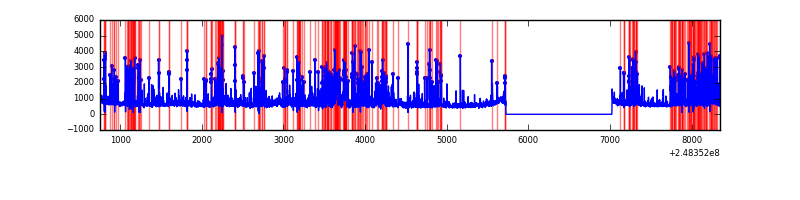 |
| B | 7594 | 6295 | 395 | 395 | 5.20% | 6.27% | 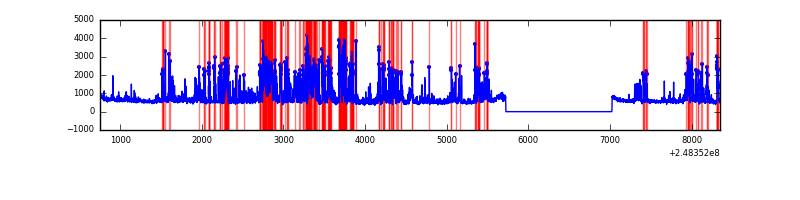 |
| C | 7594 | 6295 | 0 | 0 | 0.00% | 0.00% | 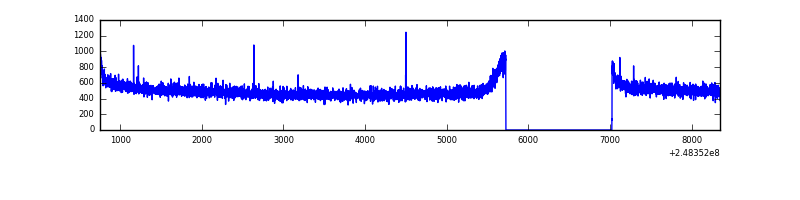 |
| D | 7594 | 6295 | 21 | 21 | 0.28% | 0.33% | 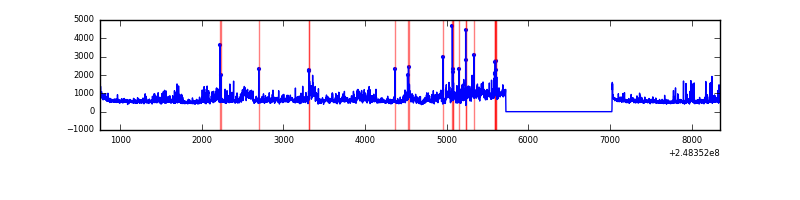 |
Top three noisy pixels from each quadrant. If the there are fewer than three noisy pixels in the level2.evt file, extra rows are filled as -1
| Pixel properties | Quadrant properties | ||||||
|---|---|---|---|---|---|---|---|
| Quadrant | DetID | PixID | Counts | Sigma | Mean | Median | Sigma |
| A | 8 | 5 | 2137456 | 13340.18 | 801 | 784 | 160.2 |
| A | 1 | 162 | 53425 | 328.66 | 801 | 784 | 160.2 |
| A | 9 | 143 | 43376 | 265.92 | 801 | 784 | 160.2 |
| B | 4 | 239 | 1279623 | 8593.7 | 797 | 781 | 148.8 |
| B | 3 | 64 | 677775 | 4549.34 | 797 | 781 | 148.8 |
| B | 11 | 51 | 143516 | 959.17 | 797 | 781 | 148.8 |
| C | 13 | 61 | 5705 | 26.58 | 801 | 807 | 184.2 |
| C | 7 | 87 | 5033 | 22.94 | 801 | 807 | 184.2 |
| C | 12 | 4 | 4844 | 21.91 | 801 | 807 | 184.2 |
| D | 13 | 152 | 449300 | 2359.56 | 805 | 787 | 190.1 |
| D | 8 | 195 | 260311 | 1365.31 | 805 | 787 | 190.1 |
| D | 1 | 52 | 207105 | 1085.4 | 805 | 787 | 190.1 |
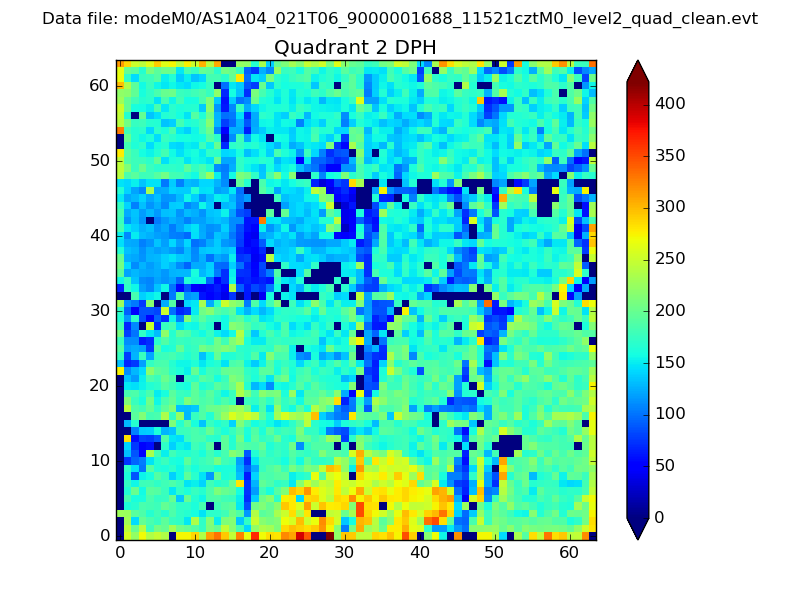
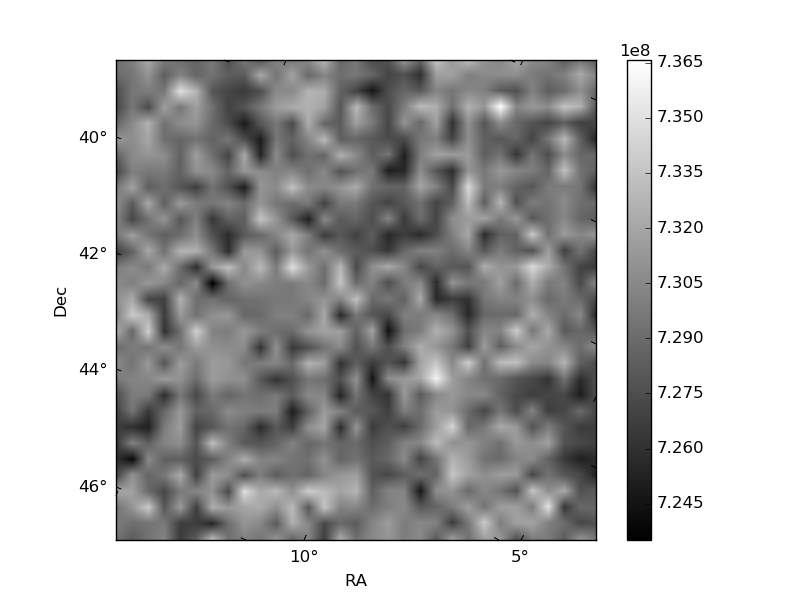
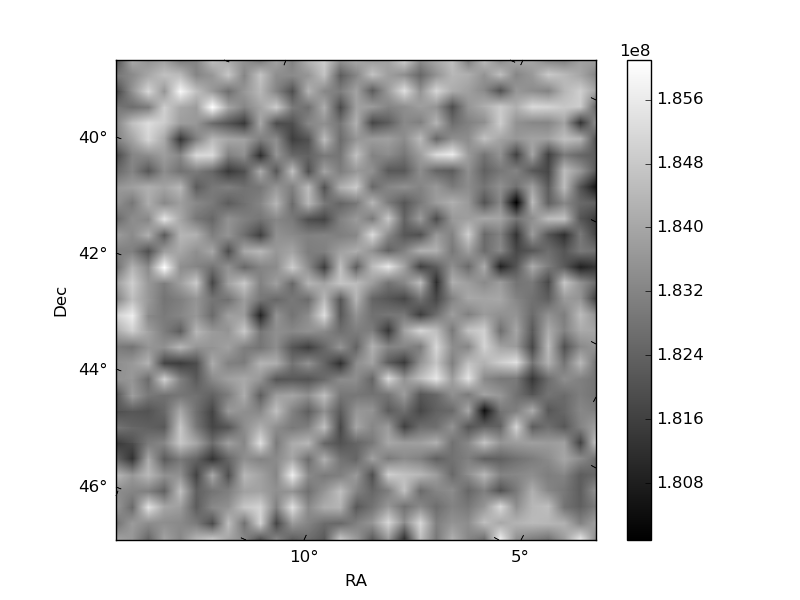
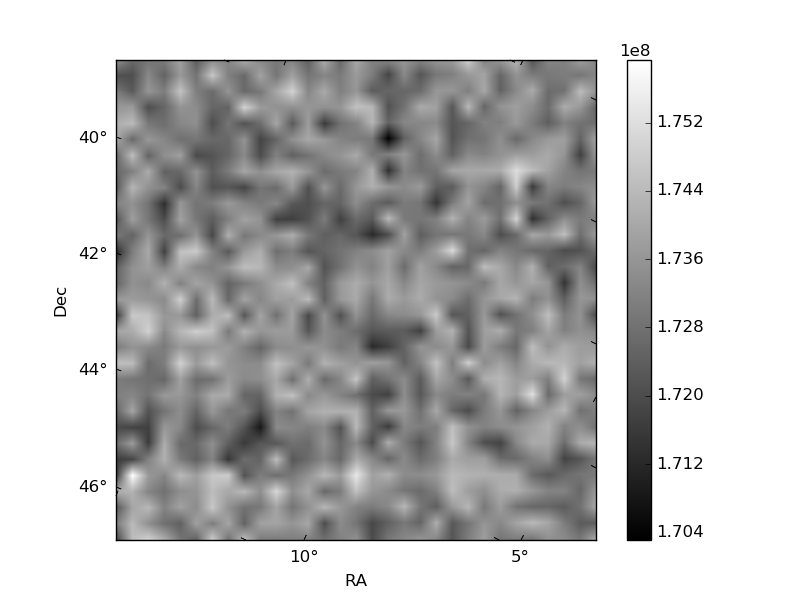
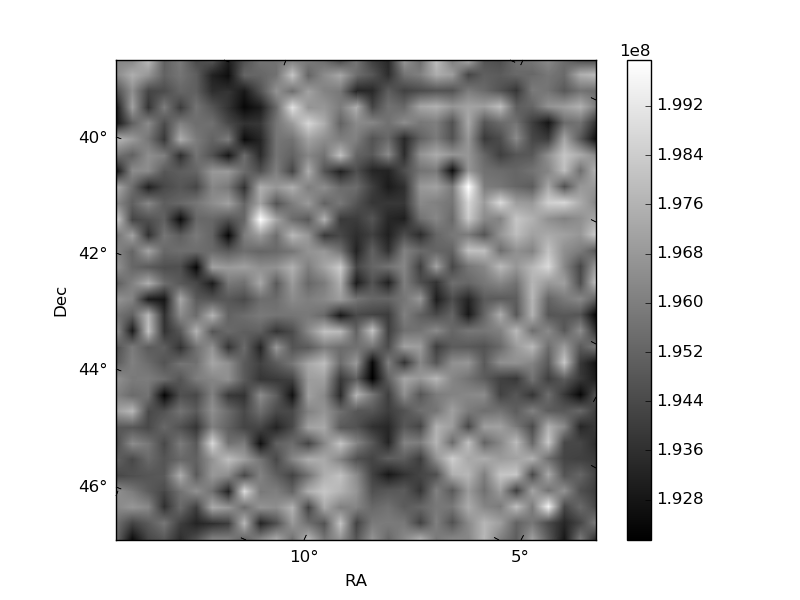
Histogram calculated using DETX and DETY for each event in the final _common_clean file
| Quadrant A | 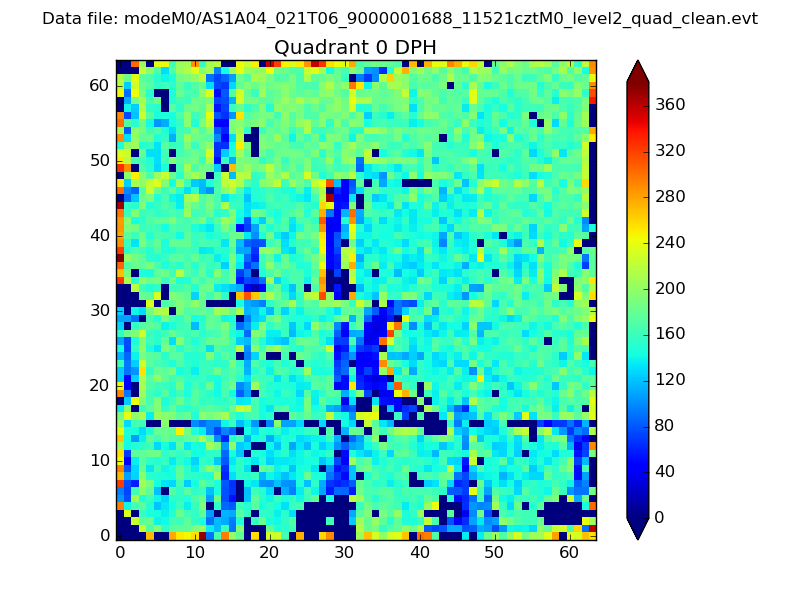 |
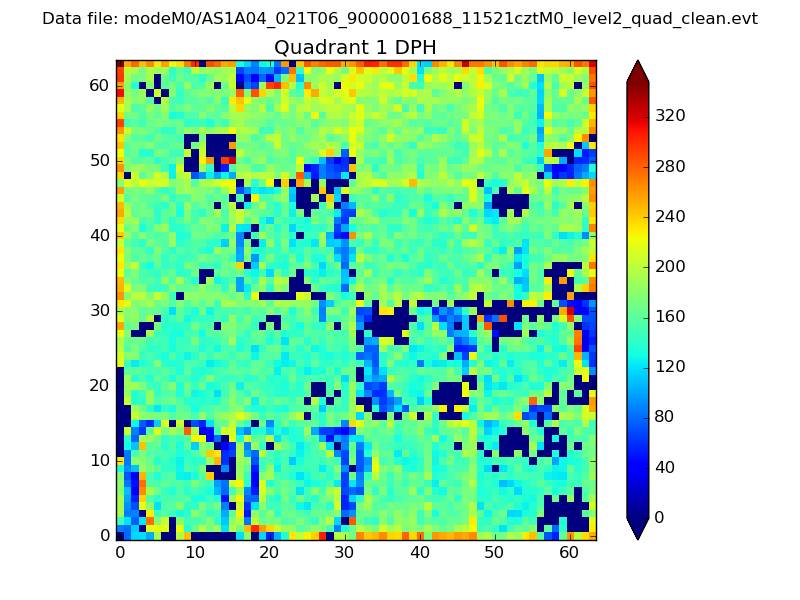 |
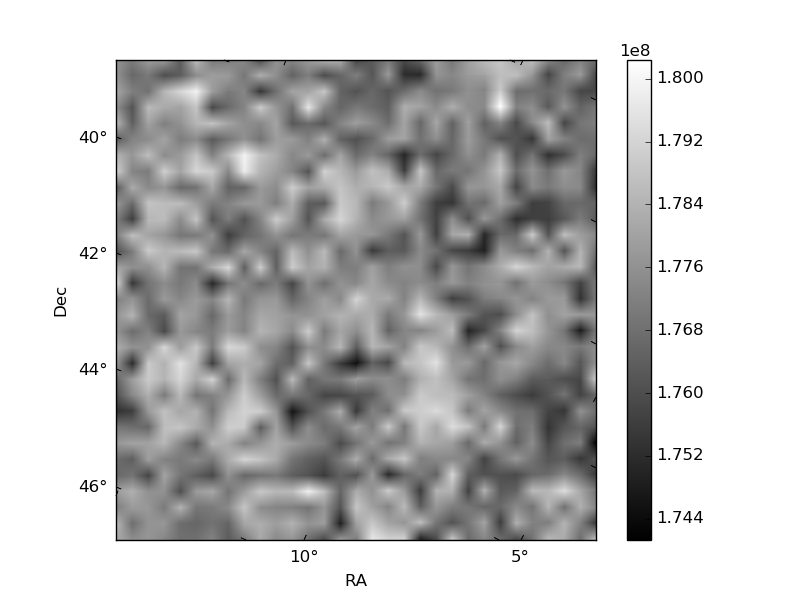
Quadrant B |
|---|---|---|---|
| Quadrant D | 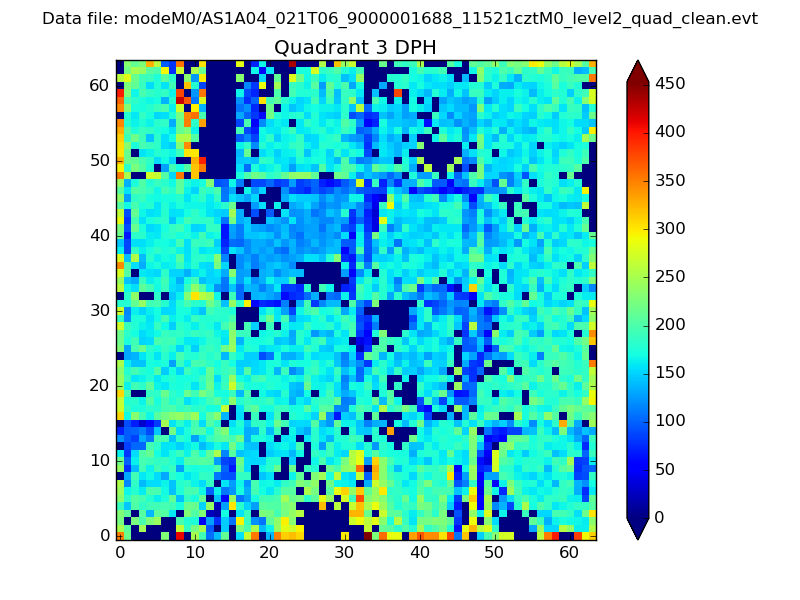 |
 |
Quadrant C |
| Plot type | Count rate plots | Images |
|---|---|---|
| Comparison with Poisson distribution Blue bars denote a histogram of data divided into 1 sec bins. Red curve is a Poisson curve with rate = median count rate of data. |
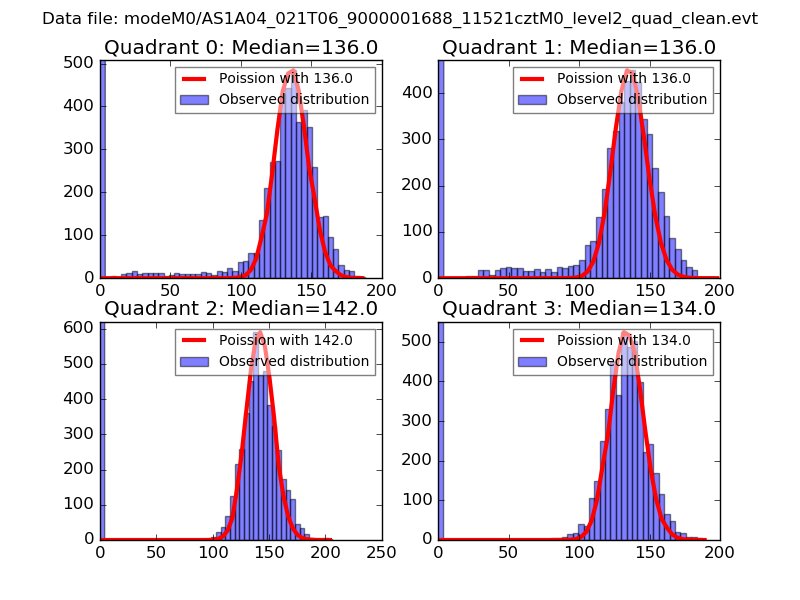 |
 |
| Quadrant-wise count rates Data is divided into 100 sec bins |
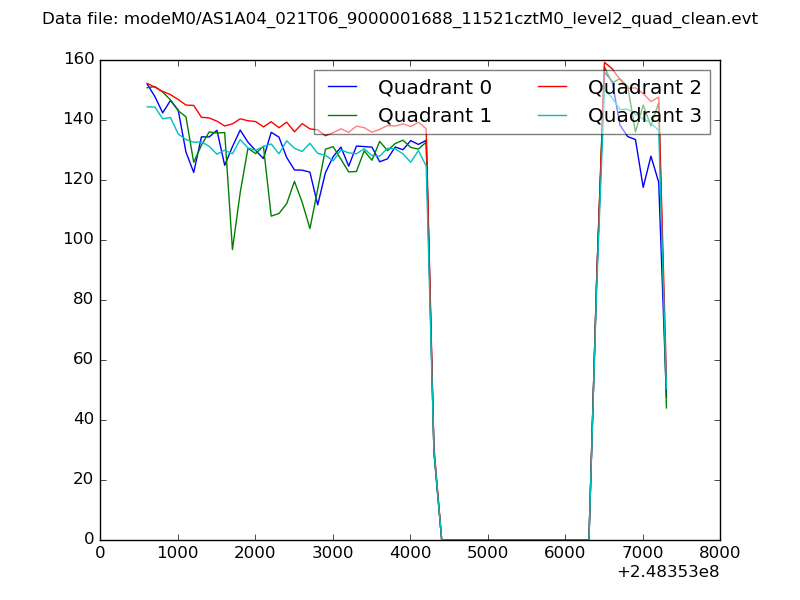 |
|
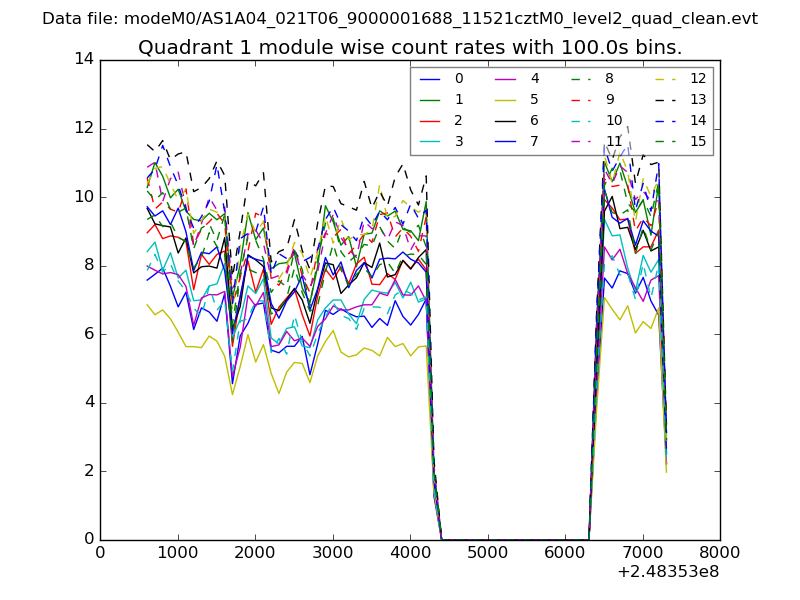
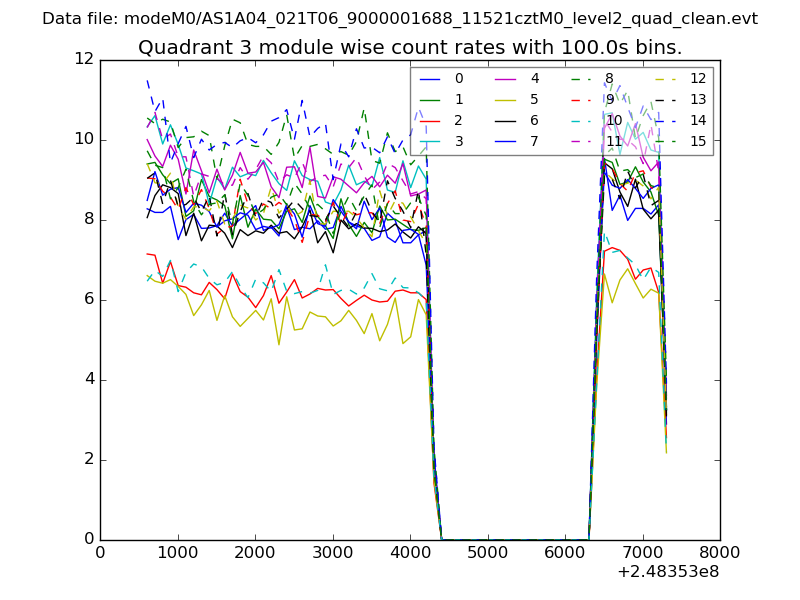
| Module-wise count rates for Quadrant A Data is divided into 100 sec bins |
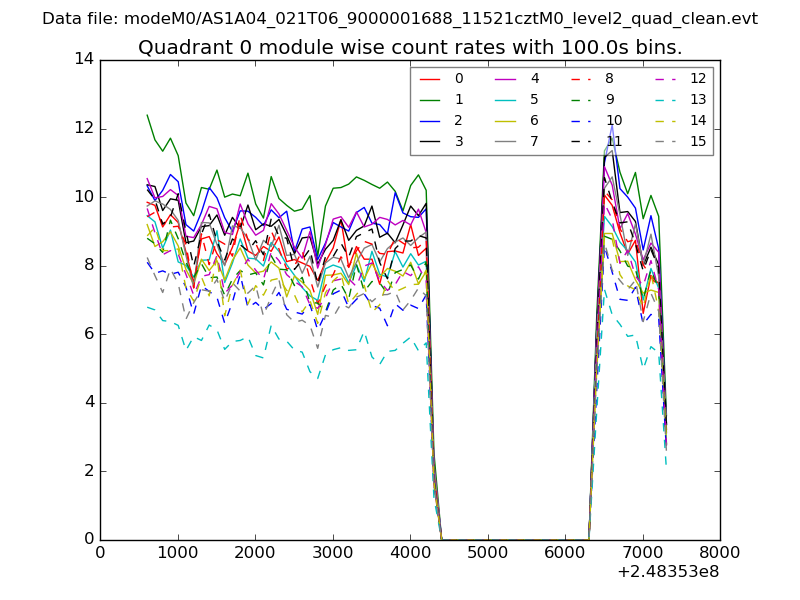 |
 |
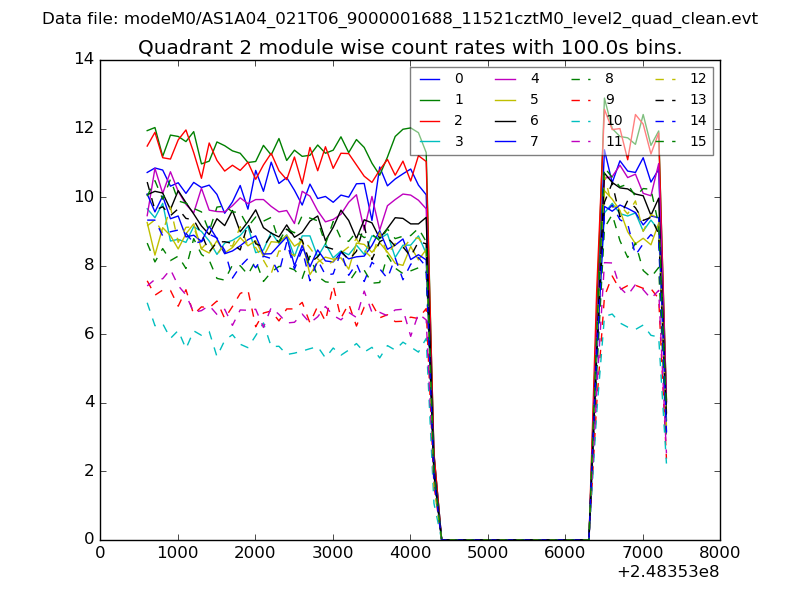
| Module-wise count rates for Quadrant B Data is divided into 100 sec bins |
 |
 |
| Module-wise count rates for Quadrant C Data is divided into 100 sec bins |
 |
 |
| Module-wise count rates for Quadrant D Data is divided into 100 sec bins |
 |
 |
| Parameter | Plot |
|---|---|
| CZT HV Monitor | 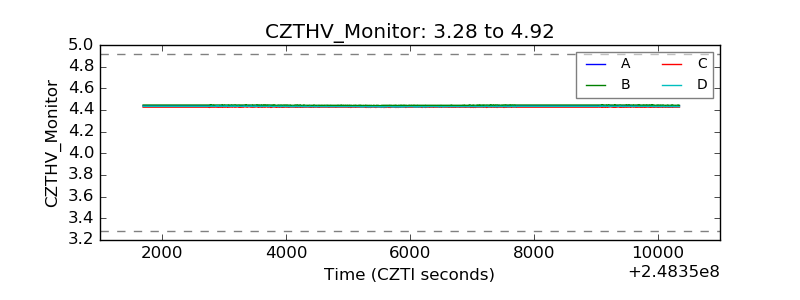 |
| D_VDD | 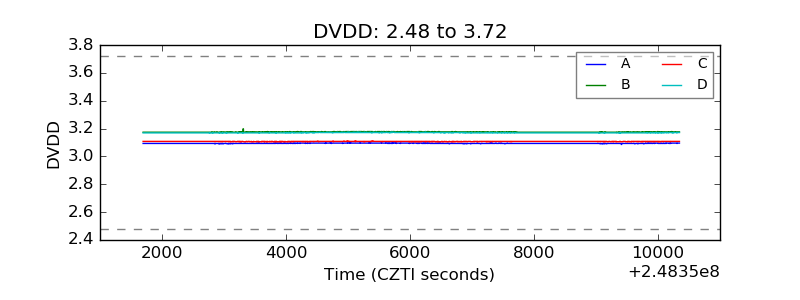 |
| Temperature 1 | 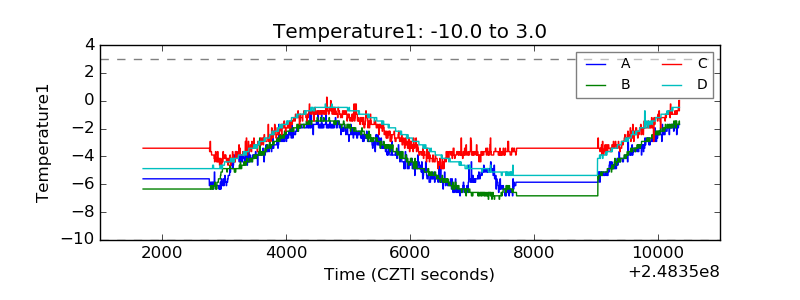 |
| Veto HV Monitor | 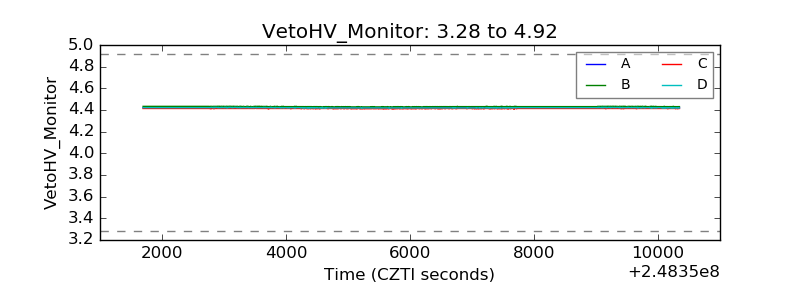 |
| Veto LLD |  |
| Alpha Counter | 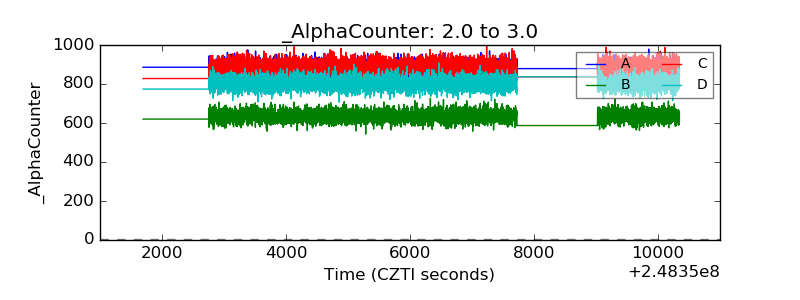 |
| _CPM_Rate | 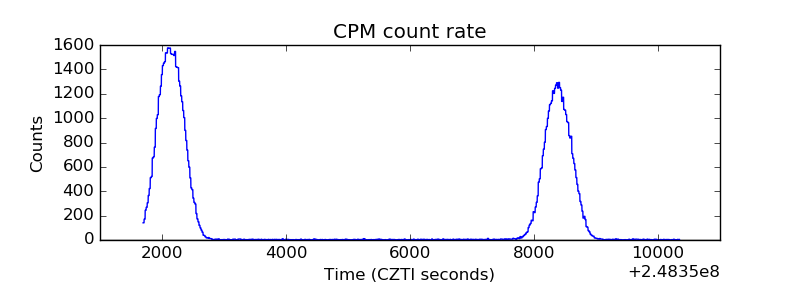 |
| CZT Counter | 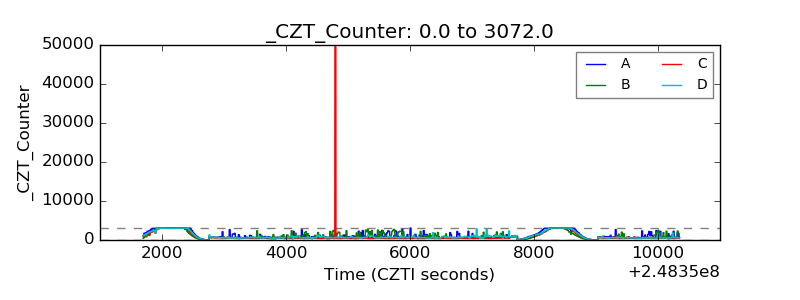 |
| +2.5 Volts monitor | 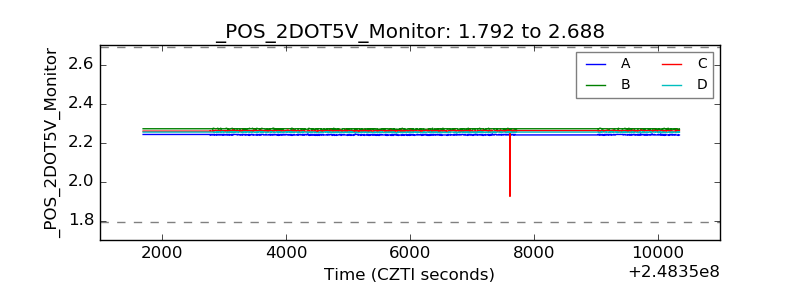 |
| +5 Volts monitor |  |
| _ROLL_ROT | 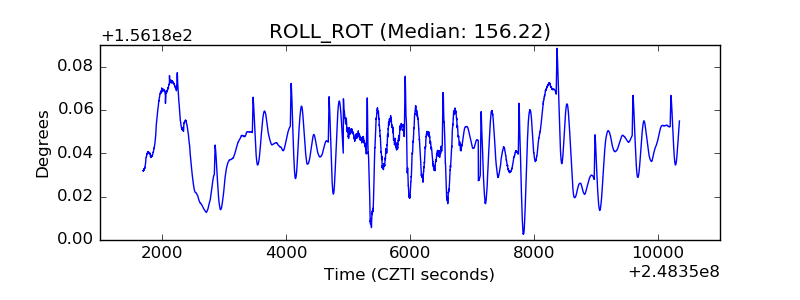 |
| _Roll_DEC | 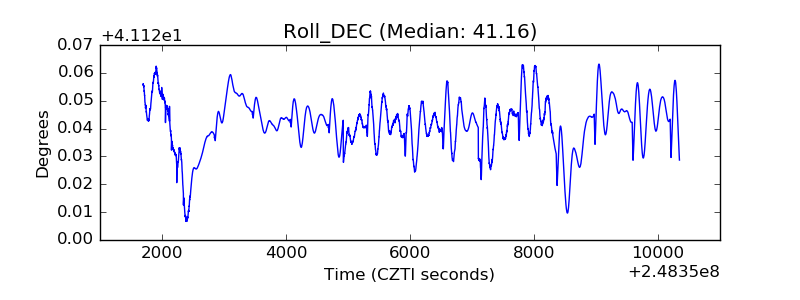 |
| _Roll_RA | 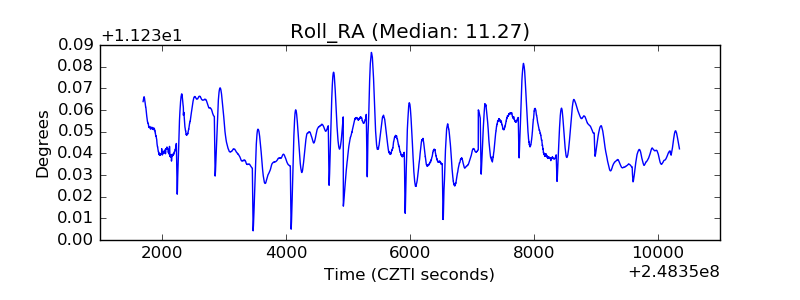 |
| Veto Counter | 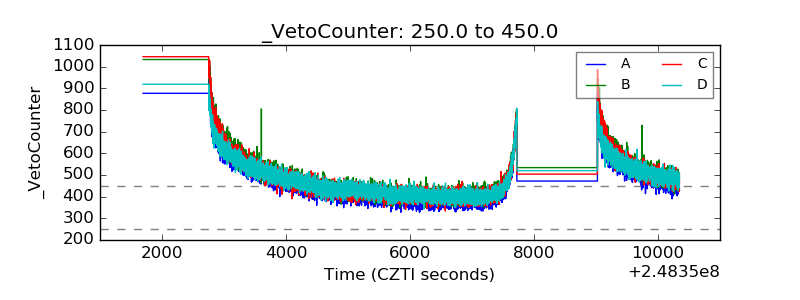 |