| Param | Original file | Final file |
|---|---|---|
| Filename | modeM0/AS1A04_021T06_9000001688_11522cztM0_level2.evt | modeM0/AS1A04_021T06_9000001688_11522cztM0_level2_quad_clean.evt |
| Size (bytes) | 247,285,440 | 40,625,280 |
| Size | 235.8 MB | 38.7 MB |
| Events in quadrant A | 2,623,297 | 248,661 |
| Events in quadrant B | 1,940,815 | 266,698 |
| Events in quadrant C | 1,173,928 | 279,812 |
| Events in quadrant D | 1,589,611 | 265,036 |
| Mode M0 | |||
|---|---|---|---|
| Quadrant | BADHDUFLAG | Total packets | Discarded packets |
| A | 0 | 9465 | 1 |
| B | 0 | 7364 | 1 |
| C | 0 | 4857 | 1 |
| D | 0 | 6256 | 1 |
| Mode SS | |||
|---|---|---|---|
| Quadrant | BADHDUFLAG | Total packets | Discarded packets |
| A | 0 | 46 | 0 |
| B | 0 | 46 | 0 |
| C | 0 | 46 | 0 |
| D | 0 | 46 | 0 |
| Mode M9 | |||
|---|---|---|---|
| Quadrant | BADHDUFLAG | Total packets | Discarded packets |
| A | 0 | 3 | 0 |
| B | 0 | 3 | 0 |
| C | 0 | 3 | 0 |
| D | 0 | 4 | 0 |
| Quadrant | Total seconds | Saturated seconds | Saturation percentage |
|---|---|---|---|
| A | 2357 | 418 | 17.734408% |
| B | 2357 | 161 | 6.830717% |
| C | 2357 | 1 | 0.042427% |
| D | 2357 | 37 | 1.569792% |
Noise dominated data is calculated using 1-second bins in cleaned event files. If a bin has >2000 counts, and if more than 50% of those come from <1% of pixels, then it is considered to be noise-dominated and hence unusable.
| Quadrant | # 1 sec bins | Bins with >0 counts | Bins with >2000 counts | High rate bins dominated by noise | Noise dominated (total time) | Noise dominated (detector-on time) | Marked lightcurve |
|---|---|---|---|---|---|---|---|
| A | 2358 | 2358 | 280 | 280 | 11.87% | 11.87% | 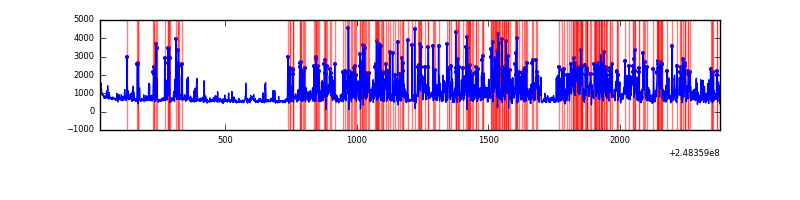 |
| B | 2358 | 2358 | 106 | 106 | 4.50% | 4.50% | 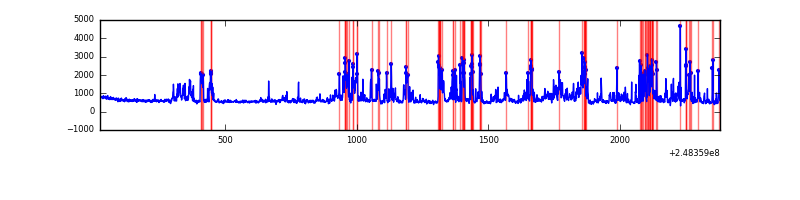 |
| C | 2358 | 2358 | 0 | 0 | 0.00% | 0.00% |  |
| D | 2358 | 2358 | 25 | 25 | 1.06% | 1.06% | 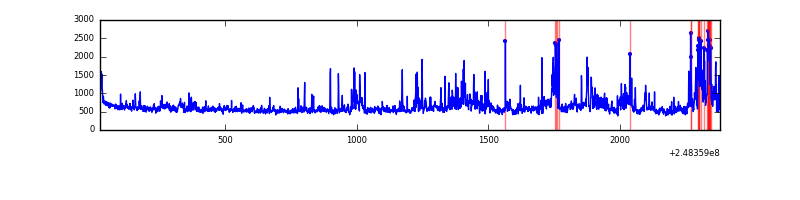 |
Top three noisy pixels from each quadrant. If the there are fewer than three noisy pixels in the level2.evt file, extra rows are filled as -1
| Pixel properties | Quadrant properties | ||||||
|---|---|---|---|---|---|---|---|
| Quadrant | DetID | PixID | Counts | Sigma | Mean | Median | Sigma |
| A | 8 | 5 | 1408218 | 23397.77 | 294 | 289 | 60.2 |
| A | 1 | 162 | 22518 | 369.41 | 294 | 289 | 60.2 |
| A | 9 | 143 | 17963 | 293.72 | 294 | 289 | 60.2 |
| B | 4 | 239 | 405448 | 6951.13 | 302 | 296 | 58.3 |
| B | 3 | 64 | 238410 | 4085.29 | 302 | 296 | 58.3 |
| B | 11 | 51 | 37179 | 632.8 | 302 | 296 | 58.3 |
| C | 7 | 87 | 4337 | 58.14 | 299 | 301 | 69.4 |
| C | 13 | 61 | 2197 | 27.31 | 299 | 301 | 69.4 |
| C | 14 | 234 | 1179 | 12.65 | 299 | 301 | 69.4 |
| D | 6 | 219 | 125889 | 1717.53 | 304 | 297 | 73.1 |
| D | 5 | 222 | 83777 | 1141.63 | 304 | 297 | 73.1 |
| D | 8 | 195 | 71494 | 973.65 | 304 | 297 | 73.1 |
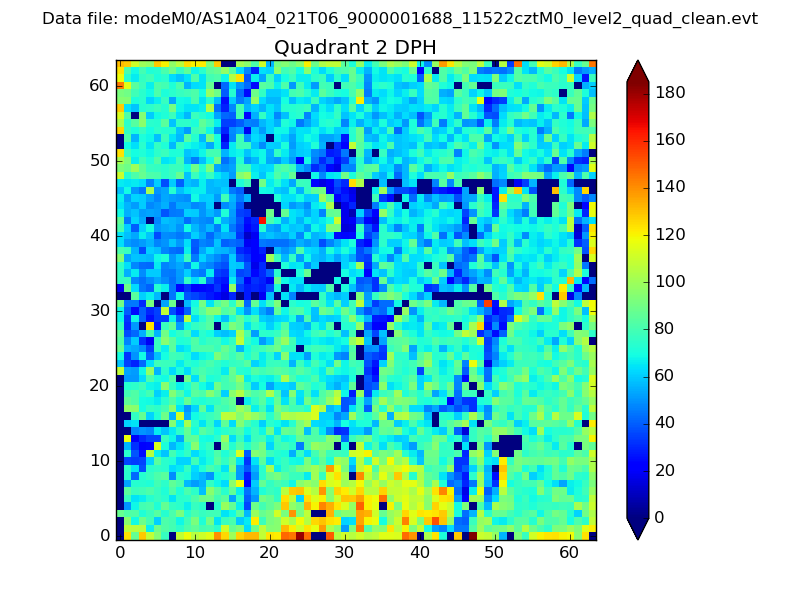
Histogram calculated using DETX and DETY for each event in the final _common_clean file
| Quadrant A | 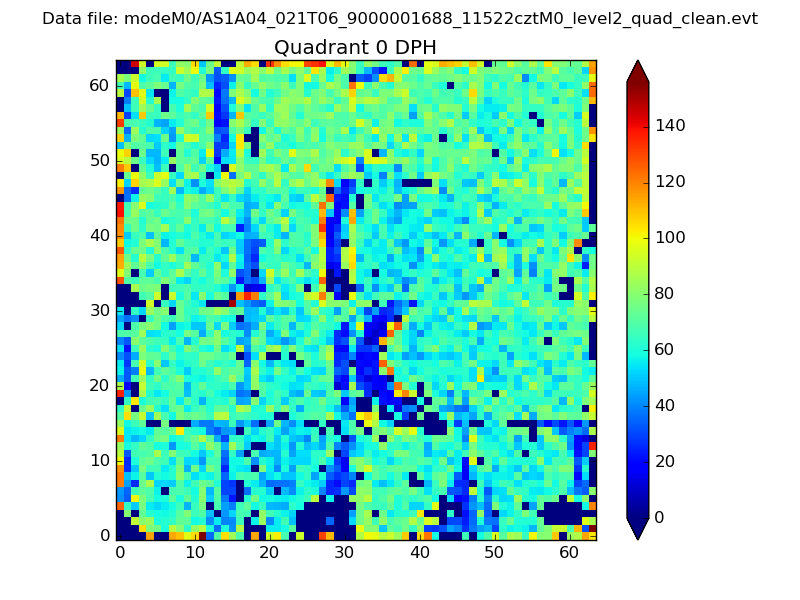 |
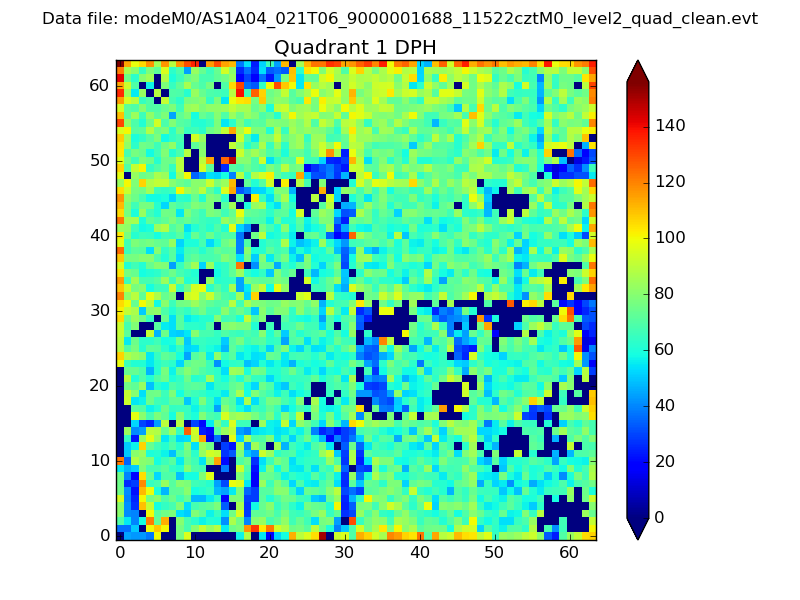 |
Quadrant B |
|---|---|---|---|
| Quadrant D | 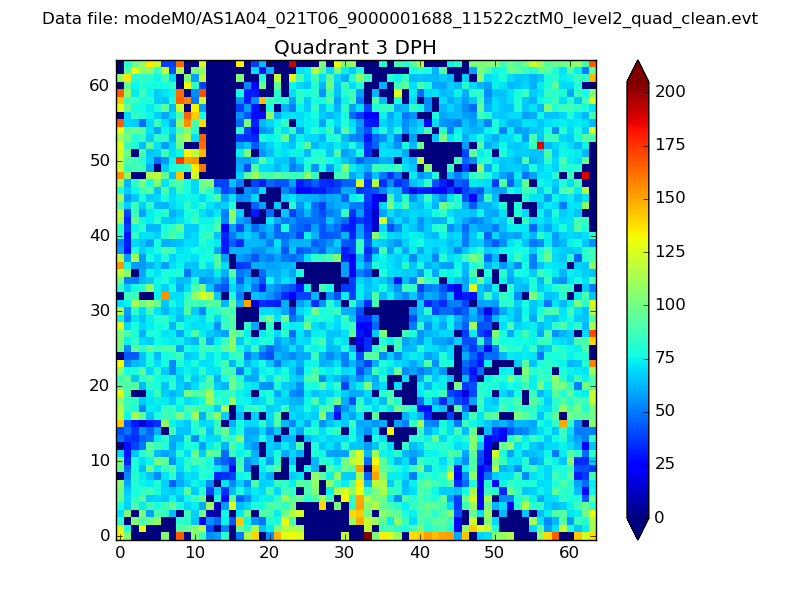 |
 |
Quadrant C |
| Plot type | Count rate plots | Images |
|---|---|---|
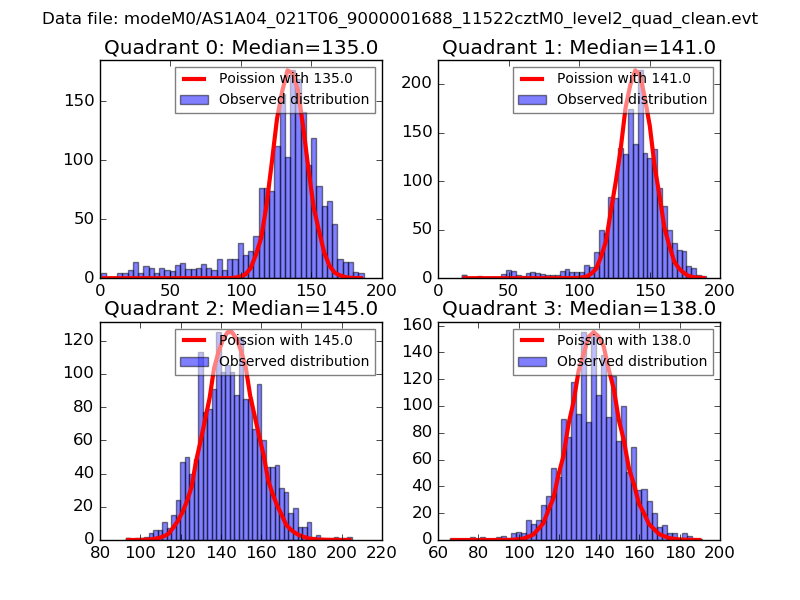
| Comparison with Poisson distribution Blue bars denote a histogram of data divided into 1 sec bins. Red curve is a Poisson curve with rate = median count rate of data. |
 |
 |
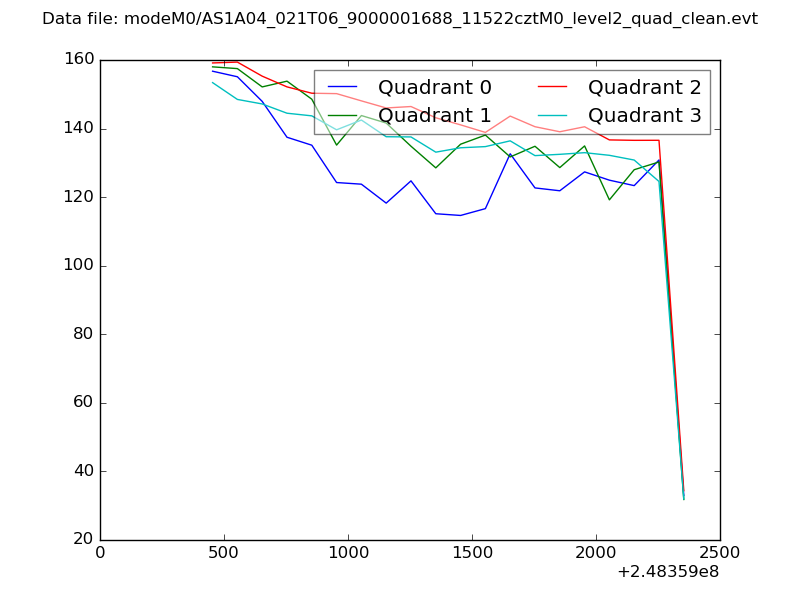
| Quadrant-wise count rates Data is divided into 100 sec bins |
 |
|
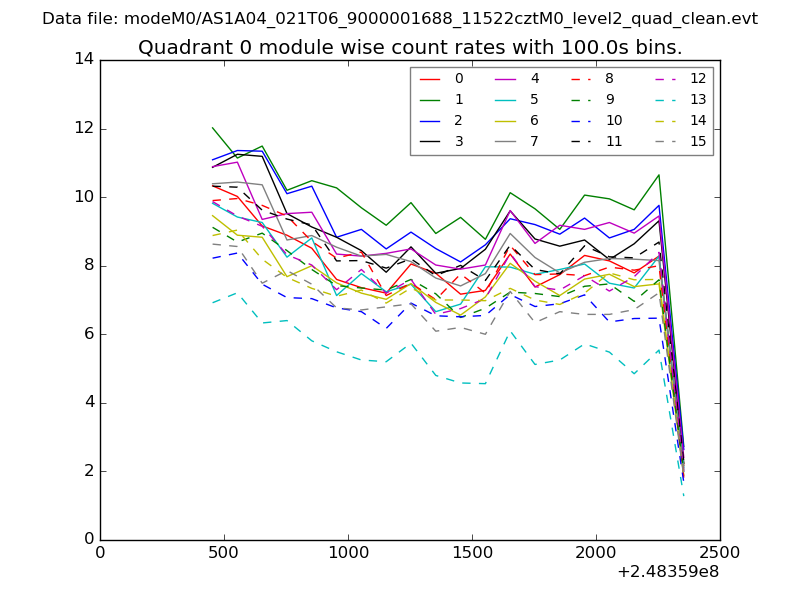
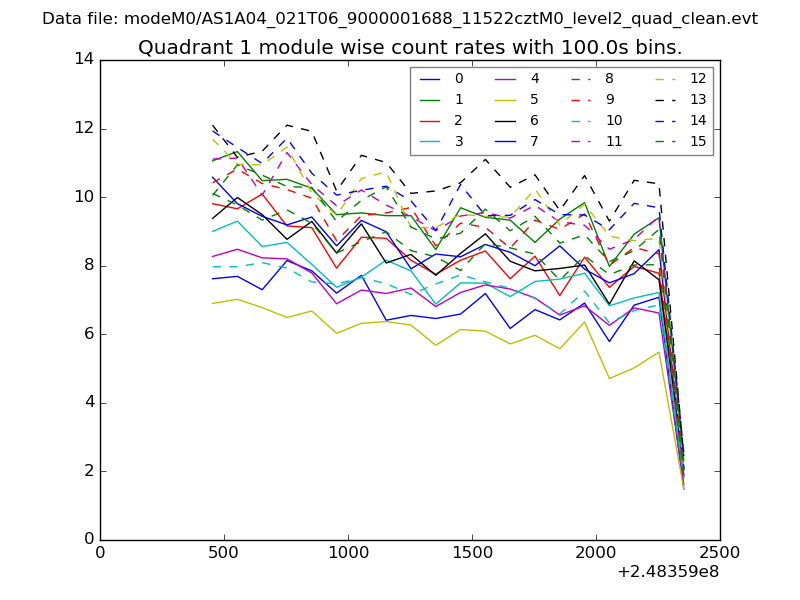
| Module-wise count rates for Quadrant A Data is divided into 100 sec bins |
 |
 |
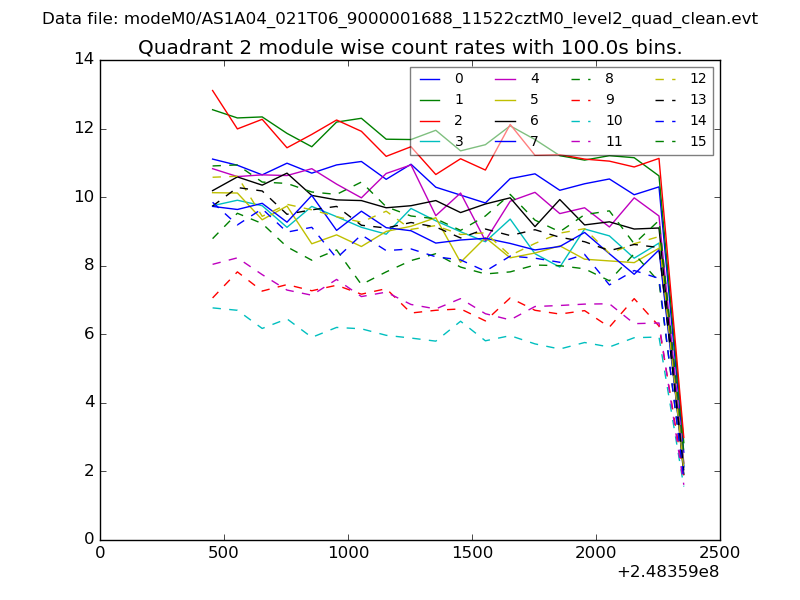
| Module-wise count rates for Quadrant B Data is divided into 100 sec bins |
 |
 |
| Module-wise count rates for Quadrant C Data is divided into 100 sec bins |
 |
 |
| Module-wise count rates for Quadrant D Data is divided into 100 sec bins |
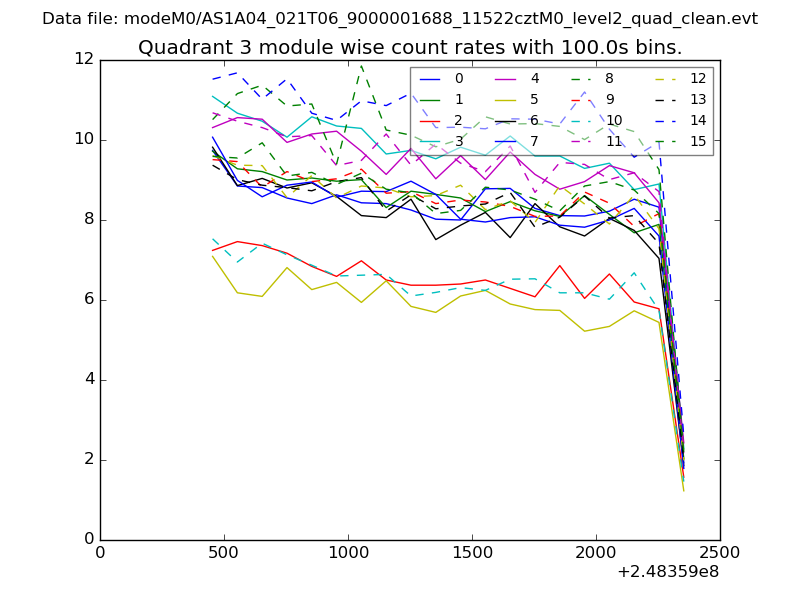 |
 |
| Parameter | Plot |
|---|---|
| CZT HV Monitor | 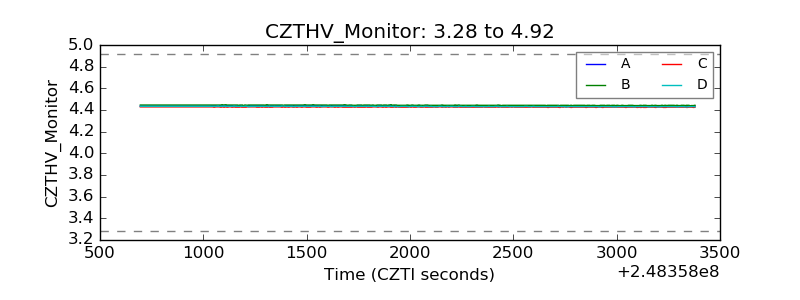 |
| D_VDD |  |
| Temperature 1 | 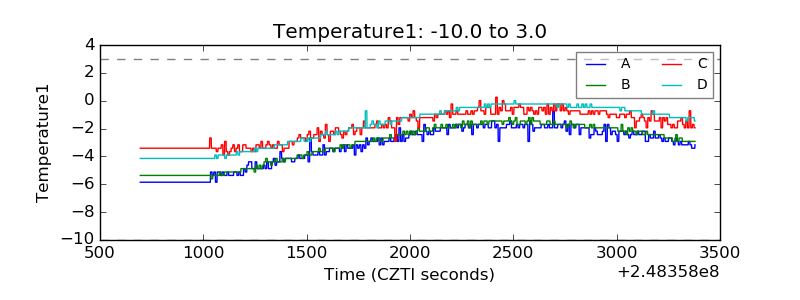 |
| Veto HV Monitor | 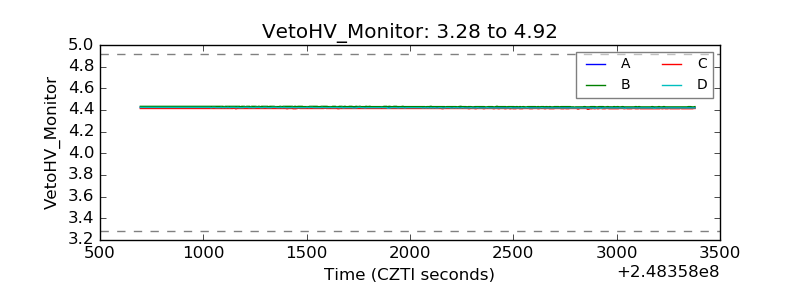 |
| Veto LLD | 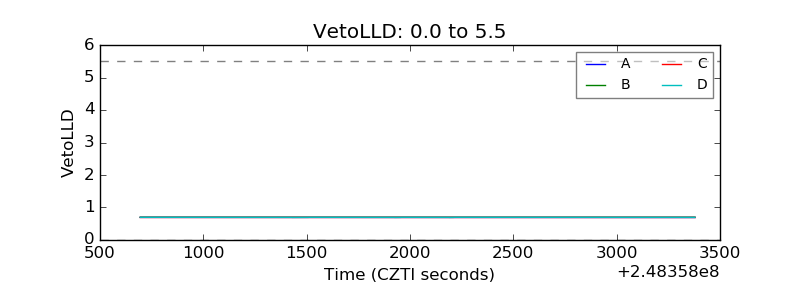 |
| Alpha Counter | 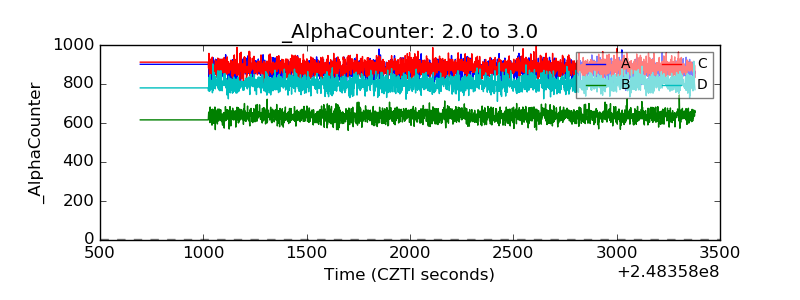 |
| _CPM_Rate | 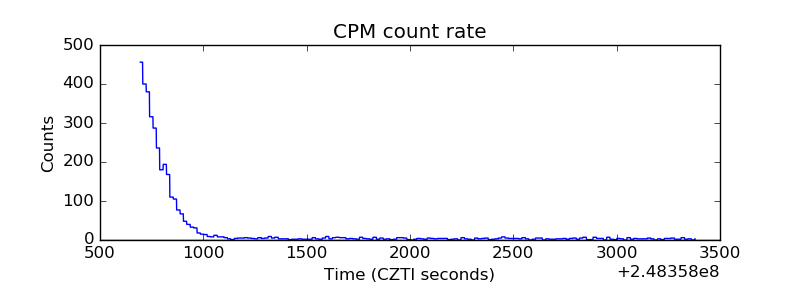 |
| CZT Counter | 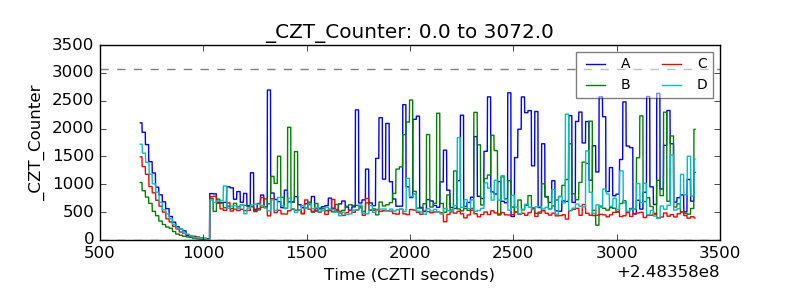 |
| +2.5 Volts monitor |  |
| +5 Volts monitor |  |
| _ROLL_ROT | 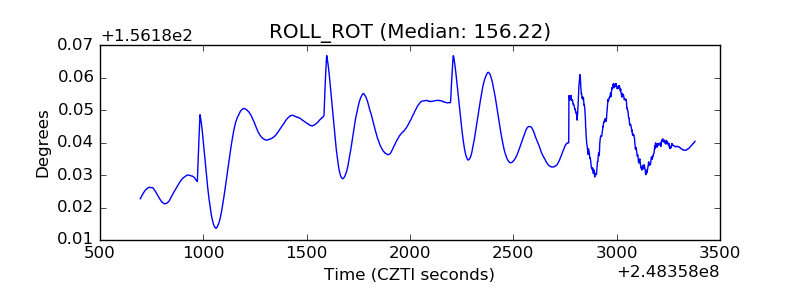 |
| _Roll_DEC | 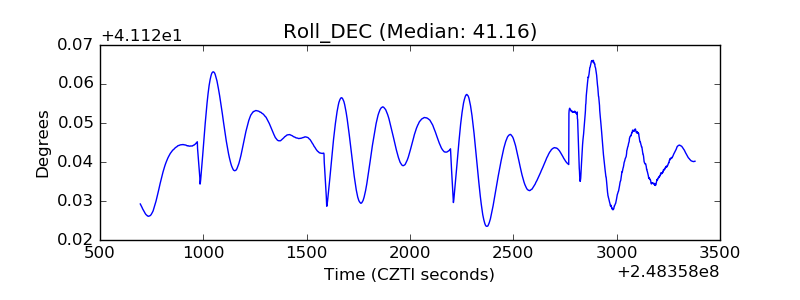 |
| _Roll_RA | 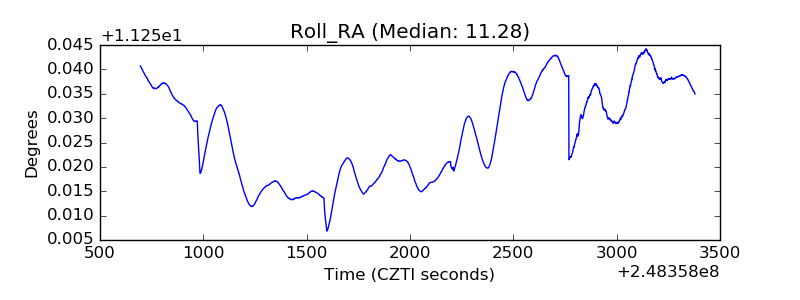 |
| Veto Counter | 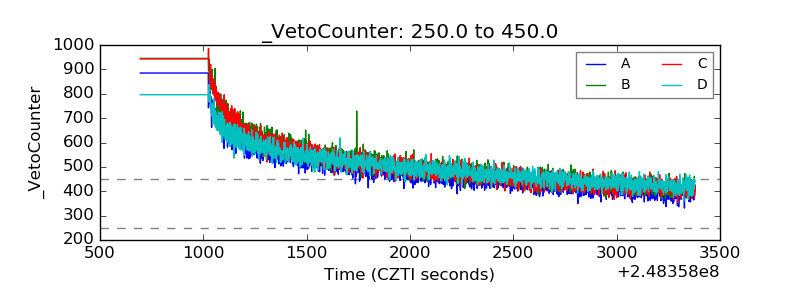 |