| Param | Original file | Final file |
|---|---|---|
| Filename | modeM0/AS1A04_022T05_9000001690cztM0_level2.fits | modeM0/AS1A04_022T05_9000001690cztM0_level2_quad_clean.evt |
| Size (bytes) | 610,251,840 | 619,813,440 |
| Size | 582.0 MB | 591.1 MB |
| Events in quadrant A | 3,543,738 | 3,503,425 |
| Events in quadrant B | 3,530,602 | 3,587,858 |
| Events in quadrant C | 3,699,982 | 3,789,986 |
| Events in quadrant D | 3,160,616 | 3,346,442 |
| Mode M9 | |||
|---|---|---|---|
| Quadrant | BADHDUFLAG | Total packets | Discarded packets |
| A | 0 | 95 | 0 |
| B | 0 | 95 | 0 |
| C | 0 | 95 | 0 |
| D | 0 | 95 | 0 |
| Mode M0 | |||
|---|---|---|---|
| Quadrant | BADHDUFLAG | Total packets | Discarded packets |
| A | 0 | 204800 | 0 |
| B | 0 | 167240 | 0 |
| C | 0 | 135415 | 0 |
| D | 0 | 173435 | 0 |
| Mode SS | |||
|---|---|---|---|
| Quadrant | BADHDUFLAG | Total packets | Discarded packets |
| A | 0 | 1348 | 0 |
| B | 0 | 1348 | 0 |
| C | 0 | 1348 | 0 |
| D | 0 | 1348 | 0 |
| Quadrant | Total seconds | Saturated seconds | Saturation percentage |
|---|---|---|---|
| A | 66241 | 6203 | 9.364291% |
| B | 66241 | 2728 | 4.118295% |
| C | 66241 | 361 | 0.544980% |
| D | 66241 | 1813 | 2.736976% |
Noise dominated data is calculated using 1-second bins in cleaned event files. If a bin has >2000 counts, and if more than 50% of those come from <1% of pixels, then it is considered to be noise-dominated and hence unusable.
| Quadrant | # 1 sec bins | Bins with >0 counts | Bins with >2000 counts | High rate bins dominated by noise | Noise dominated (total time) | Noise dominated (detector-on time) | Marked lightcurve |
|---|---|---|---|---|---|---|---|
| A | 75756 | 66046 | 0 | 0 | 0.00% | 0.00% |  |
| B | 75756 | 66240 | 0 | 0 | 0.00% | 0.00% | 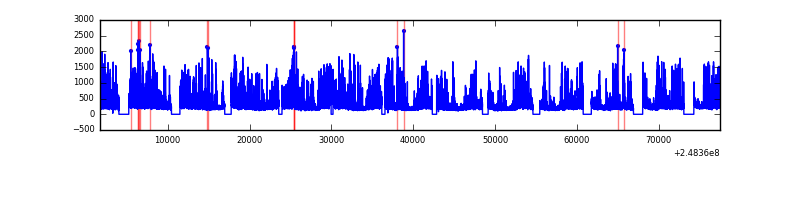 |
| C | 75756 | 66241 | 0 | 0 | 0.00% | 0.00% | 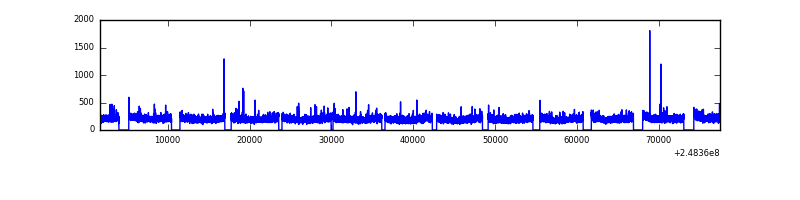 |
| D | 75756 | 66219 | 0 | 0 | 0.00% | 0.00% | 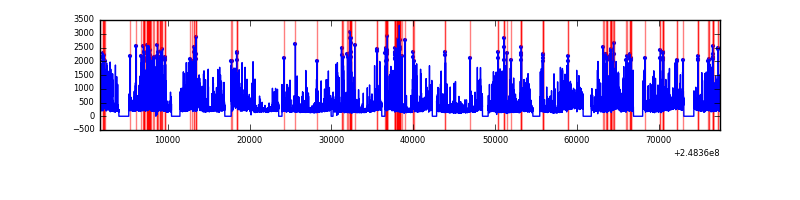 |
Top three noisy pixels from each quadrant. If the there are fewer than three noisy pixels in the level2.evt file, extra rows are filled as -1
| Pixel properties | Quadrant properties | ||||||
|---|---|---|---|---|---|---|---|
| Quadrant | DetID | PixID | Counts | Sigma | Mean | Median | Sigma |
| A | 0 | 29 | 3490 | 11.43 | 922 | 863 | 229.8 |
| A | 7 | 110 | 2867 | 8.72 | 922 | 863 | 229.8 |
| A | 9 | 19 | 2696 | 7.98 | 922 | 863 | 229.8 |
| B | 2 | 9 | 3000 | 11.48 | 931 | 887 | 184.0 |
| B | 14 | 254 | 2384 | 8.14 | 931 | 887 | 184.0 |
| B | 3 | 17 | 2377 | 8.1 | 931 | 887 | 184.0 |
| C | 1 | 80 | 2891 | 7.79 | 974 | 903 | 255.1 |
| C | 1 | 81 | 2828 | 7.55 | 974 | 903 | 255.1 |
| C | 12 | 250 | 2709 | 7.08 | 974 | 903 | 255.1 |
| D | 6 | 231 | 2350 | 6.35 | 902 | 821 | 240.7 |
| D | 3 | 14 | 2328 | 6.26 | 902 | 821 | 240.7 |
| D | 6 | 38 | 2219 | 5.81 | 902 | 821 | 240.7 |
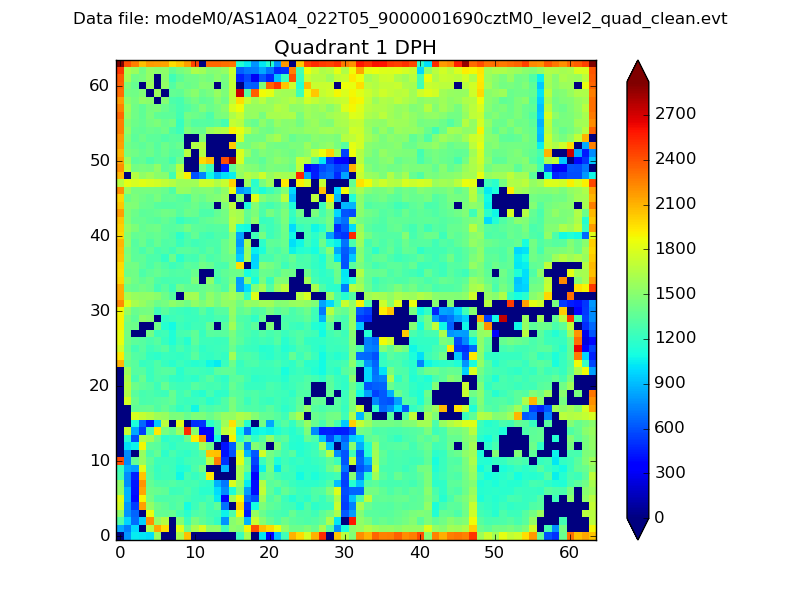
Histogram calculated using DETX and DETY for each event in the final _common_clean file
| Quadrant A | 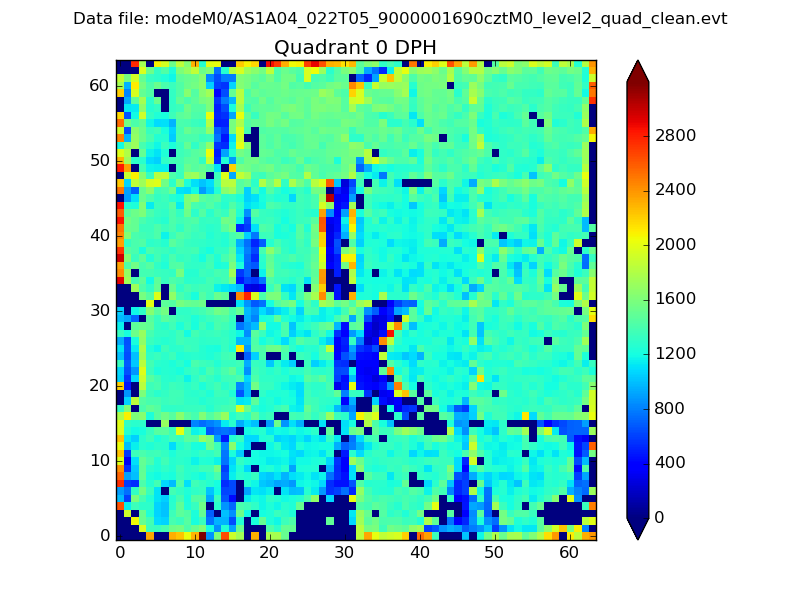 |
 |
Quadrant B |
|---|---|---|---|
| Quadrant D |  |
 |
Quadrant C |
| Plot type | Count rate plots | Images |
|---|---|---|
| Comparison with Poisson distribution Blue bars denote a histogram of data divided into 1 sec bins. Red curve is a Poisson curve with rate = median count rate of data. |
 |
 |
| Quadrant-wise count rates Data is divided into 100 sec bins |
 |
|
| Module-wise count rates for Quadrant A Data is divided into 100 sec bins |
 |
 |
| Module-wise count rates for Quadrant B Data is divided into 100 sec bins |
 |
 |
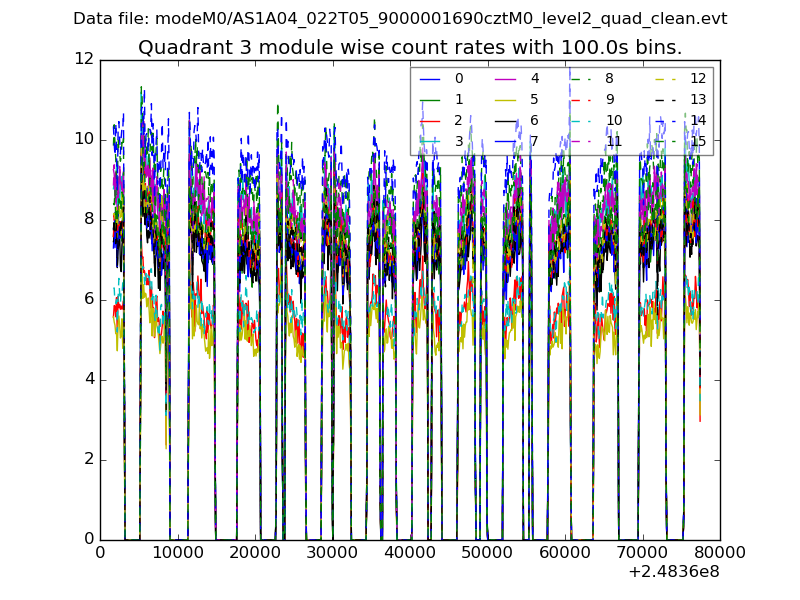
| Module-wise count rates for Quadrant C Data is divided into 100 sec bins |
 |
 |
| Module-wise count rates for Quadrant D Data is divided into 100 sec bins |
 |
 |
| Parameter | Plot |
|---|---|
| CZT HV Monitor |  |
| D_VDD |  |
| Temperature 1 |  |
| Veto HV Monitor |  |
| Veto LLD |  |
| Alpha Counter | 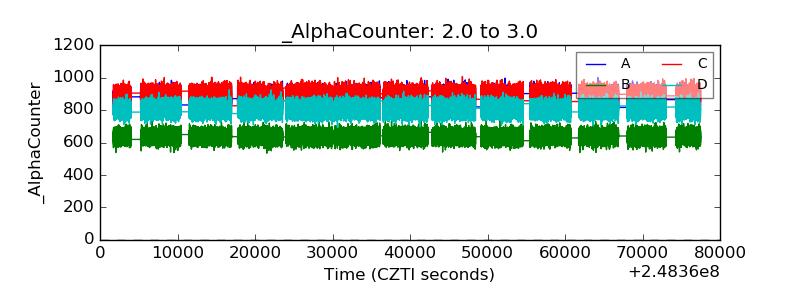 |
| _CPM_Rate |  |
| CZT Counter | 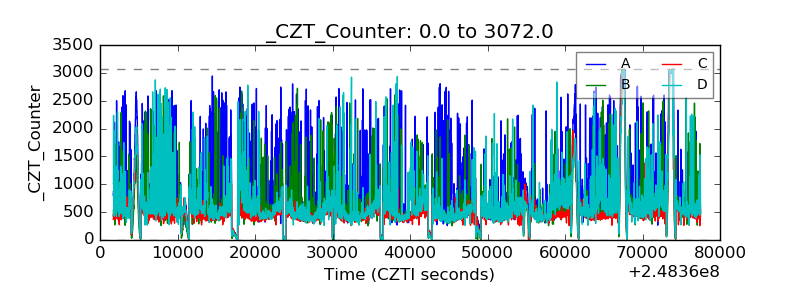 |
| +2.5 Volts monitor |  |
| +5 Volts monitor | 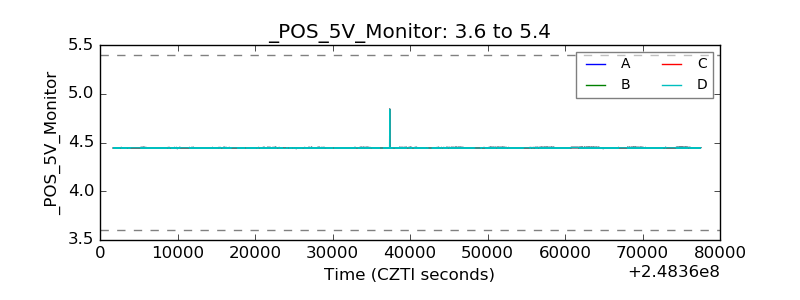 |
| _ROLL_ROT |  |
| _Roll_DEC |  |
| _Roll_RA | 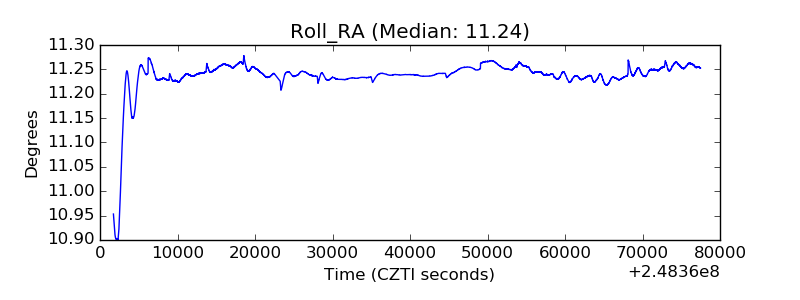 |
| Veto Counter | 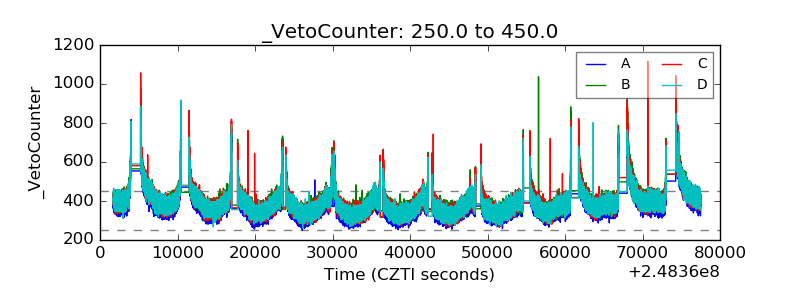 |