| Param | Original file | Final file |
|---|---|---|
| Filename | modeM0/AS1A04_022T05_9000001690_11522cztM0_level2.evt | modeM0/AS1A04_022T05_9000001690_11522cztM0_level2_quad_clean.evt |
| Size (bytes) | 392,296,320 | 62,395,200 |
| Size | 374.1 MB | 59.5 MB |
| Events in quadrant A | 3,985,895 | 385,286 |
| Events in quadrant B | 2,900,978 | 402,129 |
| Events in quadrant C | 1,927,499 | 426,046 |
| Events in quadrant D | 2,799,029 | 398,285 |
| Mode M9 | |||
|---|---|---|---|
| Quadrant | BADHDUFLAG | Total packets | Discarded packets |
| A | 0 | 12 | 0 |
| B | 0 | 12 | 0 |
| C | 0 | 12 | 0 |
| D | 0 | 12 | 0 |
| Mode M0 | |||
|---|---|---|---|
| Quadrant | BADHDUFLAG | Total packets | Discarded packets |
| A | 0 | 14620 | 2 |
| B | 0 | 11231 | 1 |
| C | 0 | 8248 | 1 |
| D | 0 | 10958 | 1 |
| Mode SS | |||
|---|---|---|---|
| Quadrant | BADHDUFLAG | Total packets | Discarded packets |
| A | 0 | 80 | 0 |
| B | 0 | 80 | 0 |
| C | 0 | 80 | 0 |
| D | 0 | 80 | 0 |
| Quadrant | Total seconds | Saturated seconds | Saturation percentage |
|---|---|---|---|
| A | 3932 | 625 | 15.895219% |
| B | 3932 | 340 | 8.646999% |
| C | 3932 | 83 | 2.110885% |
| D | 3932 | 168 | 4.272635% |
Noise dominated data is calculated using 1-second bins in cleaned event files. If a bin has >2000 counts, and if more than 50% of those come from <1% of pixels, then it is considered to be noise-dominated and hence unusable.
| Quadrant | # 1 sec bins | Bins with >0 counts | Bins with >2000 counts | High rate bins dominated by noise | Noise dominated (total time) | Noise dominated (detector-on time) | Marked lightcurve |
|---|---|---|---|---|---|---|---|
| A | 5148 | 3933 | 344 | 344 | 6.68% | 8.75% | 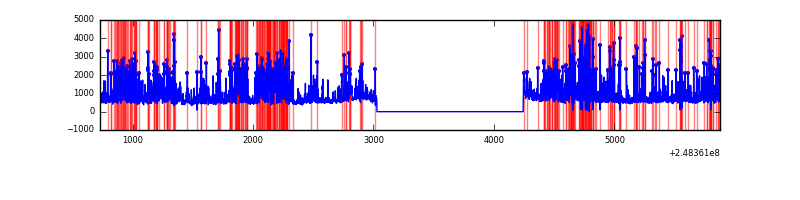 |
| B | 5148 | 3934 | 128 | 128 | 2.49% | 3.25% | 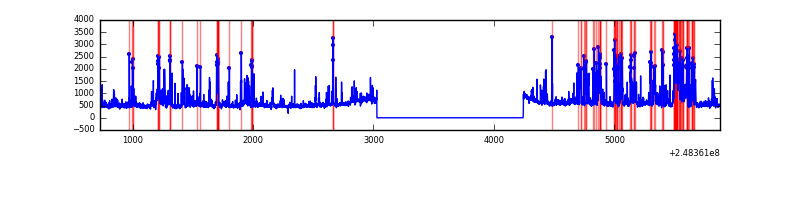 |
| C | 5148 | 3934 | 0 | 0 | 0.00% | 0.00% | 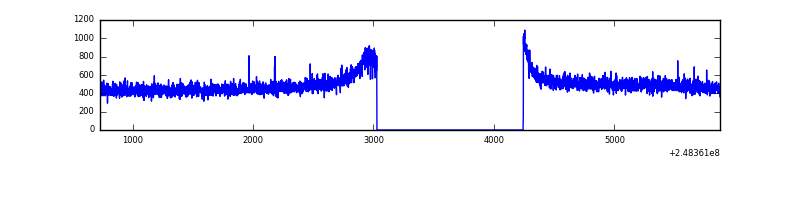 |
| D | 5148 | 3934 | 82 | 82 | 1.59% | 2.08% | 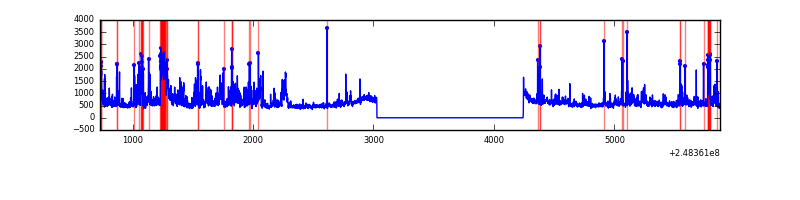 |
Top three noisy pixels from each quadrant. If the there are fewer than three noisy pixels in the level2.evt file, extra rows are filled as -1
| Pixel properties | Quadrant properties | ||||||
|---|---|---|---|---|---|---|---|
| Quadrant | DetID | PixID | Counts | Sigma | Mean | Median | Sigma |
| A | 8 | 5 | 2045555 | 21118.23 | 475 | 465 | 96.8 |
| A | 1 | 162 | 31474 | 320.21 | 475 | 465 | 96.8 |
| A | 9 | 143 | 19761 | 199.26 | 475 | 465 | 96.8 |
| B | 4 | 239 | 695031 | 7448.07 | 488 | 476 | 93.3 |
| B | 3 | 64 | 129579 | 1384.44 | 488 | 476 | 93.3 |
| B | 11 | 51 | 66414 | 707.09 | 488 | 476 | 93.3 |
| C | 7 | 87 | 6777 | 54.57 | 492 | 494 | 115.1 |
| C | 13 | 61 | 3646 | 27.38 | 492 | 494 | 115.1 |
| C | 3 | 202 | 1254 | 6.6 | 492 | 494 | 115.1 |
| D | 6 | 219 | 429197 | 3655.47 | 490 | 476 | 117.3 |
| D | 5 | 222 | 147271 | 1251.64 | 490 | 476 | 117.3 |
| D | 13 | 152 | 103426 | 877.8 | 490 | 476 | 117.3 |
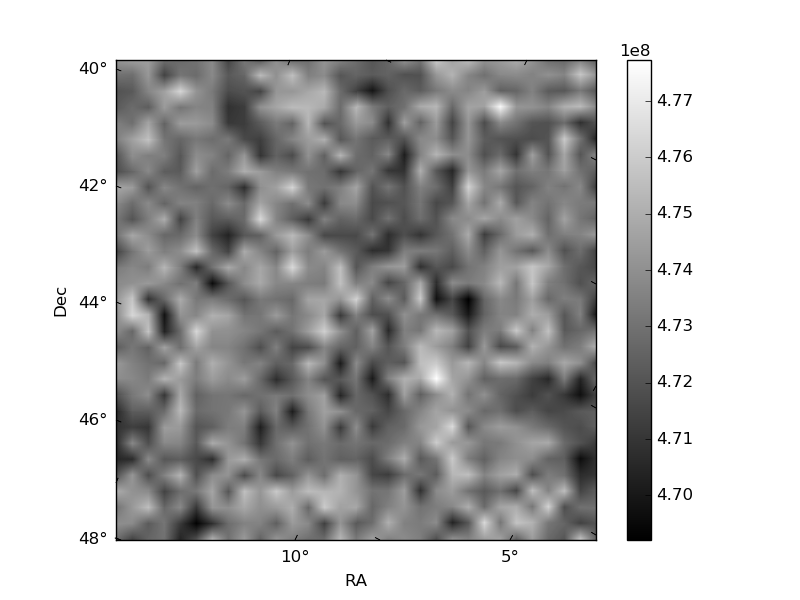
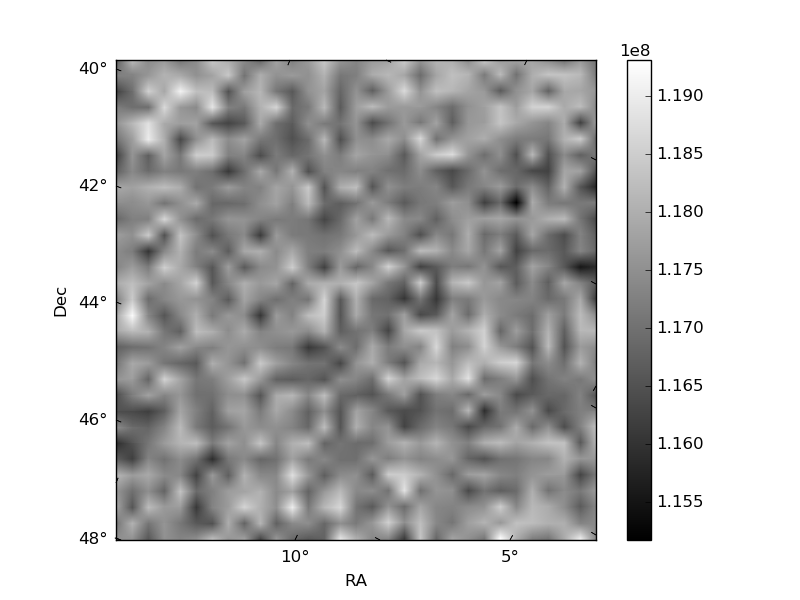
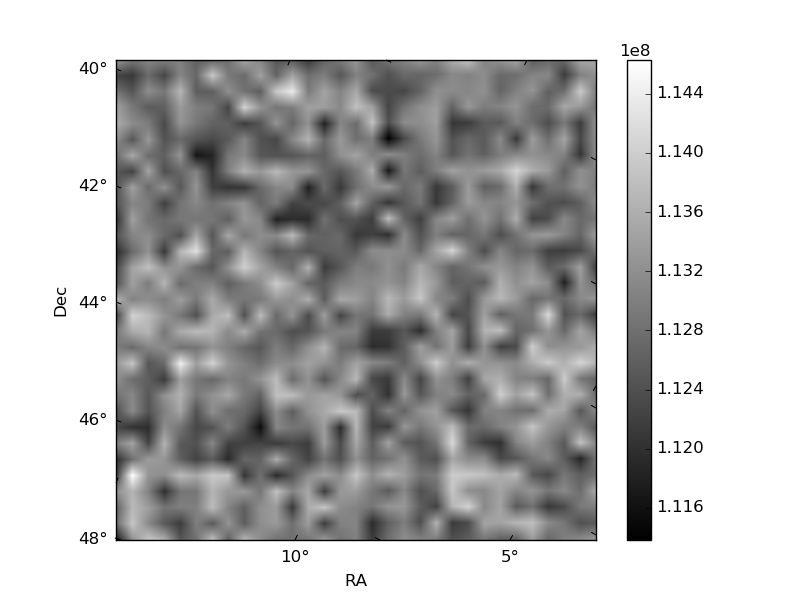
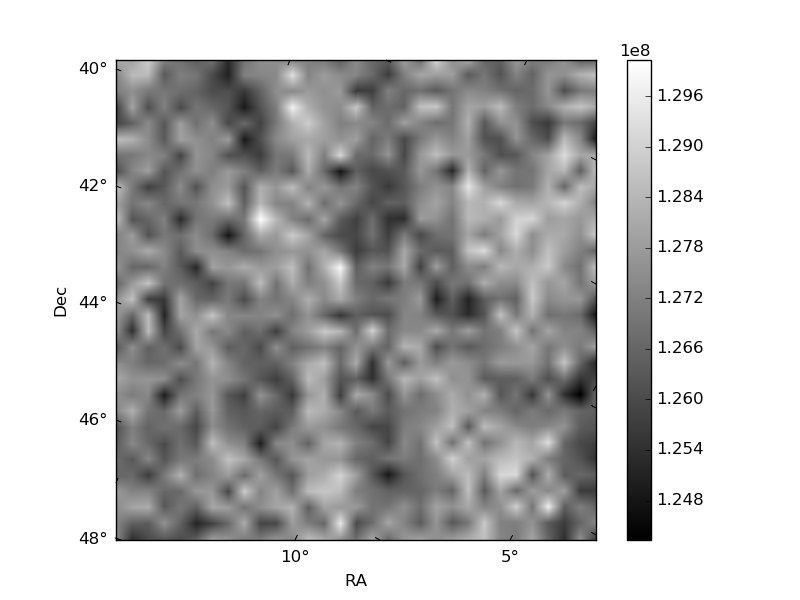
Histogram calculated using DETX and DETY for each event in the final _common_clean file
| Quadrant A | 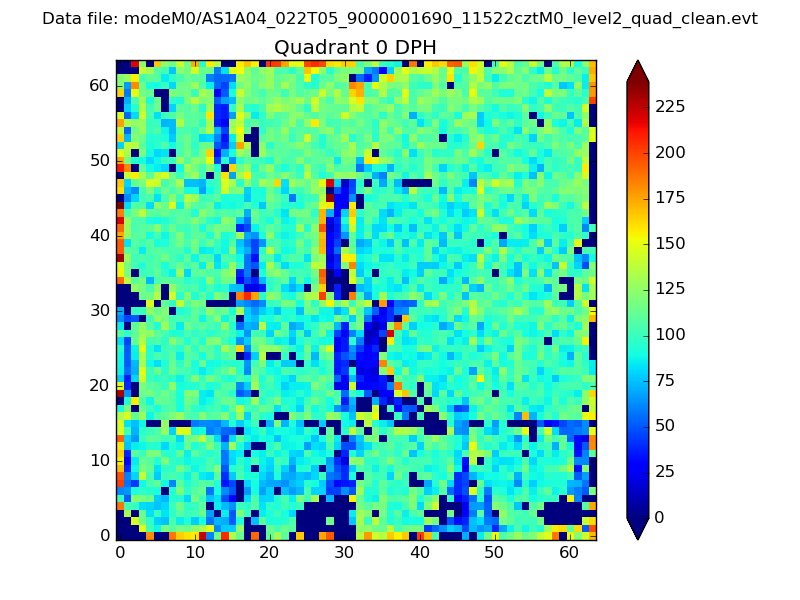 |
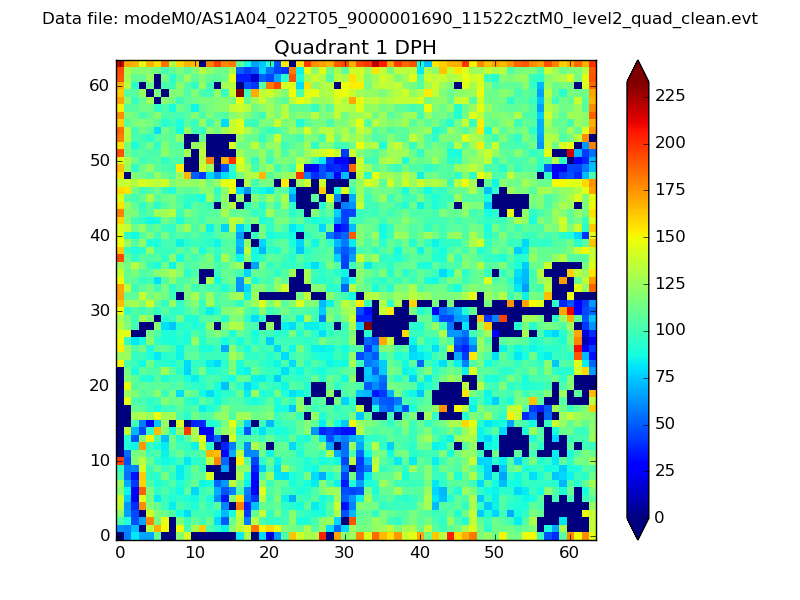 |
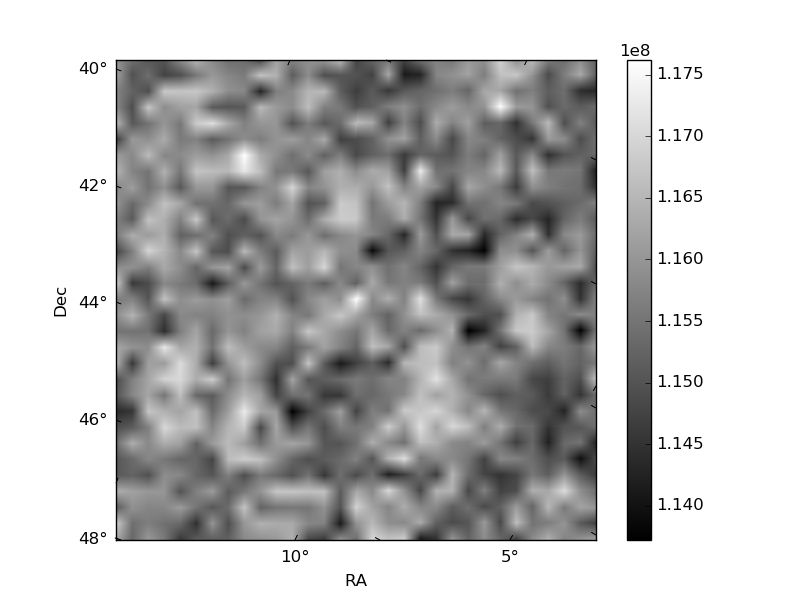
Quadrant B |
|---|---|---|---|
| Quadrant D | 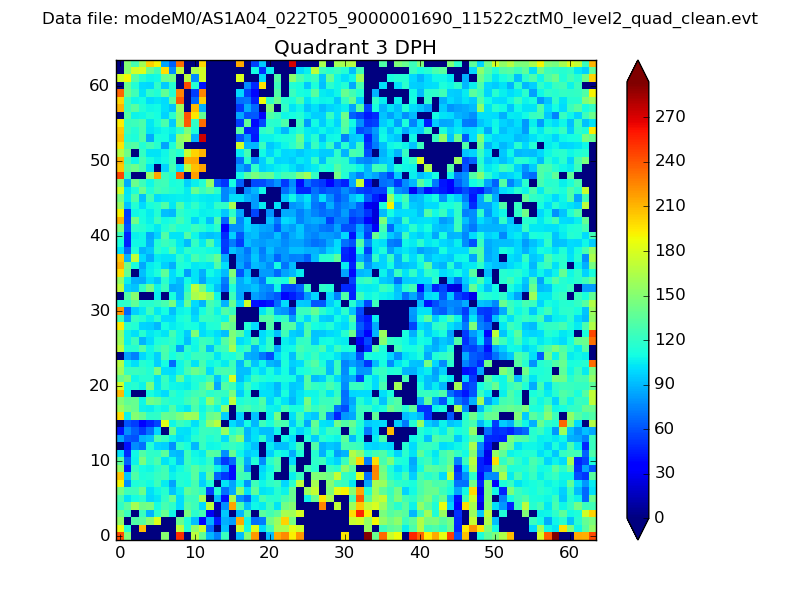 |
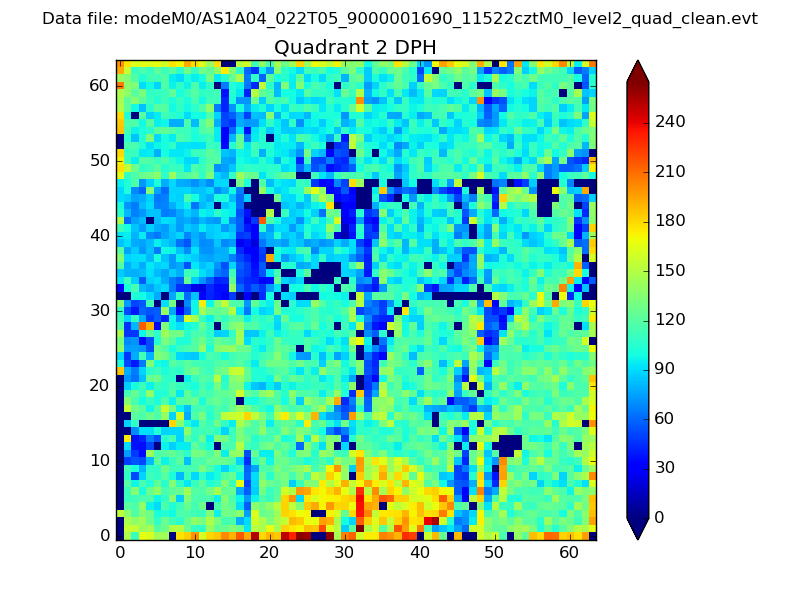 |
Quadrant C |
| Plot type | Count rate plots | Images |
|---|---|---|
| Comparison with Poisson distribution Blue bars denote a histogram of data divided into 1 sec bins. Red curve is a Poisson curve with rate = median count rate of data. |
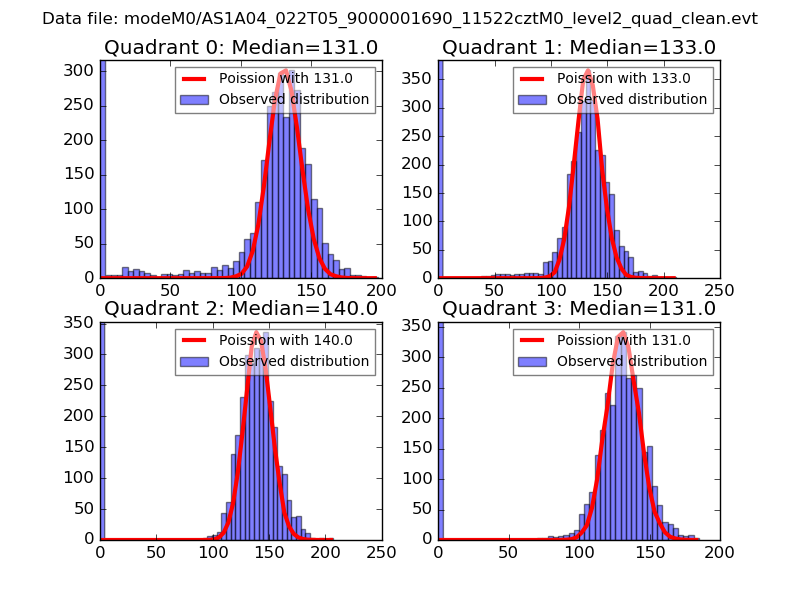 |
 |
| Quadrant-wise count rates Data is divided into 100 sec bins |
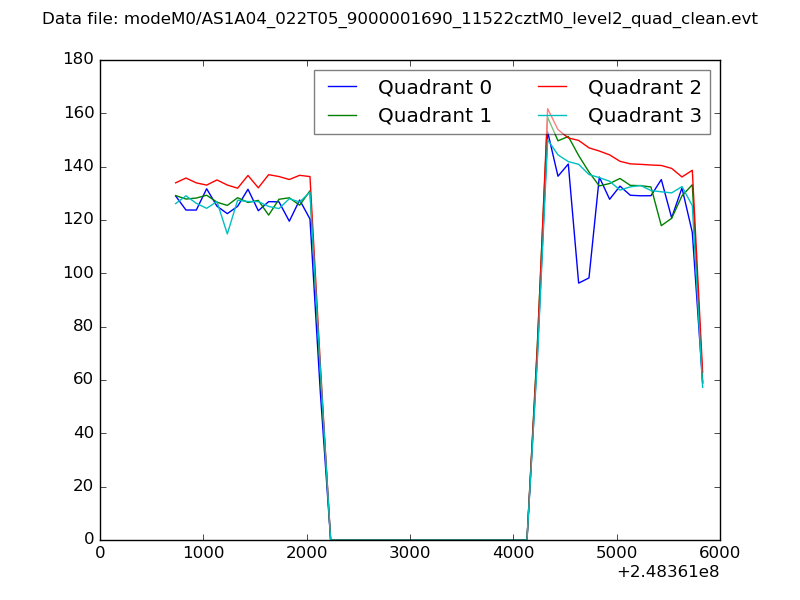 |
|
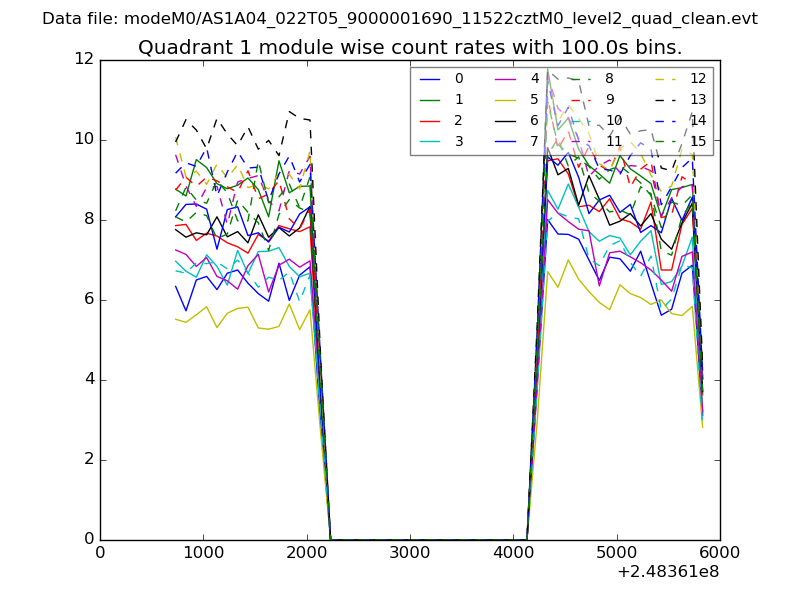
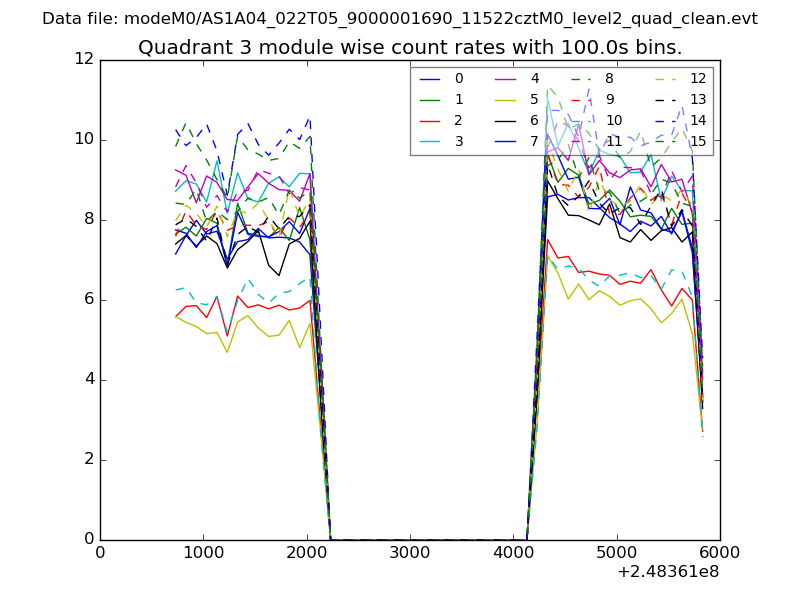
| Module-wise count rates for Quadrant A Data is divided into 100 sec bins |
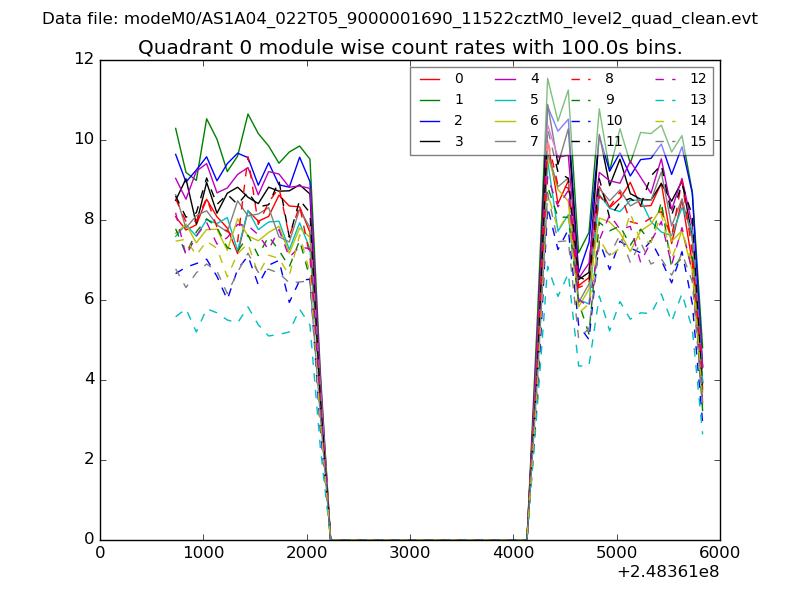 |
 |
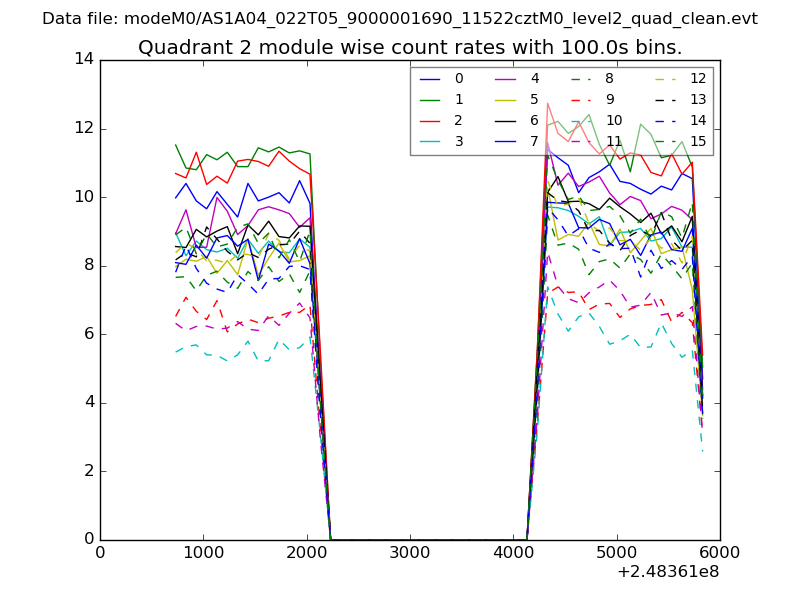
| Module-wise count rates for Quadrant B Data is divided into 100 sec bins |
 |
 |
| Module-wise count rates for Quadrant C Data is divided into 100 sec bins |
 |
 |
| Module-wise count rates for Quadrant D Data is divided into 100 sec bins |
 |
 |
| Parameter | Plot |
|---|---|
| CZT HV Monitor | 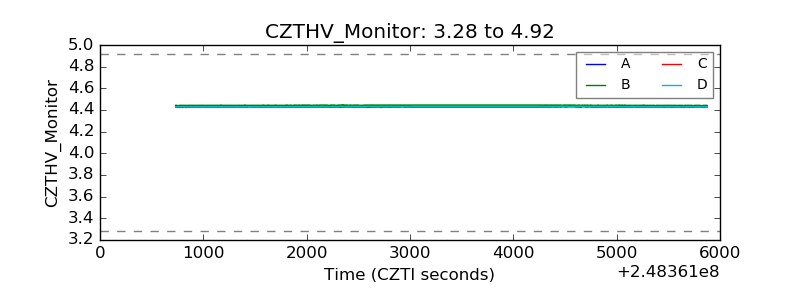 |
| D_VDD | 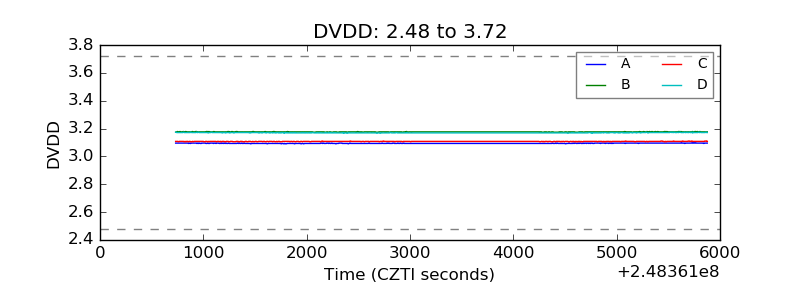 |
| Temperature 1 | 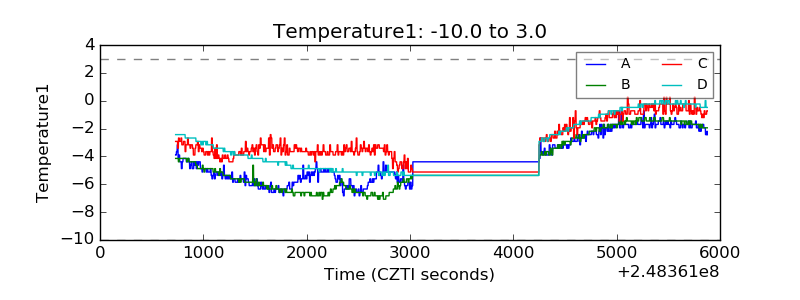 |
| Veto HV Monitor | 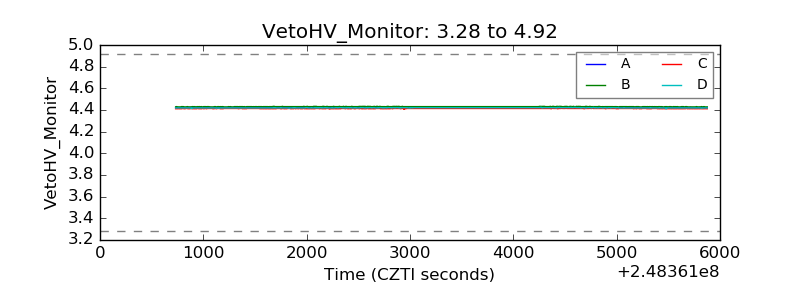 |
| Veto LLD | 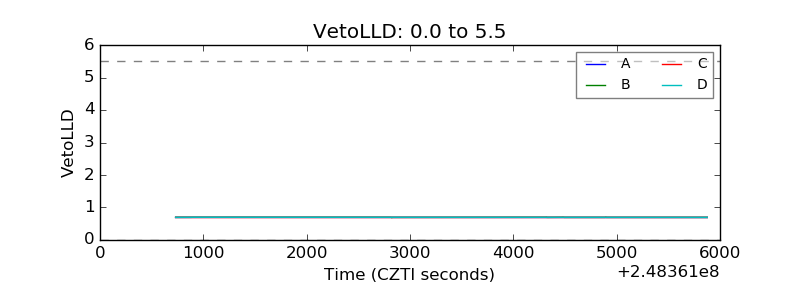 |
| Alpha Counter | 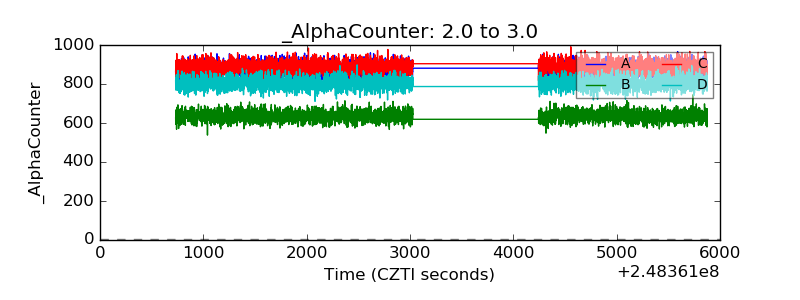 |
| _CPM_Rate | 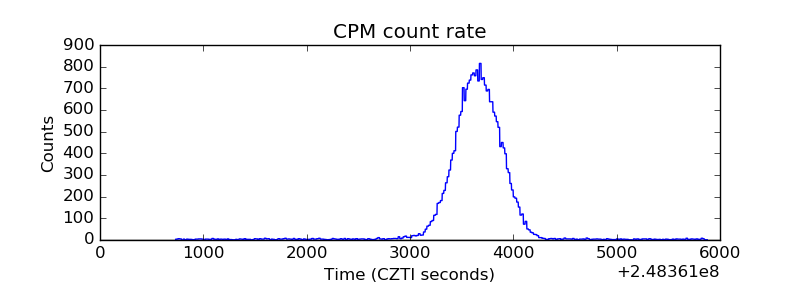 |
| CZT Counter | 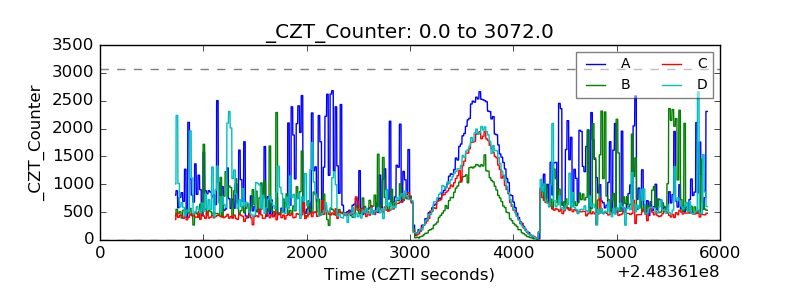 |
| +2.5 Volts monitor | 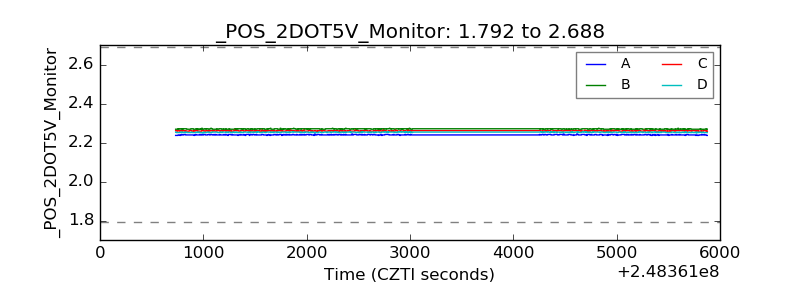 |
| +5 Volts monitor | 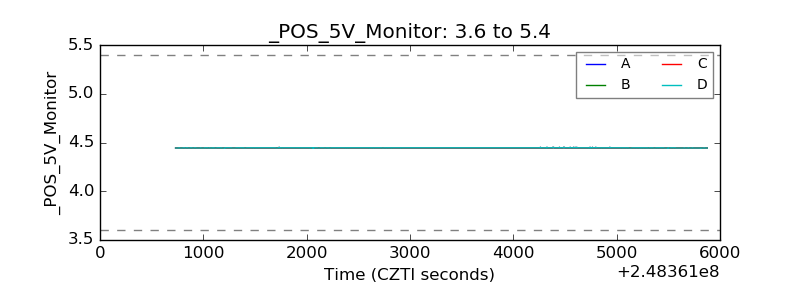 |
| _ROLL_ROT | 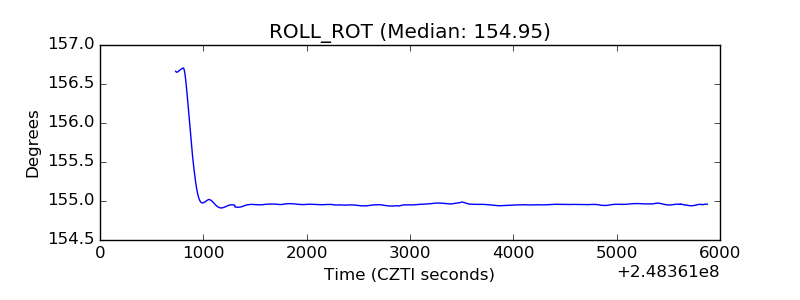 |
| _Roll_DEC | 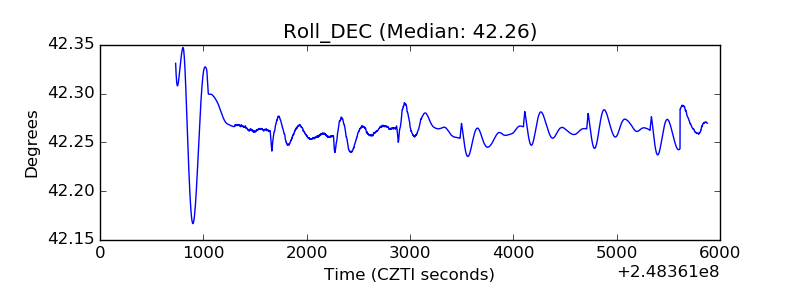 |
| _Roll_RA | 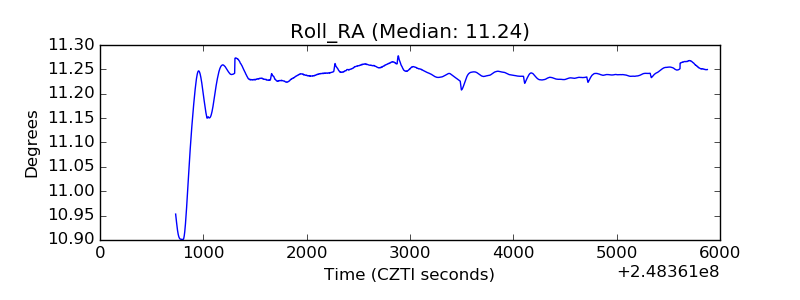 |
| Veto Counter | 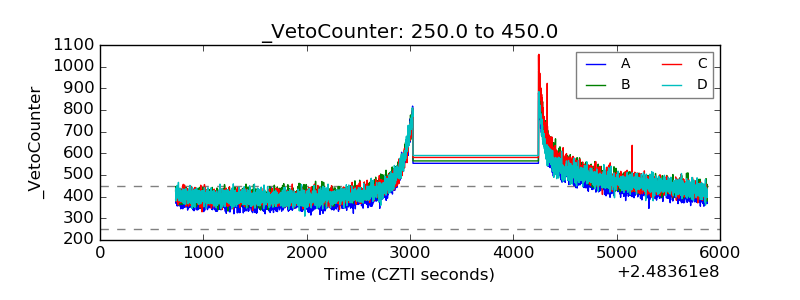 |