| Param | Original file | Final file |
|---|---|---|
| Filename | modeM0/AS1A04_022T05_9000001690_11523cztM0_level2.evt | modeM0/AS1A04_022T05_9000001690_11523cztM0_level2_quad_clean.evt |
| Size (bytes) | 637,614,720 | 101,278,080 |
| Size | 608.1 MB | 96.6 MB |
| Events in quadrant A | 5,759,099 | 635,346 |
| Events in quadrant B | 4,712,214 | 650,492 |
| Events in quadrant C | 3,069,755 | 693,486 |
| Events in quadrant D | 5,328,904 | 633,500 |
| Mode M9 | |||
|---|---|---|---|
| Quadrant | BADHDUFLAG | Total packets | Discarded packets |
| A | 0 | 11 | 0 |
| B | 0 | 11 | 0 |
| C | 0 | 11 | 0 |
| D | 0 | 11 | 0 |
| Mode M0 | |||
|---|---|---|---|
| Quadrant | BADHDUFLAG | Total packets | Discarded packets |
| A | 0 | 21656 | 1 |
| B | 0 | 18302 | 0 |
| C | 0 | 13367 | 0 |
| D | 0 | 20179 | 0 |
| Mode SS | |||
|---|---|---|---|
| Quadrant | BADHDUFLAG | Total packets | Discarded packets |
| A | 0 | 130 | 0 |
| B | 0 | 130 | 0 |
| C | 0 | 130 | 0 |
| D | 0 | 130 | 0 |
| Quadrant | Total seconds | Saturated seconds | Saturation percentage |
|---|---|---|---|
| A | 6516 | 723 | 11.095764% |
| B | 6516 | 417 | 6.399632% |
| C | 6516 | 83 | 1.273788% |
| D | 6516 | 414 | 6.353591% |
Noise dominated data is calculated using 1-second bins in cleaned event files. If a bin has >2000 counts, and if more than 50% of those come from <1% of pixels, then it is considered to be noise-dominated and hence unusable.
| Quadrant | # 1 sec bins | Bins with >0 counts | Bins with >2000 counts | High rate bins dominated by noise | Noise dominated (total time) | Noise dominated (detector-on time) | Marked lightcurve |
|---|---|---|---|---|---|---|---|
| A | 7552 | 6517 | 396 | 396 | 5.24% | 6.08% | 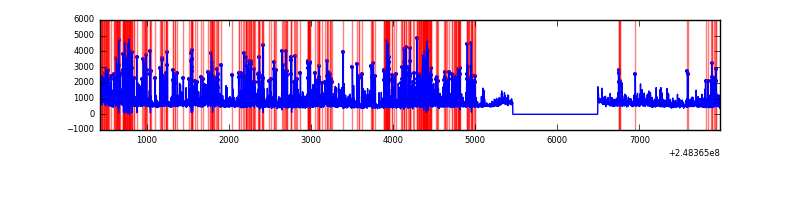 |
| B | 7552 | 6518 | 190 | 190 | 2.52% | 2.92% |  |
| C | 7552 | 6518 | 0 | 0 | 0.00% | 0.00% | 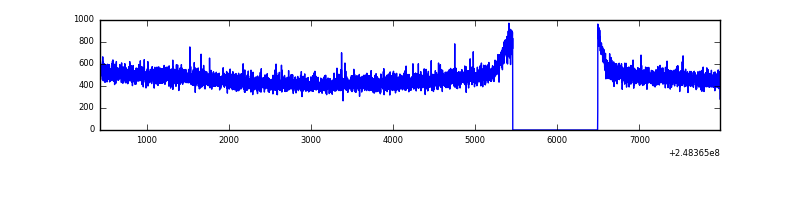 |
| D | 7552 | 6518 | 320 | 320 | 4.24% | 4.91% | 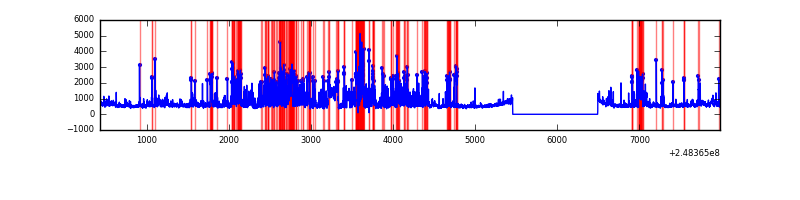 |
Top three noisy pixels from each quadrant. If the there are fewer than three noisy pixels in the level2.evt file, extra rows are filled as -1
| Pixel properties | Quadrant properties | ||||||
|---|---|---|---|---|---|---|---|
| Quadrant | DetID | PixID | Counts | Sigma | Mean | Median | Sigma |
| A | 8 | 5 | 2616042 | 16994.74 | 766 | 750 | 153.9 |
| A | 9 | 143 | 68383 | 439.49 | 766 | 750 | 153.9 |
| A | 1 | 162 | 46979 | 300.41 | 766 | 750 | 153.9 |
| B | 4 | 239 | 1179749 | 8003.18 | 779 | 760 | 147.3 |
| B | 11 | 51 | 132396 | 893.57 | 779 | 760 | 147.3 |
| B | 3 | 64 | 115370 | 777.99 | 779 | 760 | 147.3 |
| C | 13 | 61 | 5538 | 26.02 | 786 | 790 | 182.5 |
| C | 7 | 87 | 3000 | 12.11 | 786 | 790 | 182.5 |
| C | 14 | 67 | 2983 | 12.02 | 786 | 790 | 182.5 |
| D | 6 | 219 | 926933 | 4978.43 | 774 | 753 | 186.0 |
| D | 13 | 152 | 670433 | 3599.69 | 774 | 753 | 186.0 |
| D | 1 | 52 | 240086 | 1286.47 | 774 | 753 | 186.0 |
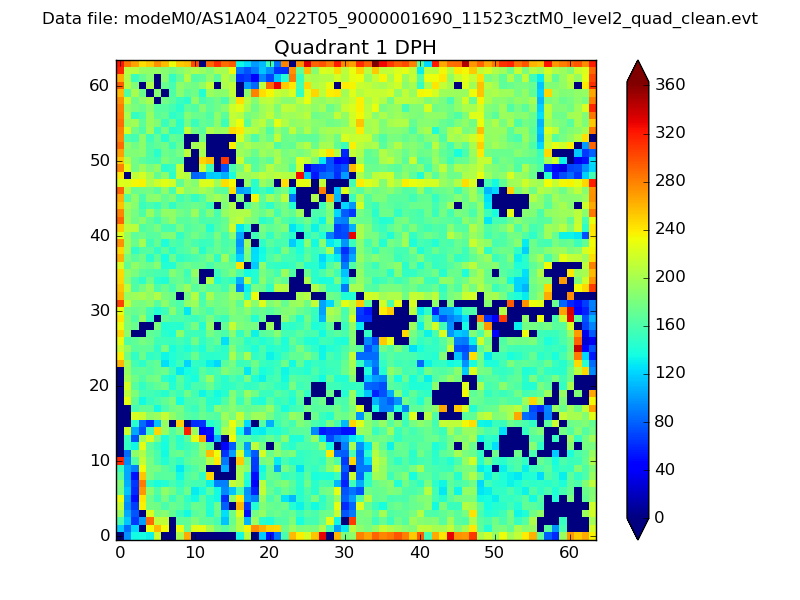
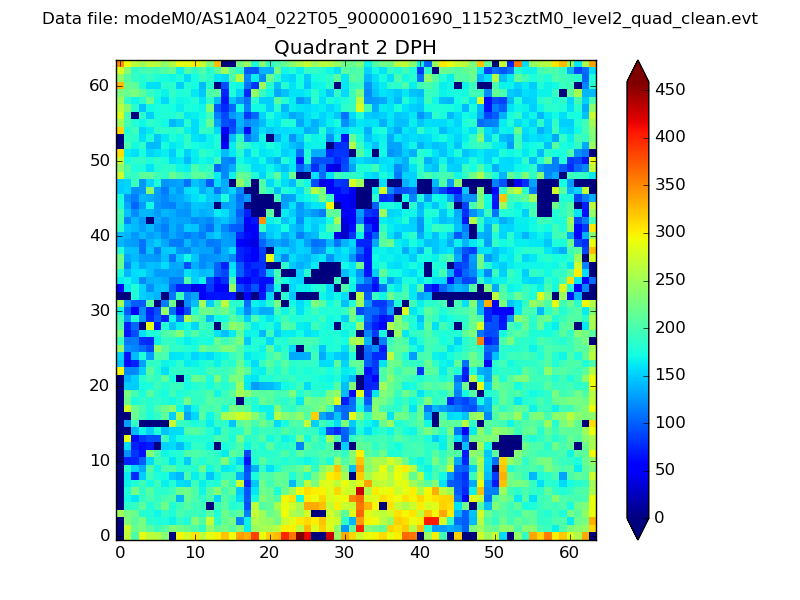
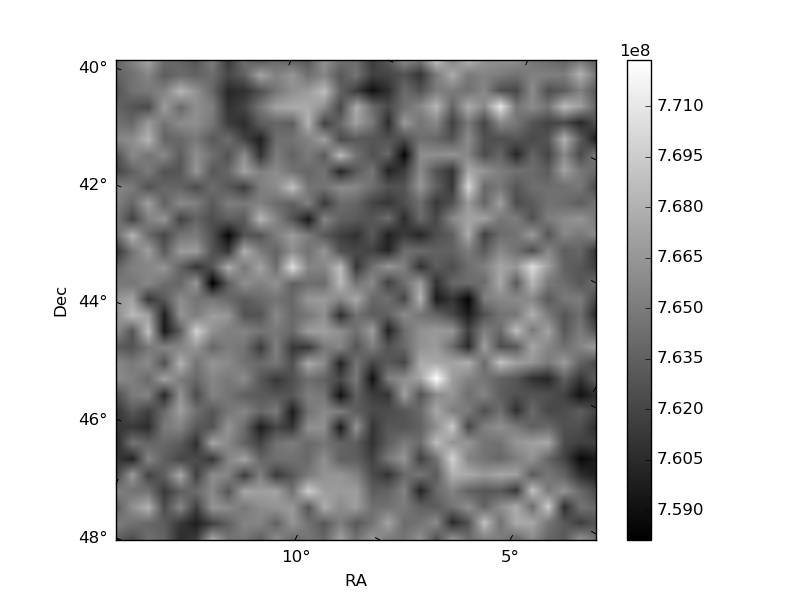
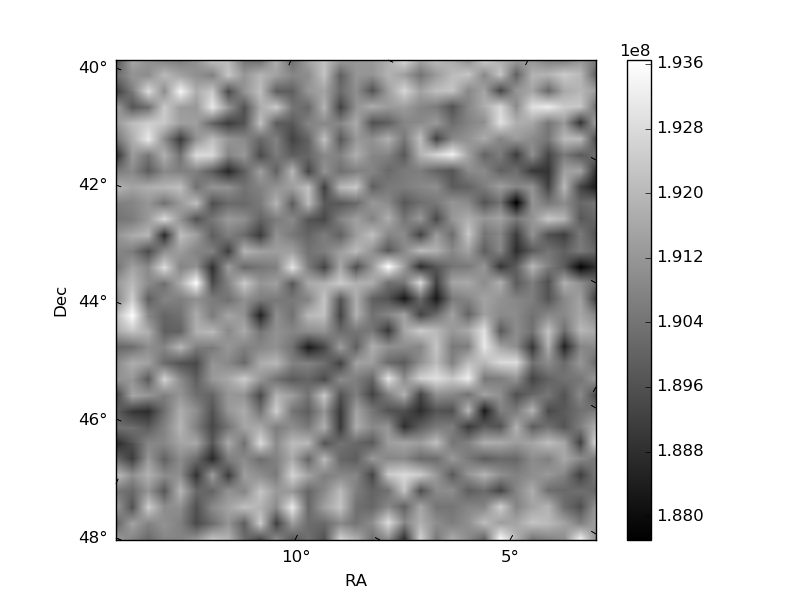
Histogram calculated using DETX and DETY for each event in the final _common_clean file
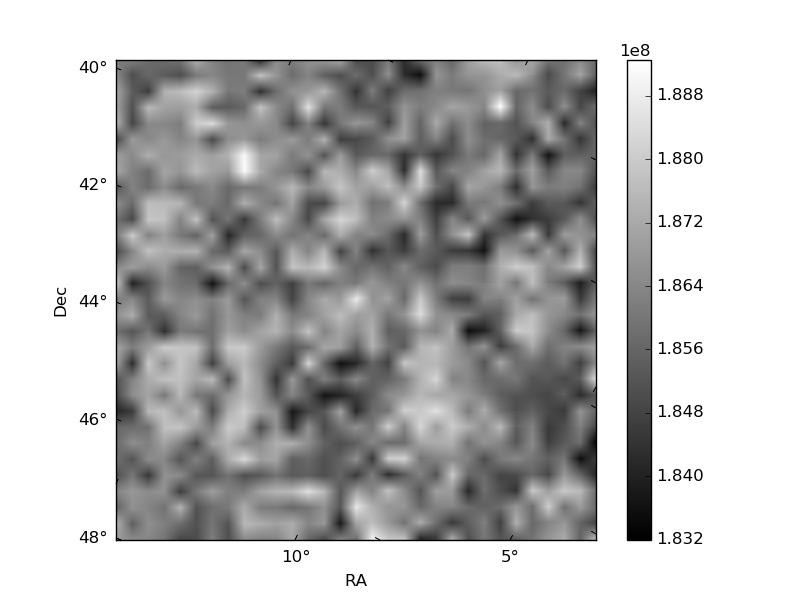
| Quadrant A | 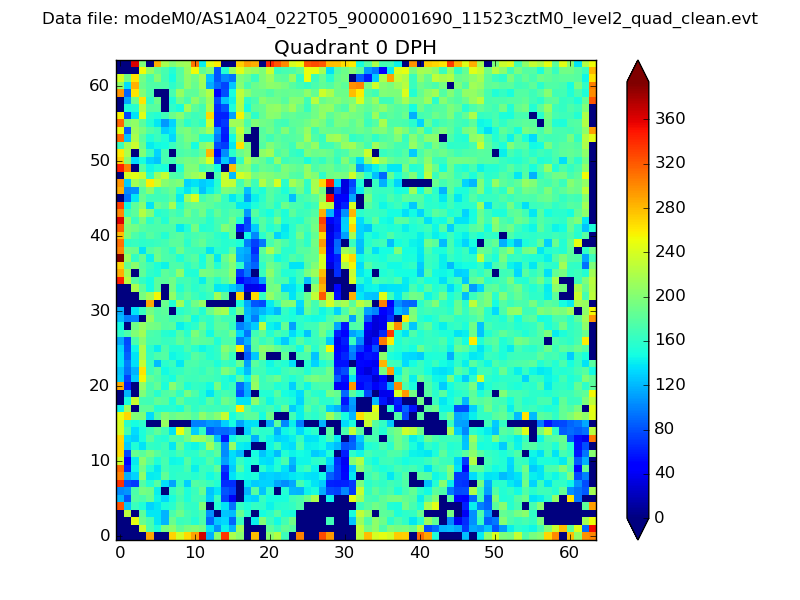 |
 |
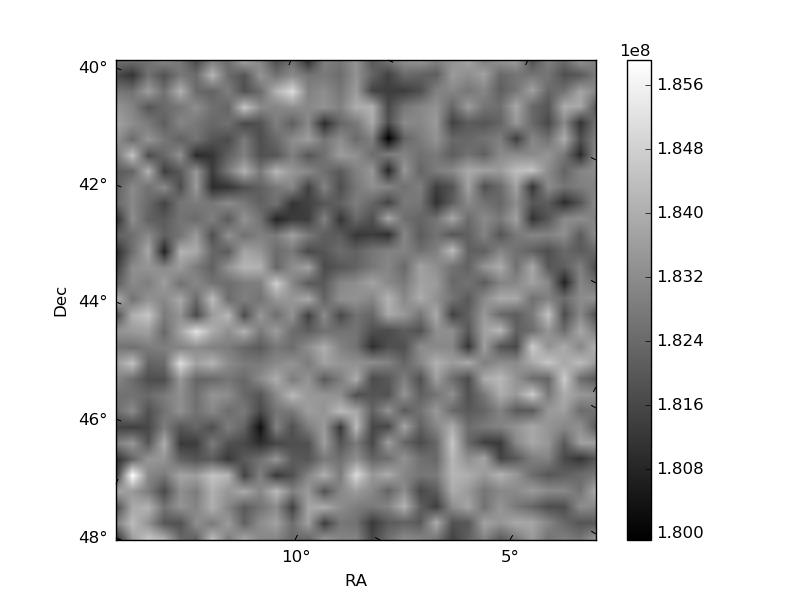
Quadrant B |
|---|---|---|---|
| Quadrant D | 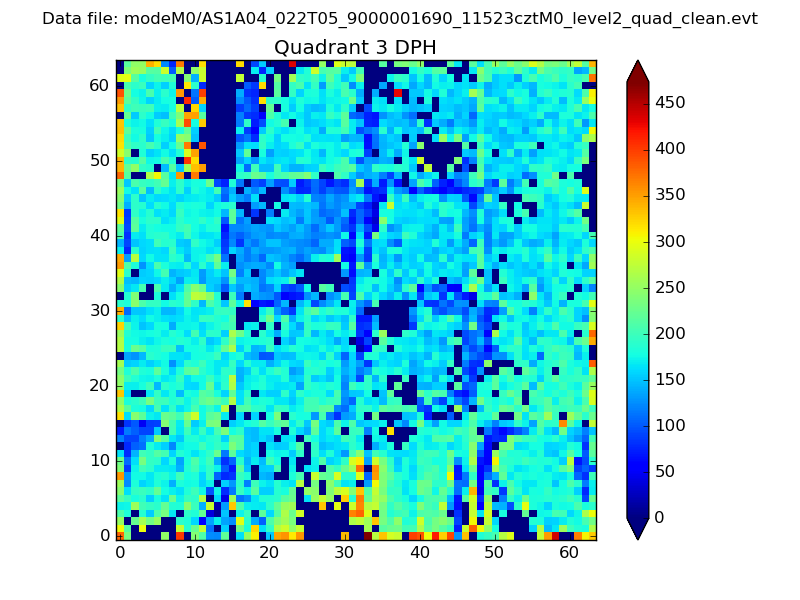 |
 |
Quadrant C |
| Plot type | Count rate plots | Images |
|---|---|---|
| Comparison with Poisson distribution Blue bars denote a histogram of data divided into 1 sec bins. Red curve is a Poisson curve with rate = median count rate of data. |
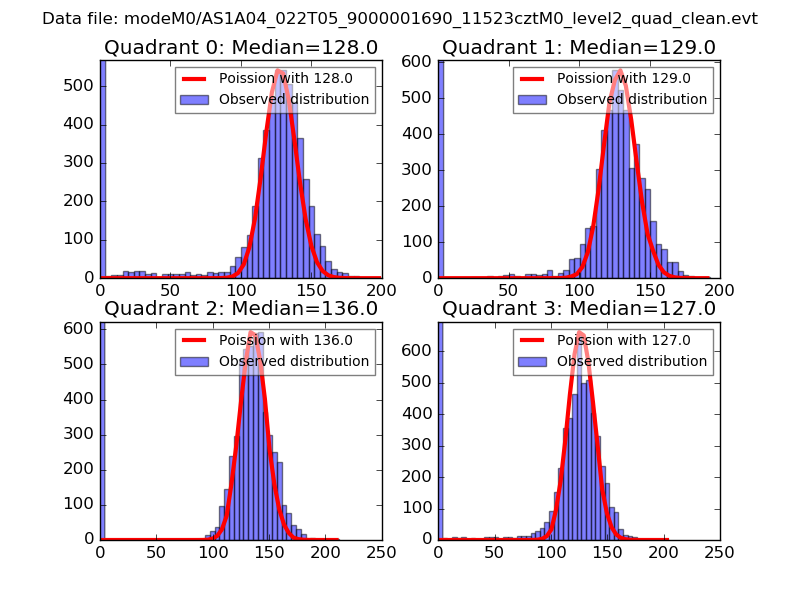 |
 |
| Quadrant-wise count rates Data is divided into 100 sec bins |
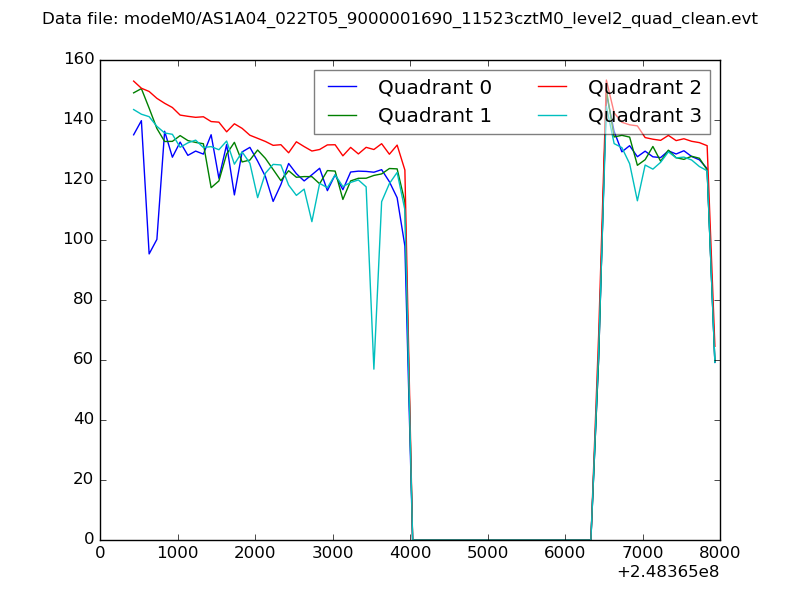 |
|
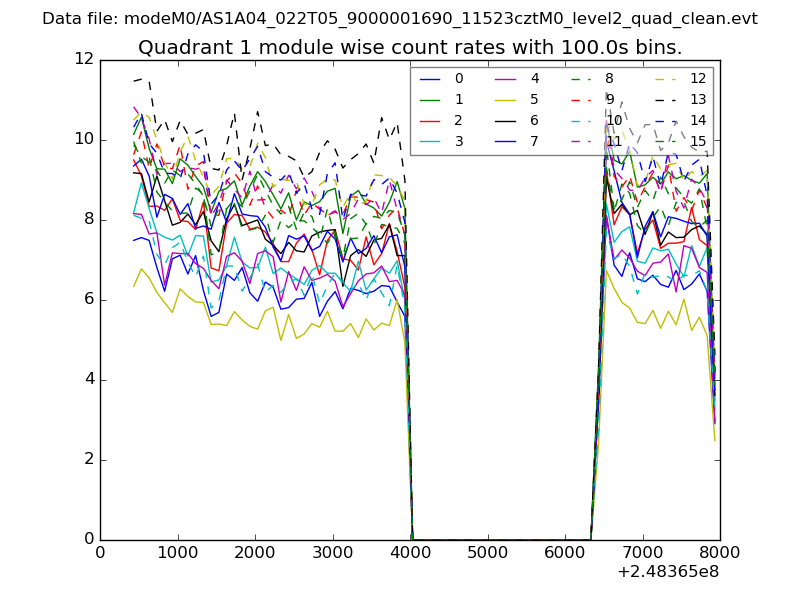
| Module-wise count rates for Quadrant A Data is divided into 100 sec bins |
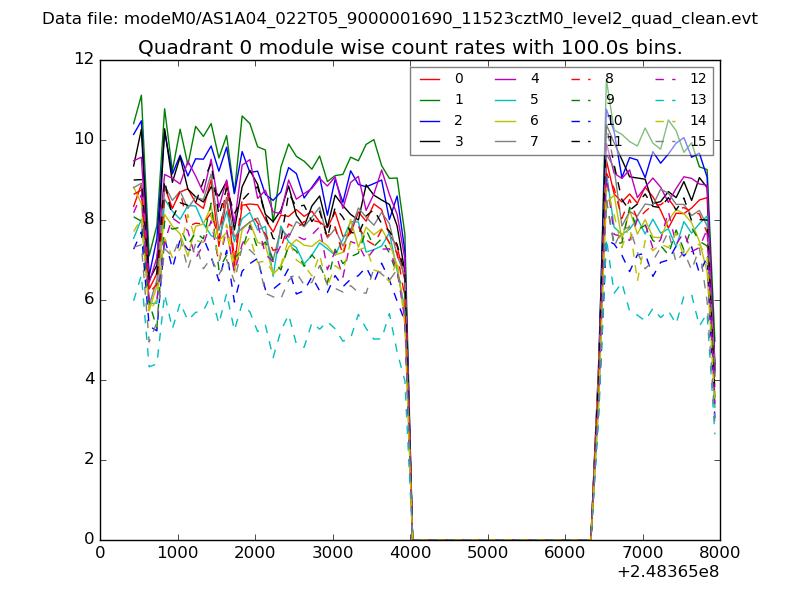 |
 |
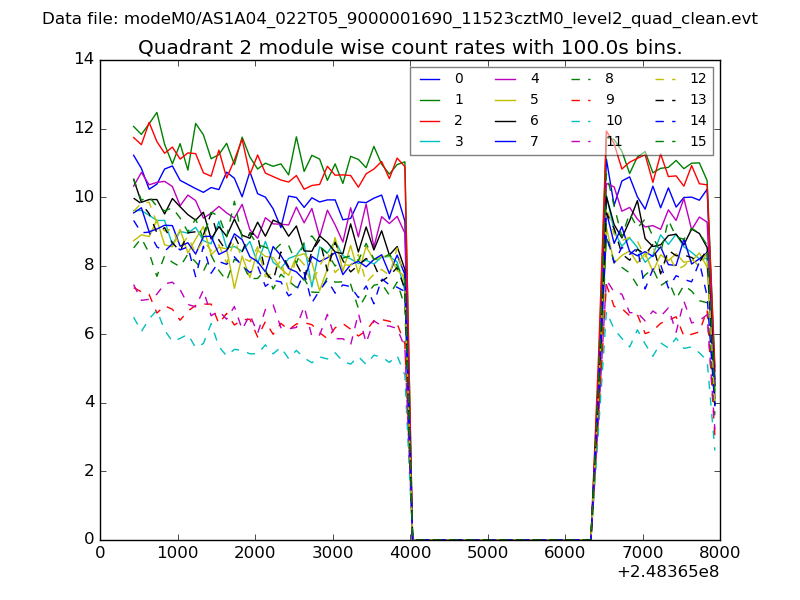
| Module-wise count rates for Quadrant B Data is divided into 100 sec bins |
 |
 |
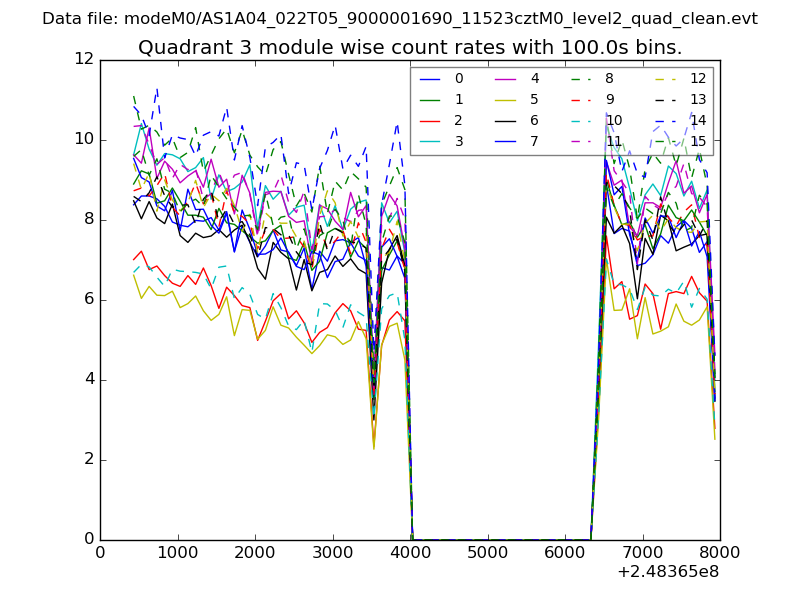
| Module-wise count rates for Quadrant C Data is divided into 100 sec bins |
 |
 |
| Module-wise count rates for Quadrant D Data is divided into 100 sec bins |
 |
 |
| Parameter | Plot |
|---|---|
| CZT HV Monitor | 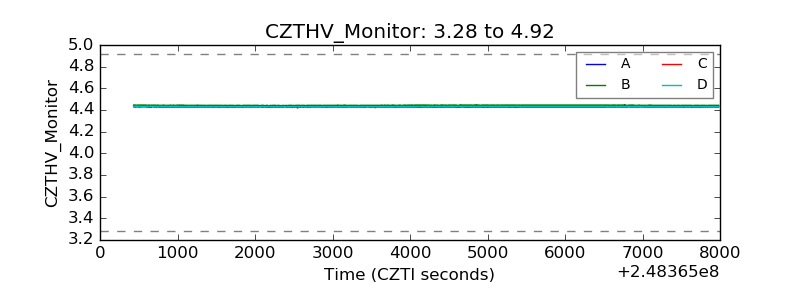 |
| D_VDD | 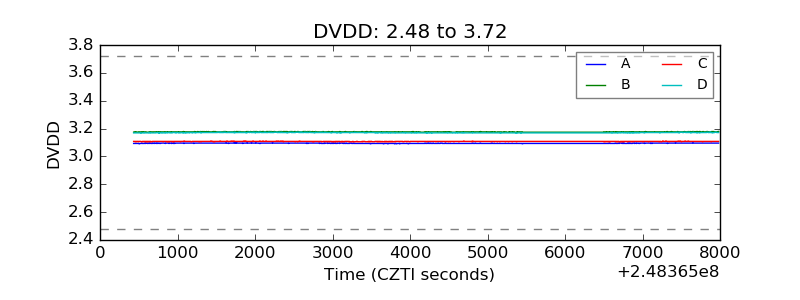 |
| Temperature 1 | 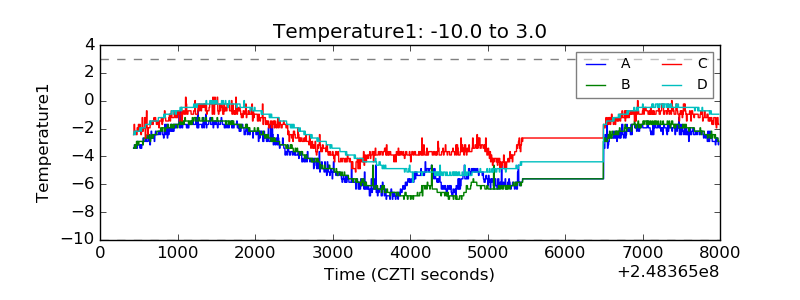 |
| Veto HV Monitor | 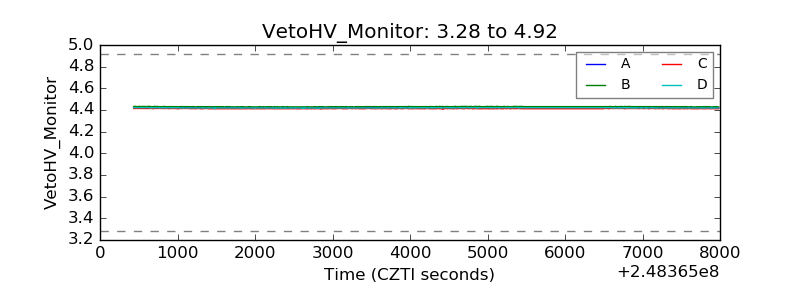 |
| Veto LLD | 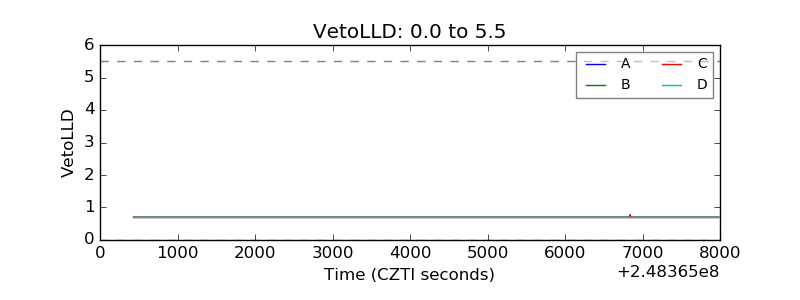 |
| Alpha Counter | 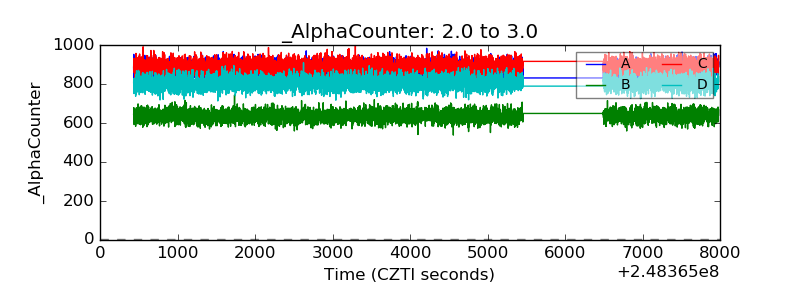 |
| _CPM_Rate | 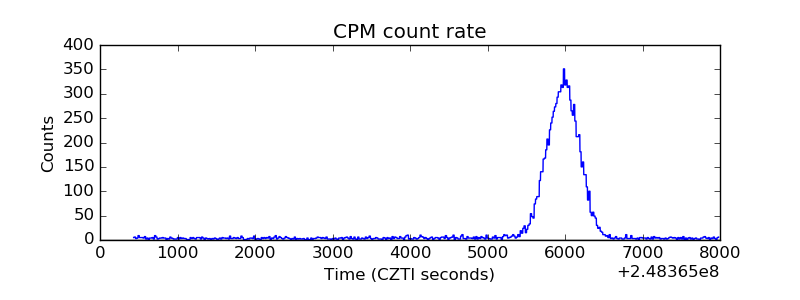 |
| CZT Counter | 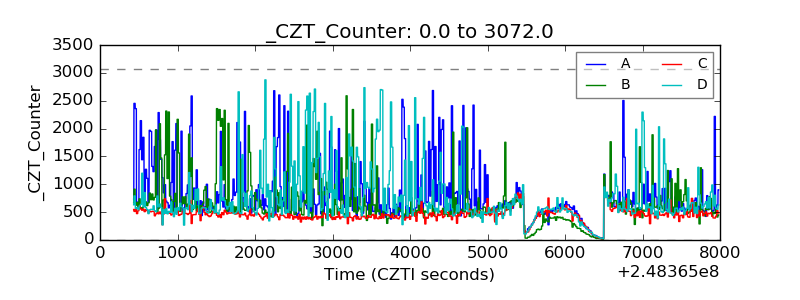 |
| +2.5 Volts monitor |  |
| +5 Volts monitor |  |
| _ROLL_ROT | 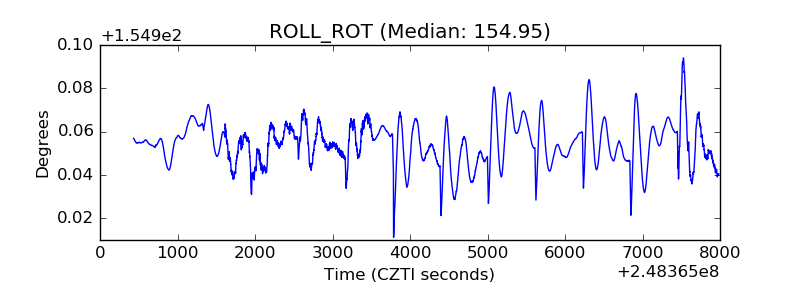 |
| _Roll_DEC | 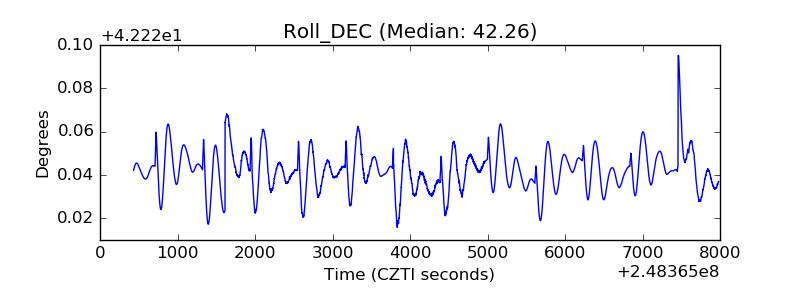 |
| _Roll_RA | 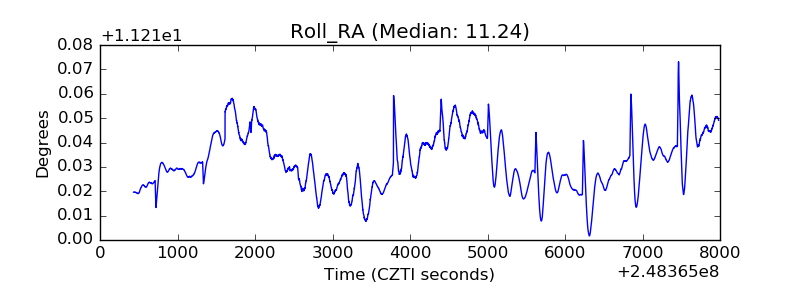 |
| Veto Counter | 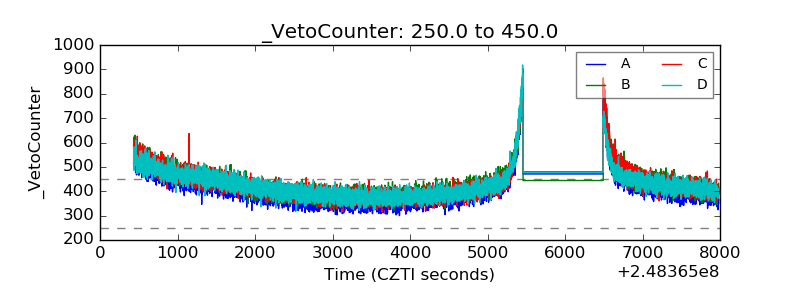 |