| Param | Original file | Final file |
|---|---|---|
| Filename | modeM0/AS1A04_022T05_9000001690_11524cztM0_level2.evt | modeM0/AS1A04_022T05_9000001690_11524cztM0_level2_quad_clean.evt |
| Size (bytes) | 636,056,640 | 90,912,960 |
| Size | 606.6 MB | 86.7 MB |
| Events in quadrant A | 6,219,484 | 549,630 |
| Events in quadrant B | 4,619,223 | 564,516 |
| Events in quadrant C | 3,084,081 | 606,609 |
| Events in quadrant D | 4,883,523 | 561,689 |
| Mode M9 | |||
|---|---|---|---|
| Quadrant | BADHDUFLAG | Total packets | Discarded packets |
| A | 0 | 8 | 0 |
| B | 0 | 8 | 0 |
| C | 0 | 8 | 0 |
| D | 0 | 8 | 0 |
| Mode M0 | |||
|---|---|---|---|
| Quadrant | BADHDUFLAG | Total packets | Discarded packets |
| A | 0 | 23162 | 2 |
| B | 0 | 18139 | 1 |
| C | 0 | 13793 | 1 |
| D | 0 | 18925 | 1 |
| Mode SS | |||
|---|---|---|---|
| Quadrant | BADHDUFLAG | Total packets | Discarded packets |
| A | 0 | 136 | 0 |
| B | 0 | 136 | 0 |
| C | 0 | 136 | 0 |
| D | 0 | 136 | 0 |
| Quadrant | Total seconds | Saturated seconds | Saturation percentage |
|---|---|---|---|
| A | 6752 | 965 | 14.292062% |
| B | 6752 | 378 | 5.598341% |
| C | 6752 | 32 | 0.473934% |
| D | 6752 | 283 | 4.191351% |
Noise dominated data is calculated using 1-second bins in cleaned event files. If a bin has >2000 counts, and if more than 50% of those come from <1% of pixels, then it is considered to be noise-dominated and hence unusable.
| Quadrant | # 1 sec bins | Bins with >0 counts | Bins with >2000 counts | High rate bins dominated by noise | Noise dominated (total time) | Noise dominated (detector-on time) | Marked lightcurve |
|---|---|---|---|---|---|---|---|
| A | 7543 | 6753 | 535 | 535 | 7.09% | 7.92% | 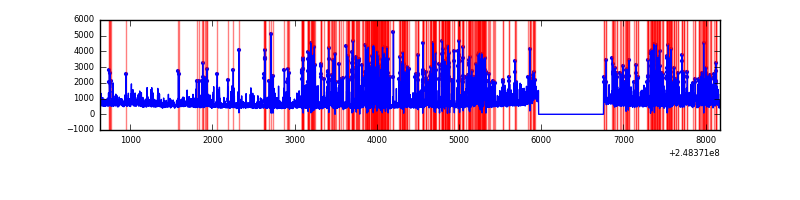 |
| B | 7543 | 6754 | 218 | 218 | 2.89% | 3.23% | 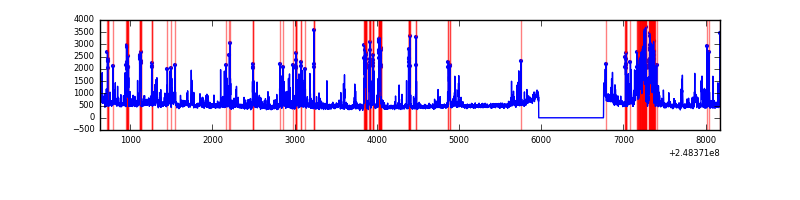 |
| C | 7543 | 6754 | 1 | 1 | 0.01% | 0.01% | 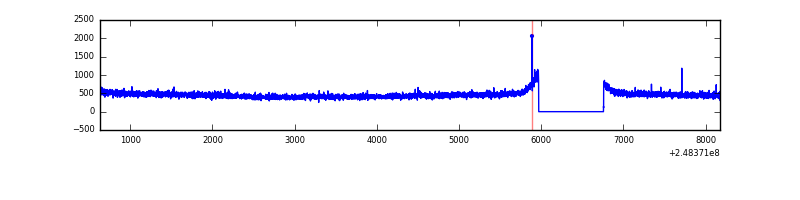 |
| D | 7543 | 6754 | 163 | 163 | 2.16% | 2.41% | 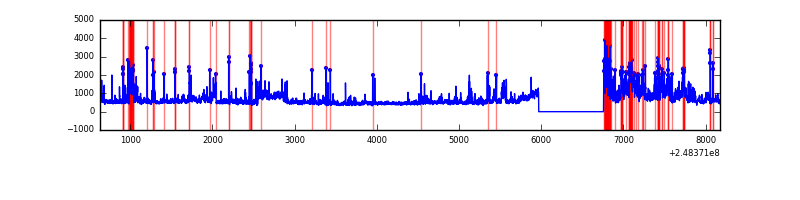 |
Top three noisy pixels from each quadrant. If the there are fewer than three noisy pixels in the level2.evt file, extra rows are filled as -1
| Pixel properties | Quadrant properties | ||||||
|---|---|---|---|---|---|---|---|
| Quadrant | DetID | PixID | Counts | Sigma | Mean | Median | Sigma |
| A | 8 | 5 | 3172127 | 20783.19 | 745 | 728 | 152.6 |
| A | 1 | 162 | 52690 | 340.52 | 745 | 728 | 152.6 |
| A | 9 | 143 | 31742 | 203.24 | 745 | 728 | 152.6 |
| B | 4 | 239 | 1248406 | 8326.81 | 784 | 766 | 149.8 |
| B | 11 | 51 | 102823 | 681.13 | 784 | 766 | 149.8 |
| B | 15 | 204 | 75427 | 498.29 | 784 | 766 | 149.8 |
| C | 13 | 61 | 5615 | 26.16 | 790 | 795 | 184.3 |
| C | 14 | 234 | 3402 | 14.15 | 790 | 795 | 184.3 |
| C | 3 | 202 | 1940 | 6.21 | 790 | 795 | 184.3 |
| D | 13 | 152 | 1131229 | 6062.07 | 779 | 759 | 186.5 |
| D | 1 | 52 | 297349 | 1590.44 | 779 | 759 | 186.5 |
| D | 5 | 222 | 181607 | 969.78 | 779 | 759 | 186.5 |
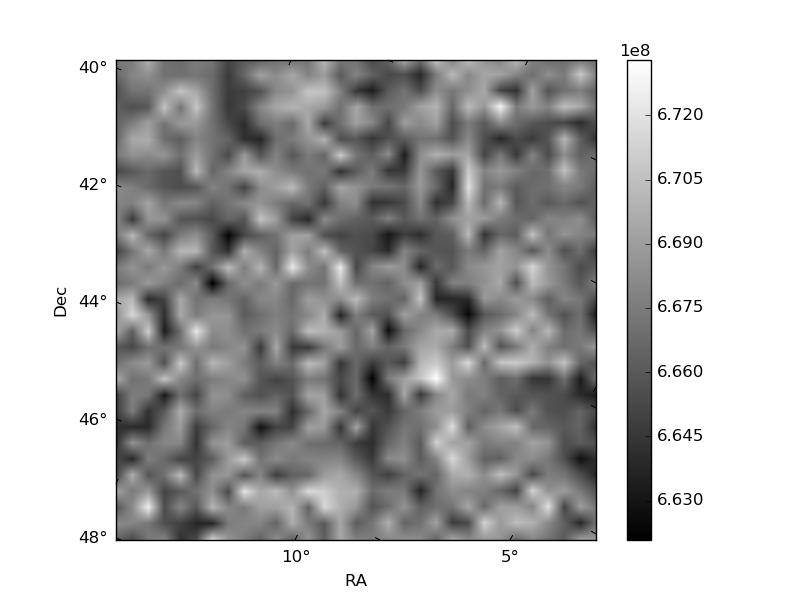
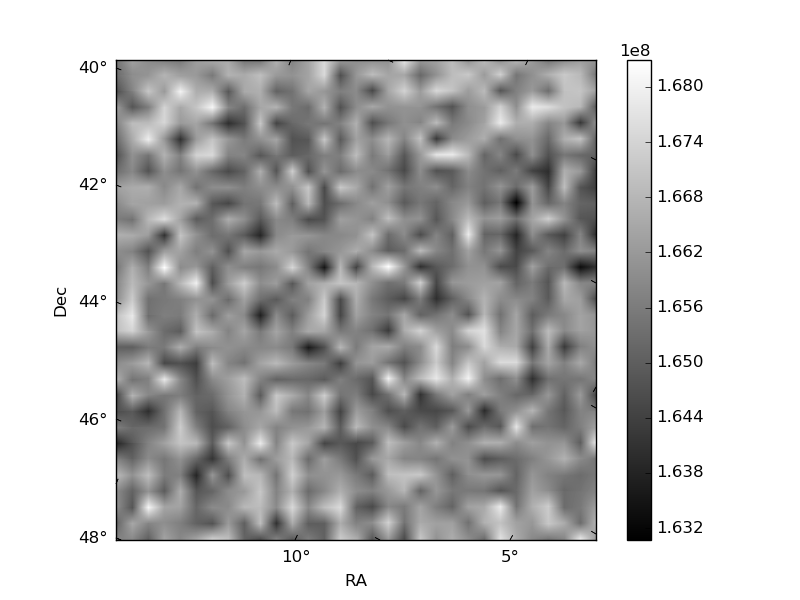
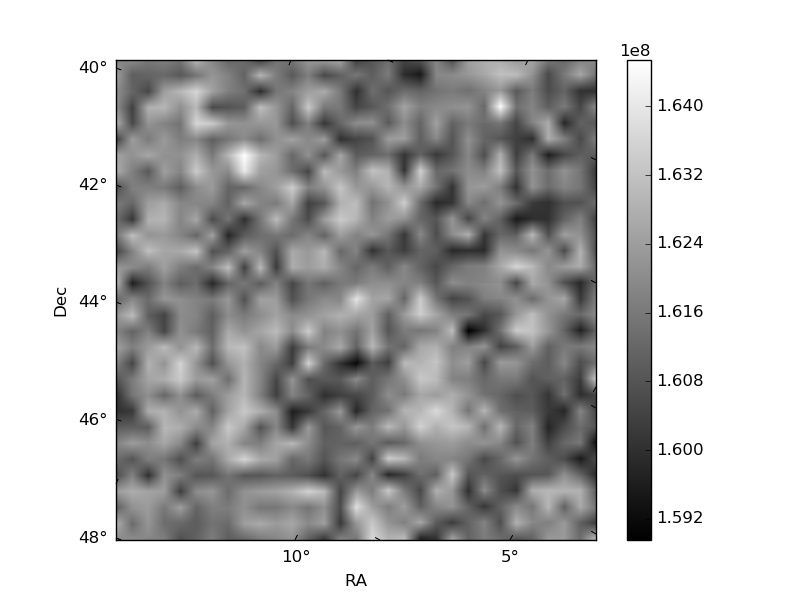
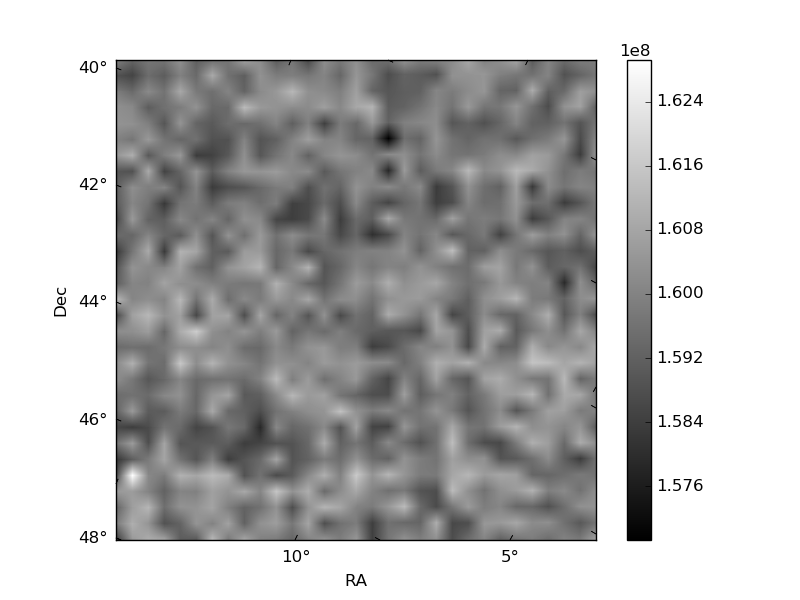
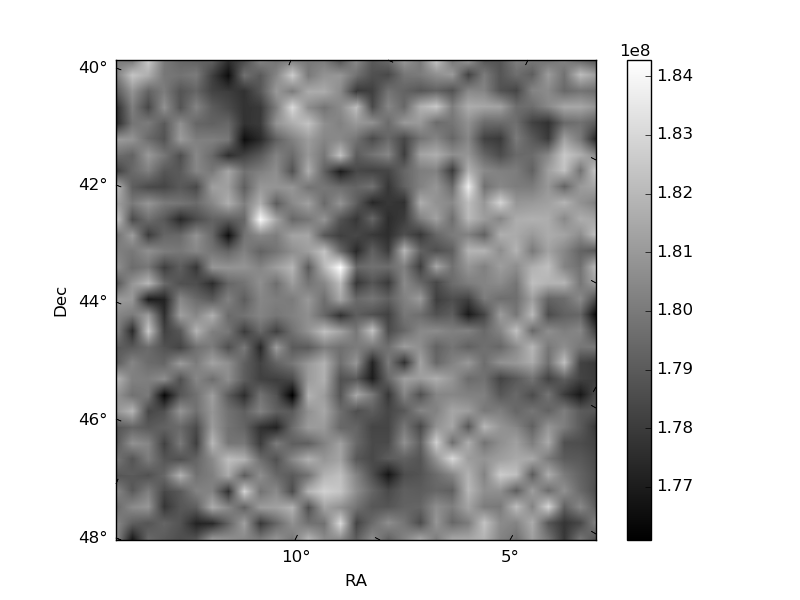
Histogram calculated using DETX and DETY for each event in the final _common_clean file
| Quadrant A | 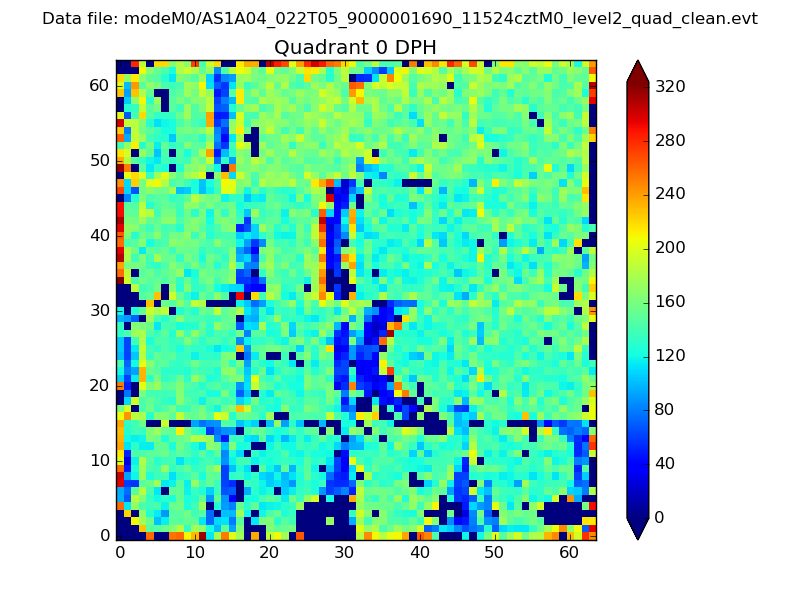 |
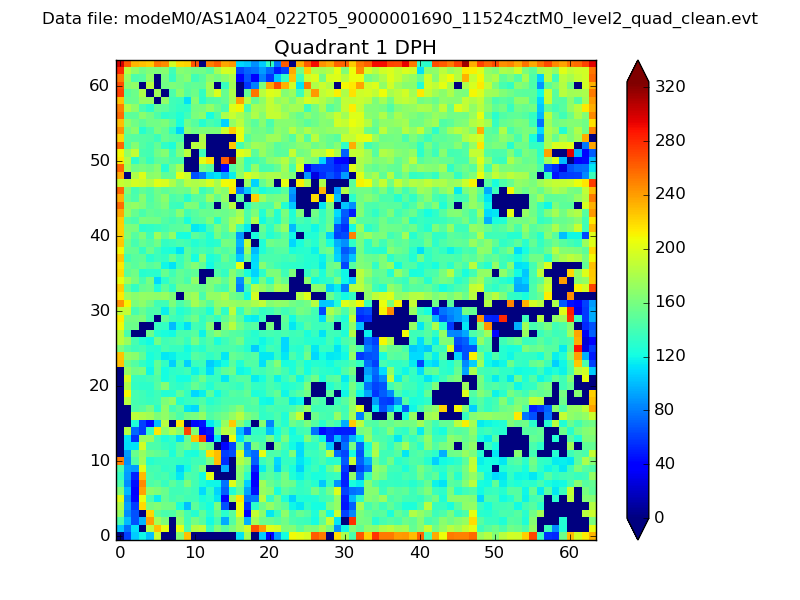 |
Quadrant B |
|---|---|---|---|
| Quadrant D | 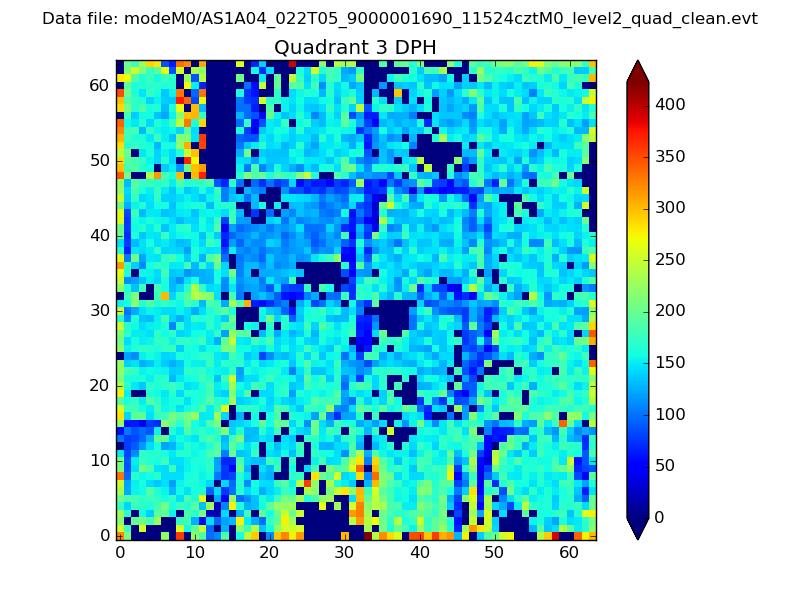 |
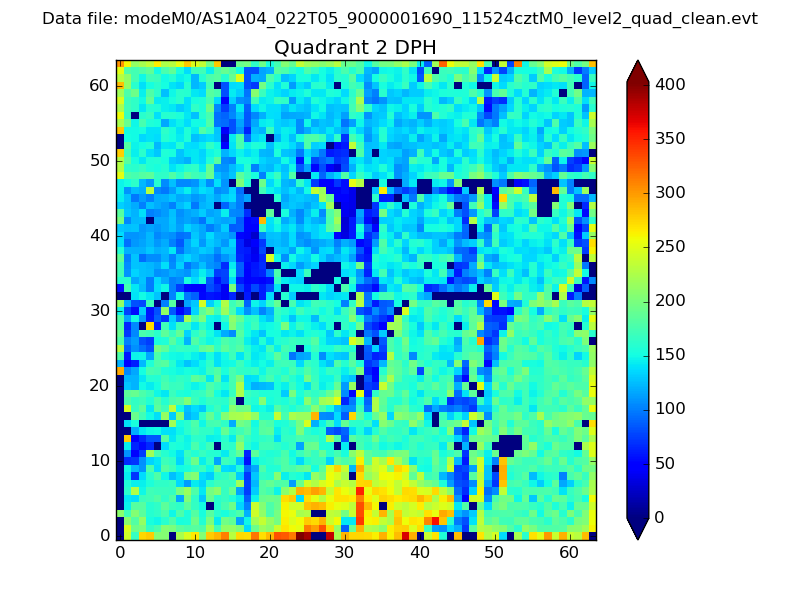 |
Quadrant C |
| Plot type | Count rate plots | Images |
|---|---|---|
| Comparison with Poisson distribution Blue bars denote a histogram of data divided into 1 sec bins. Red curve is a Poisson curve with rate = median count rate of data. |
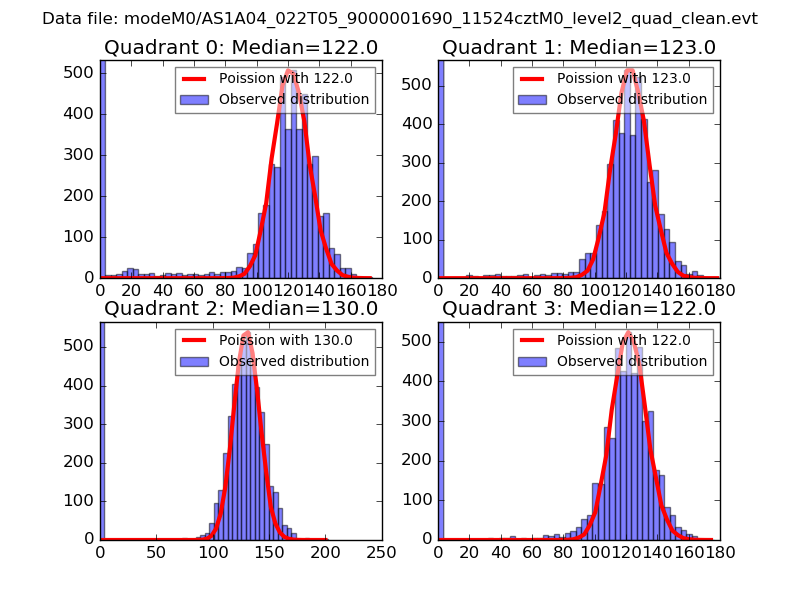 |
 |
| Quadrant-wise count rates Data is divided into 100 sec bins |
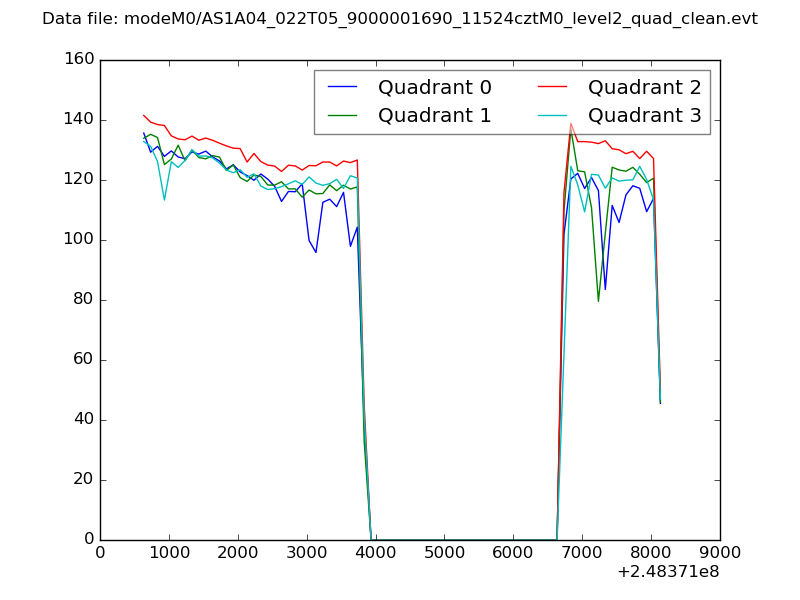 |
|
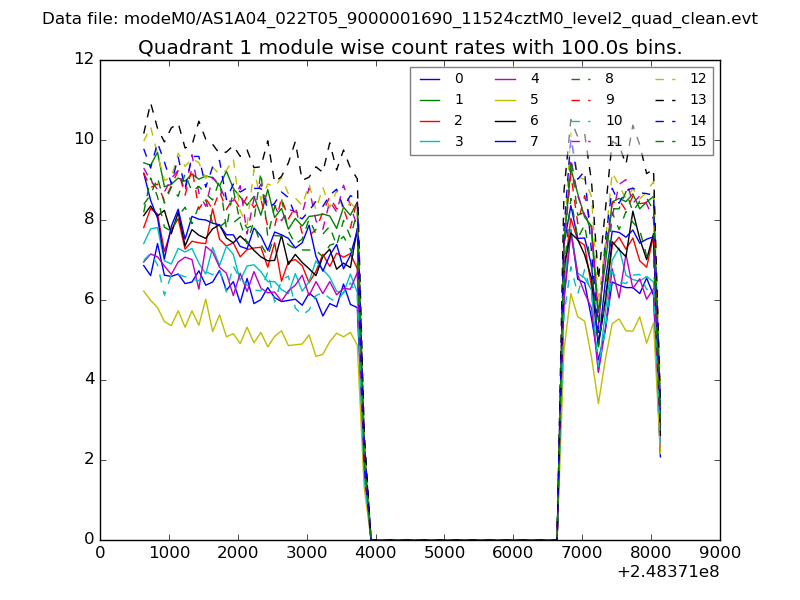
| Module-wise count rates for Quadrant A Data is divided into 100 sec bins |
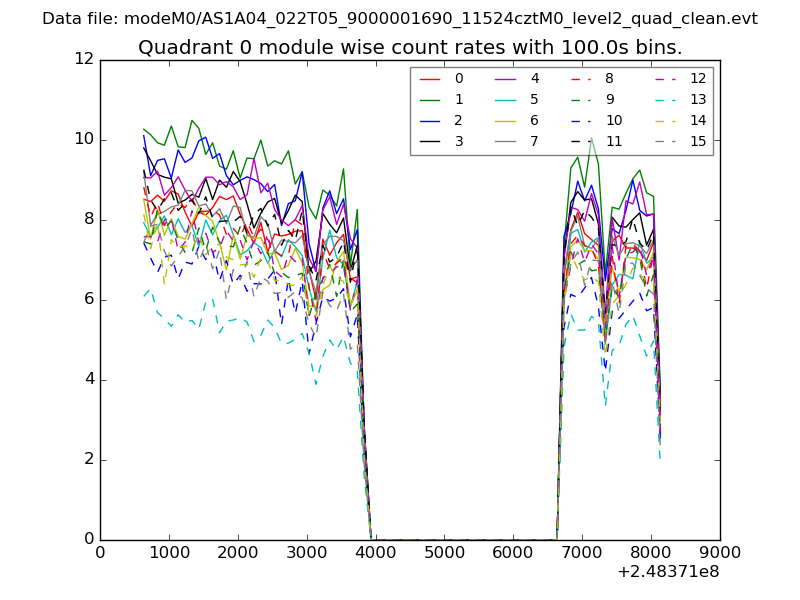 |
 |
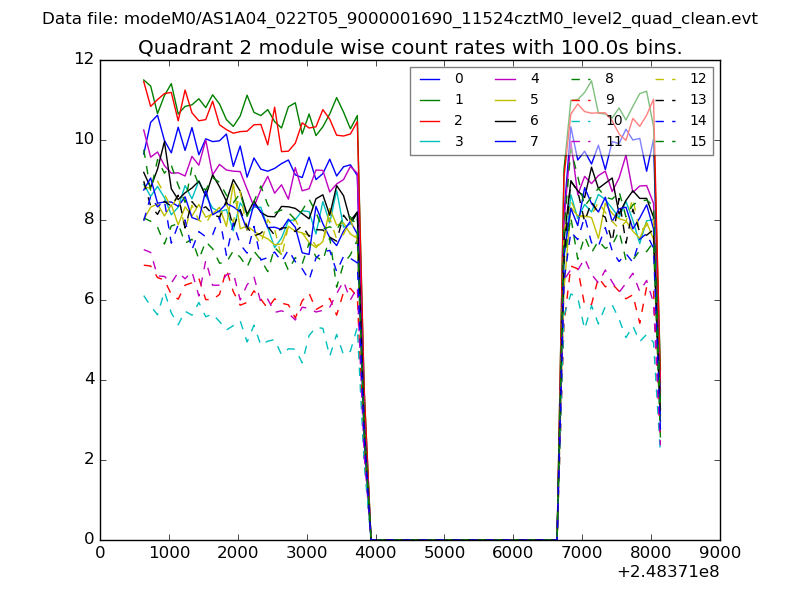
| Module-wise count rates for Quadrant B Data is divided into 100 sec bins |
 |
 |
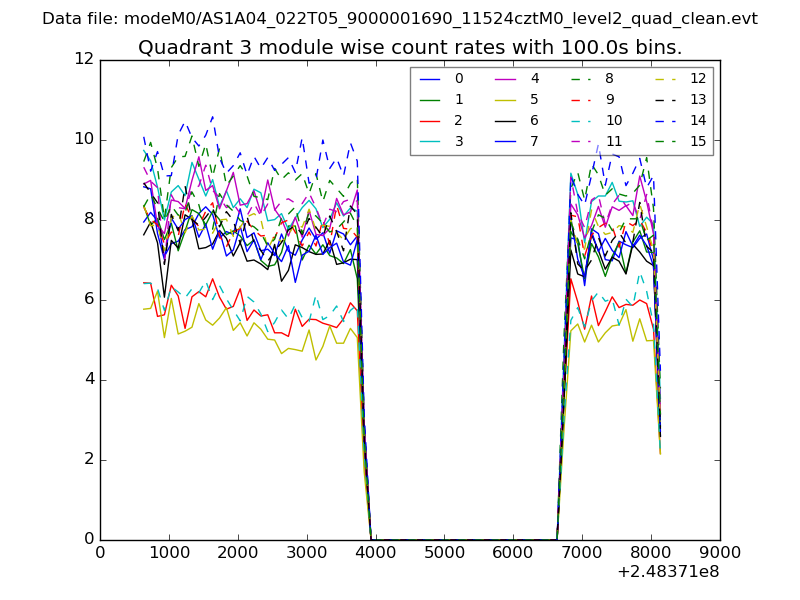
| Module-wise count rates for Quadrant C Data is divided into 100 sec bins |
 |
 |
| Module-wise count rates for Quadrant D Data is divided into 100 sec bins |
 |
 |
| Parameter | Plot |
|---|---|
| CZT HV Monitor | 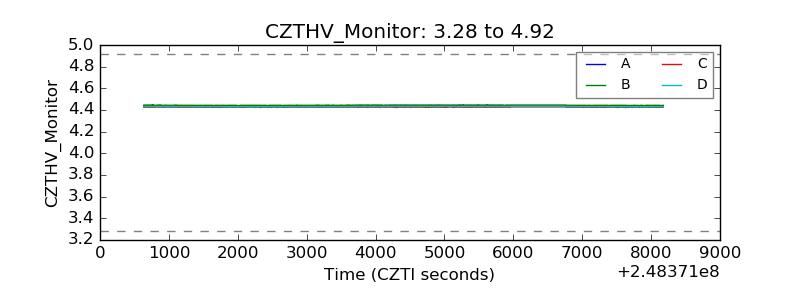 |
| D_VDD | 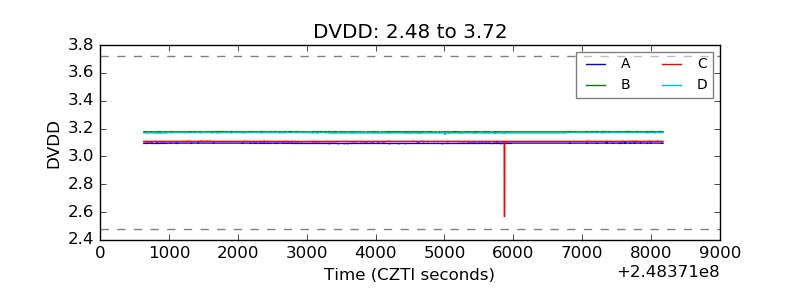 |
| Temperature 1 | 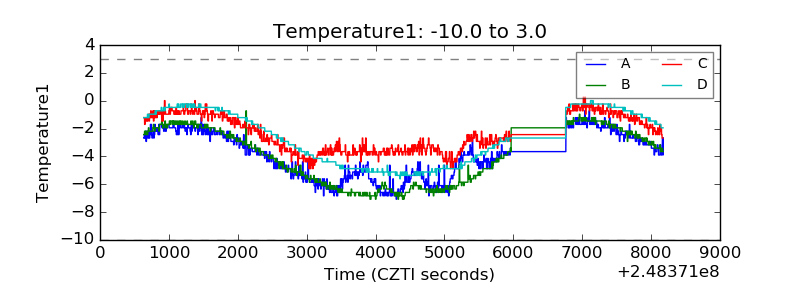 |
| Veto HV Monitor | 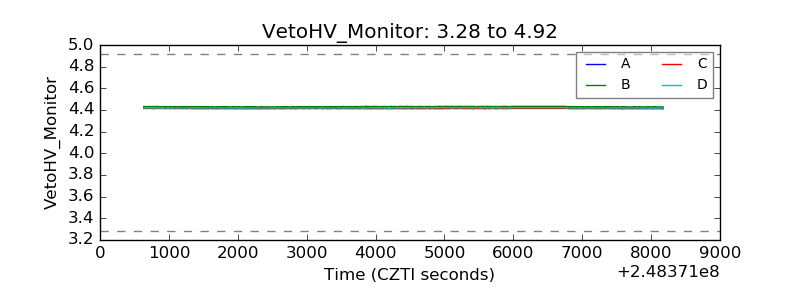 |
| Veto LLD | 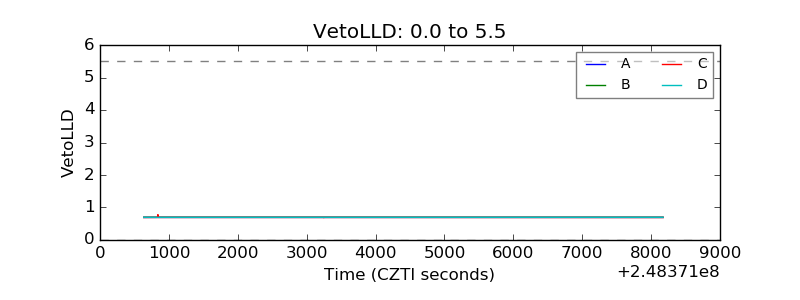 |
| Alpha Counter | 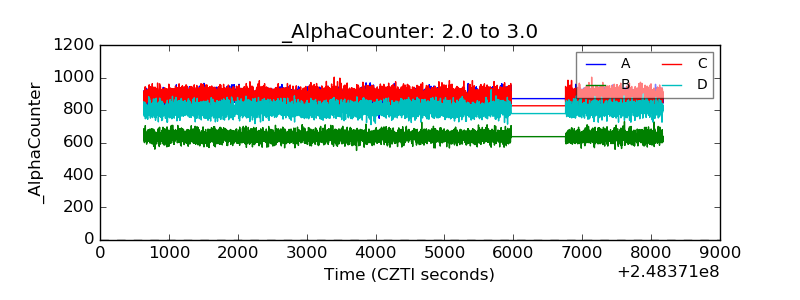 |
| _CPM_Rate | 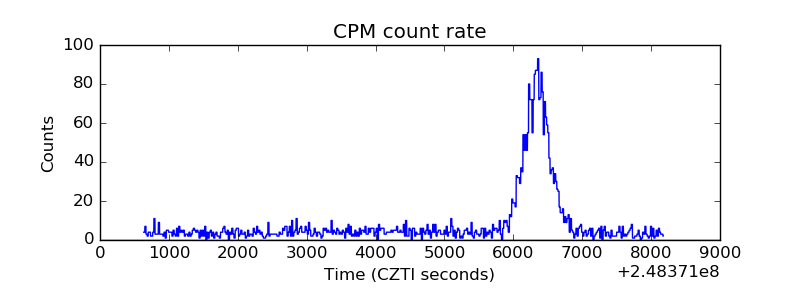 |
| CZT Counter | 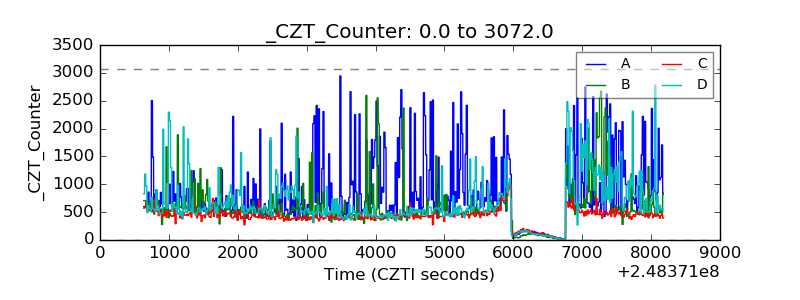 |
| +2.5 Volts monitor |  |
| +5 Volts monitor |  |
| _ROLL_ROT | 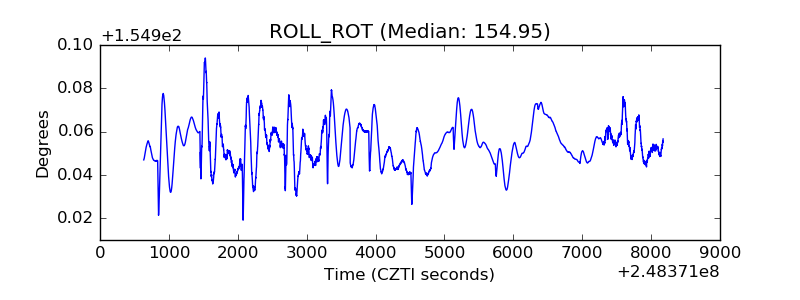 |
| _Roll_DEC | 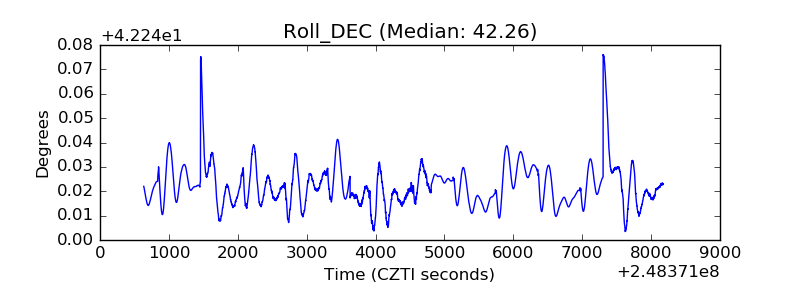 |
| _Roll_RA | 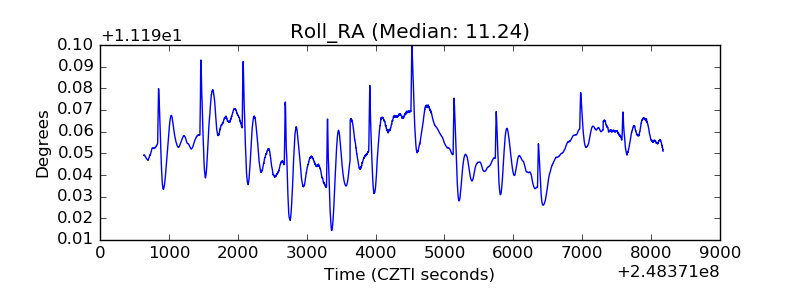 |
| Veto Counter | 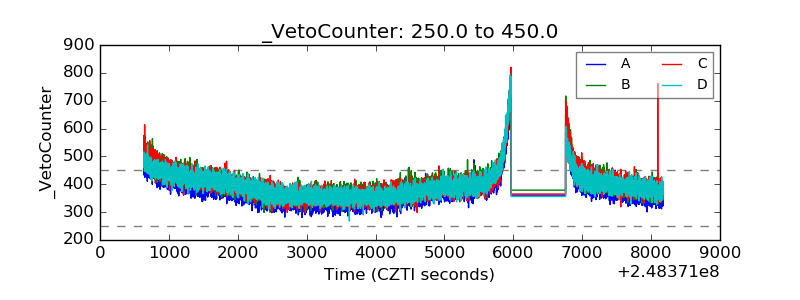 |