| Param | Original file | Final file |
|---|---|---|
| Filename | modeM0/AS1A04_022T05_9000001690_11526cztM0_level2.evt | modeM0/AS1A04_022T05_9000001690_11526cztM0_level2_quad_clean.evt |
| Size (bytes) | 698,472,000 | 109,785,600 |
| Size | 666.1 MB | 104.7 MB |
| Events in quadrant A | 6,906,749 | 642,431 |
| Events in quadrant B | 5,625,170 | 686,113 |
| Events in quadrant C | 3,629,469 | 748,560 |
| Events in quadrant D | 4,460,035 | 700,748 |
| Mode M9 | |||
|---|---|---|---|
| Quadrant | BADHDUFLAG | Total packets | Discarded packets |
| A | 0 | 7 | 0 |
| B | 0 | 7 | 0 |
| C | 0 | 7 | 0 |
| D | 0 | 7 | 0 |
| Mode M0 | |||
|---|---|---|---|
| Quadrant | BADHDUFLAG | Total packets | Discarded packets |
| A | 0 | 25959 | 3 |
| B | 0 | 22054 | 2 |
| C | 0 | 16333 | 2 |
| D | 0 | 18712 | 2 |
| Mode SS | |||
|---|---|---|---|
| Quadrant | BADHDUFLAG | Total packets | Discarded packets |
| A | 0 | 160 | 0 |
| B | 0 | 160 | 0 |
| C | 0 | 160 | 0 |
| D | 0 | 160 | 0 |
| Quadrant | Total seconds | Saturated seconds | Saturation percentage |
|---|---|---|---|
| A | 7861 | 1095 | 13.929526% |
| B | 7861 | 548 | 6.971123% |
| C | 7861 | 24 | 0.305305% |
| D | 7861 | 136 | 1.730060% |
Noise dominated data is calculated using 1-second bins in cleaned event files. If a bin has >2000 counts, and if more than 50% of those come from <1% of pixels, then it is considered to be noise-dominated and hence unusable.
| Quadrant | # 1 sec bins | Bins with >0 counts | Bins with >2000 counts | High rate bins dominated by noise | Noise dominated (total time) | Noise dominated (detector-on time) | Marked lightcurve |
|---|---|---|---|---|---|---|---|
| A | 8507 | 7864 | 557 | 557 | 6.55% | 7.08% | 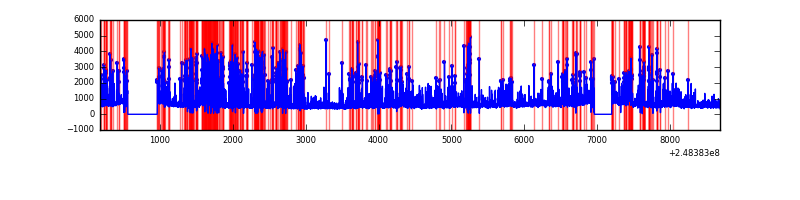 |
| B | 8507 | 7864 | 254 | 254 | 2.99% | 3.23% |  |
| C | 8507 | 7864 | 0 | 0 | 0.00% | 0.00% |  |
| D | 8507 | 7864 | 90 | 90 | 1.06% | 1.14% |  |
Top three noisy pixels from each quadrant. If the there are fewer than three noisy pixels in the level2.evt file, extra rows are filled as -1
| Pixel properties | Quadrant properties | ||||||
|---|---|---|---|---|---|---|---|
| Quadrant | DetID | PixID | Counts | Sigma | Mean | Median | Sigma |
| A | 8 | 5 | 3183204 | 17703.55 | 875 | 854 | 179.8 |
| A | 9 | 143 | 130446 | 720.93 | 875 | 854 | 179.8 |
| A | 1 | 162 | 75944 | 417.73 | 875 | 854 | 179.8 |
| B | 4 | 239 | 1494998 | 8487.61 | 916 | 892 | 176.0 |
| B | 0 | 219 | 185295 | 1047.54 | 916 | 892 | 176.0 |
| B | 11 | 51 | 167131 | 944.36 | 916 | 892 | 176.0 |
| C | 13 | 61 | 7044 | 27.96 | 930 | 936 | 218.5 |
| C | 12 | 4 | 4010 | 14.07 | 930 | 936 | 218.5 |
| C | 3 | 202 | 2199 | 5.78 | 930 | 936 | 218.5 |
| D | 1 | 52 | 307145 | 1374.61 | 921 | 894 | 222.8 |
| D | 13 | 152 | 286212 | 1280.66 | 921 | 894 | 222.8 |
| D | 2 | 120 | 162136 | 723.74 | 921 | 894 | 222.8 |
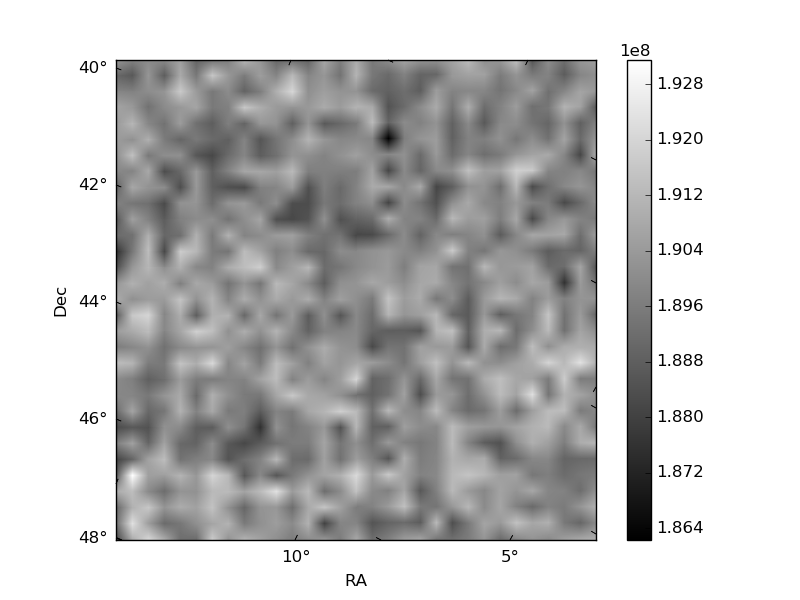
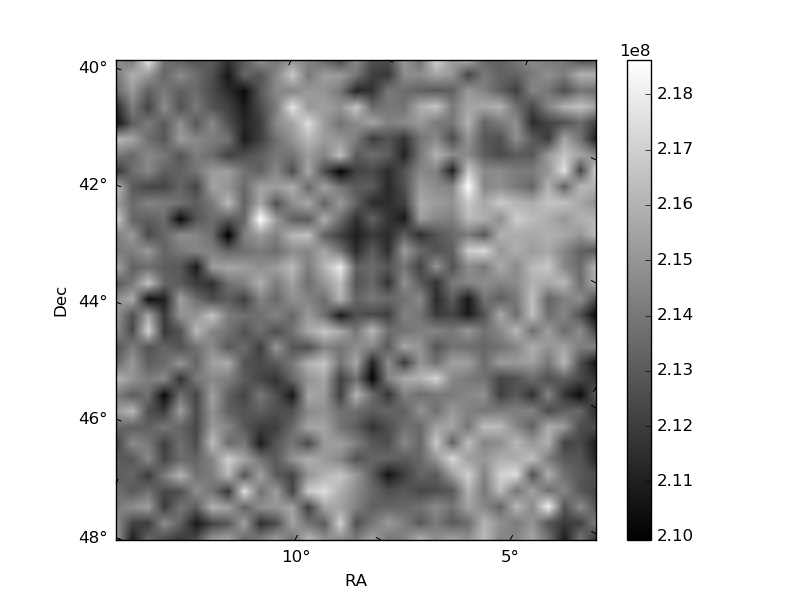
Histogram calculated using DETX and DETY for each event in the final _common_clean file
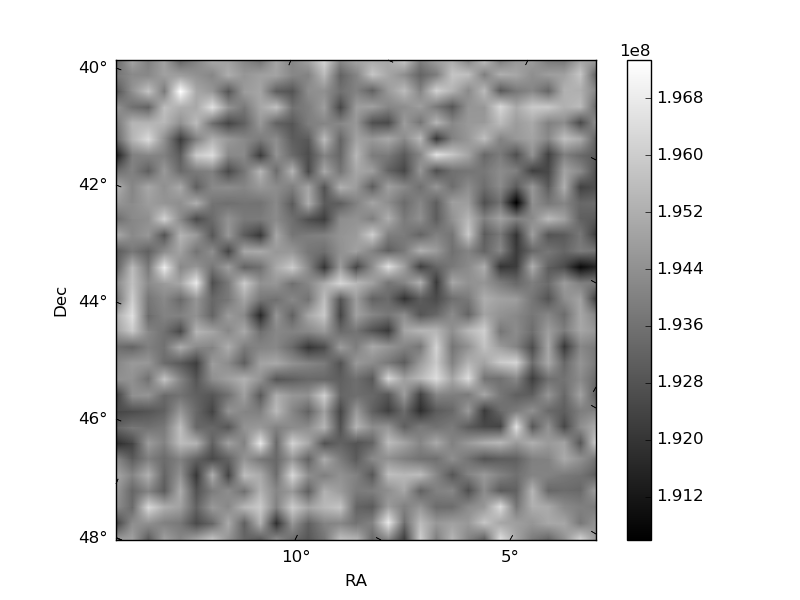
| Quadrant A | 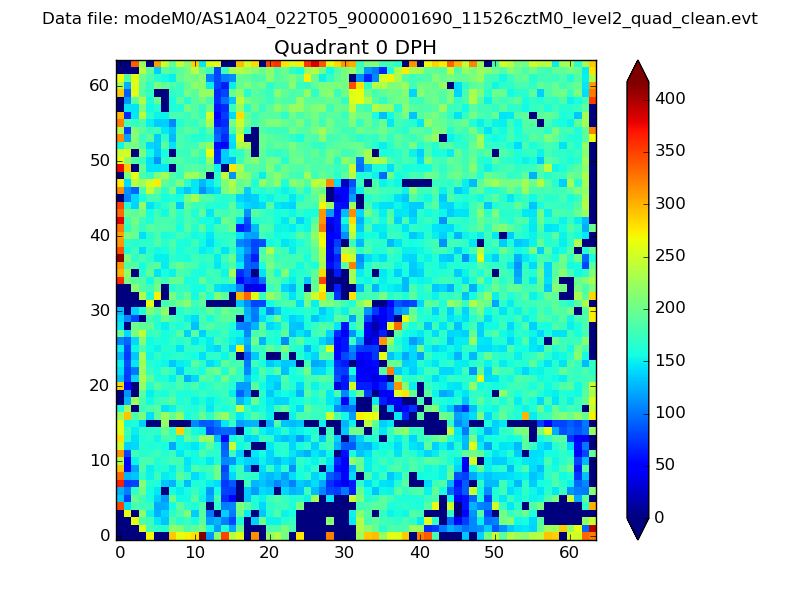 |
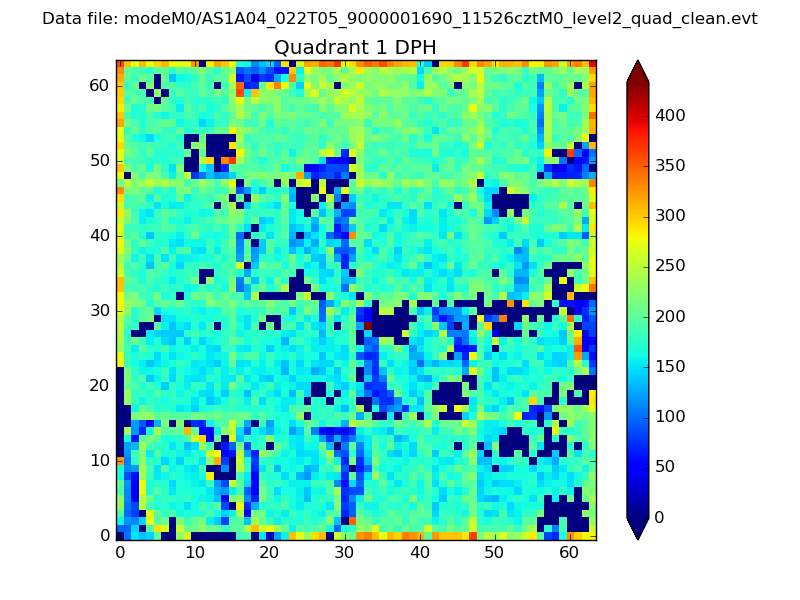 |
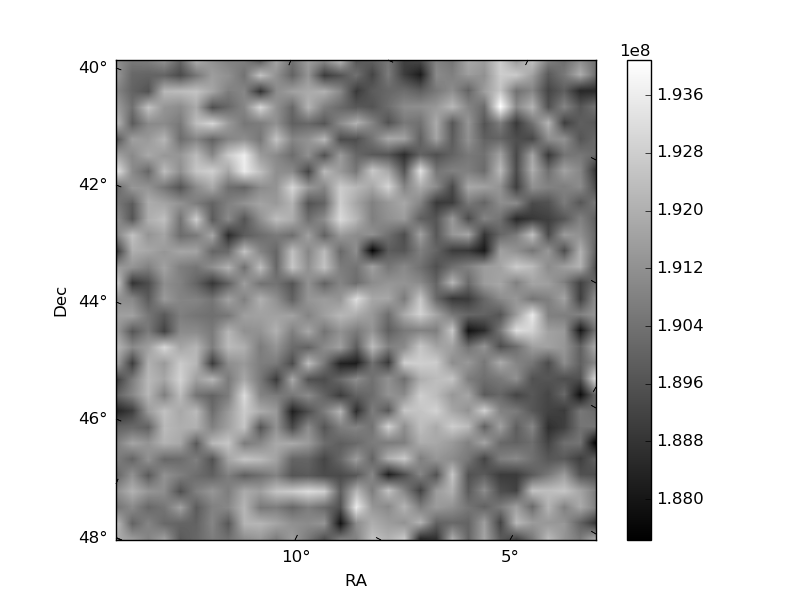
Quadrant B |
|---|---|---|---|
| Quadrant D | 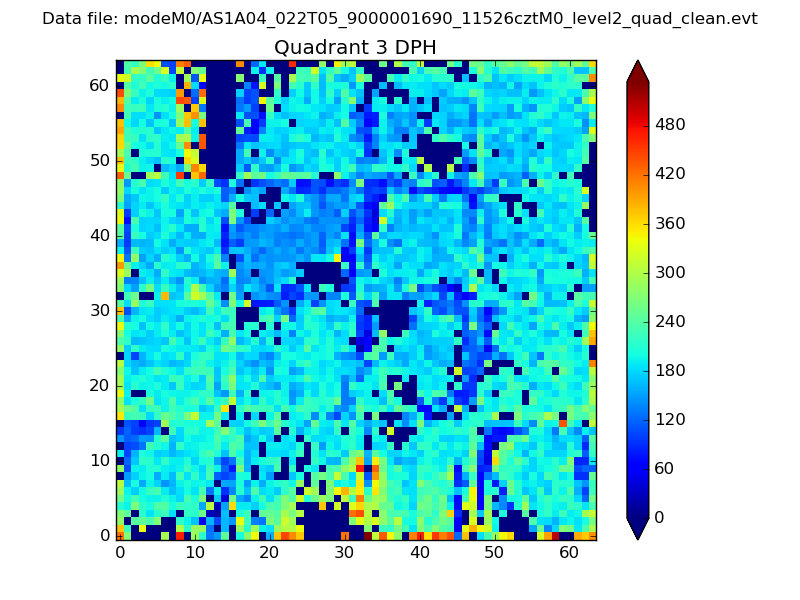 |
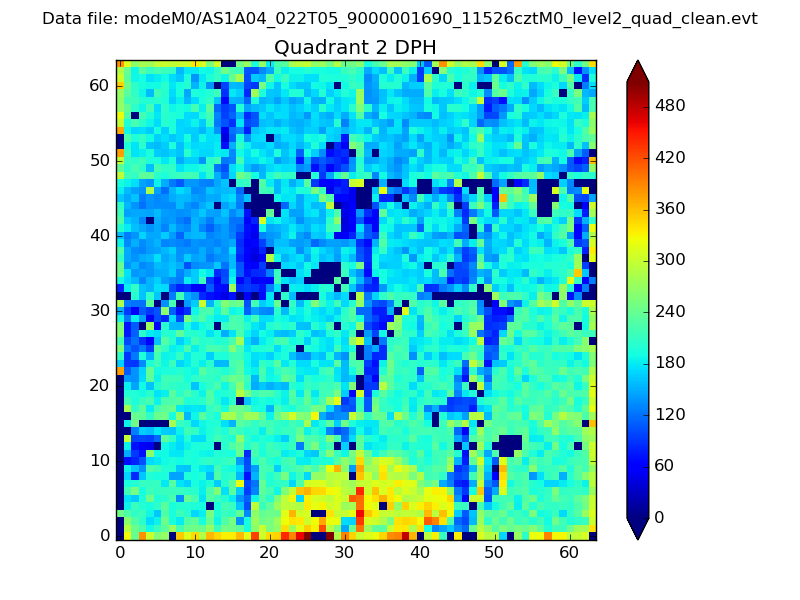 |
Quadrant C |
| Plot type | Count rate plots | Images |
|---|---|---|
| Comparison with Poisson distribution Blue bars denote a histogram of data divided into 1 sec bins. Red curve is a Poisson curve with rate = median count rate of data. |
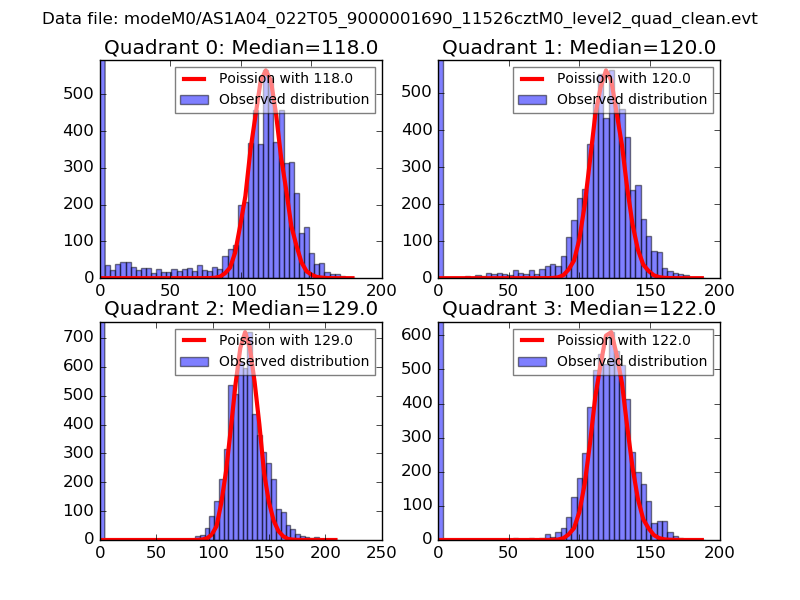 |
 |
| Quadrant-wise count rates Data is divided into 100 sec bins |
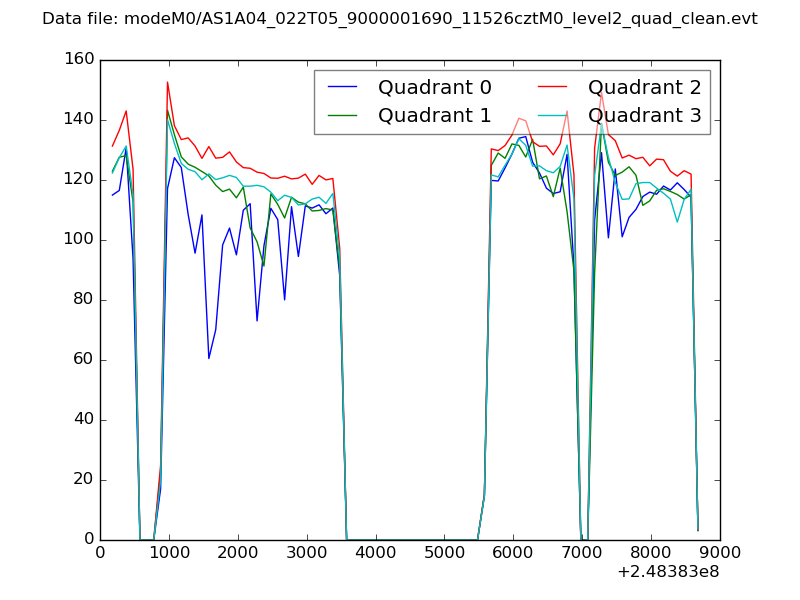 |
|
| Module-wise count rates for Quadrant A Data is divided into 100 sec bins |
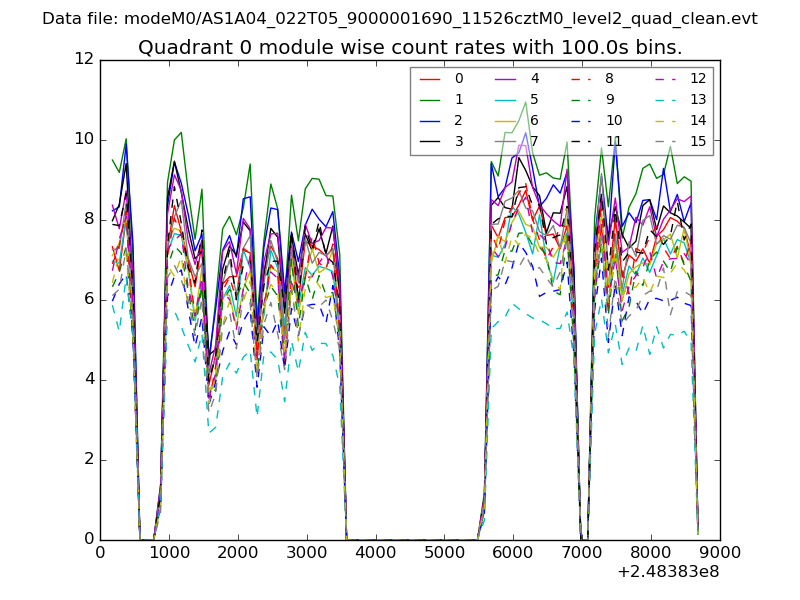 |
 |
| Module-wise count rates for Quadrant B Data is divided into 100 sec bins |
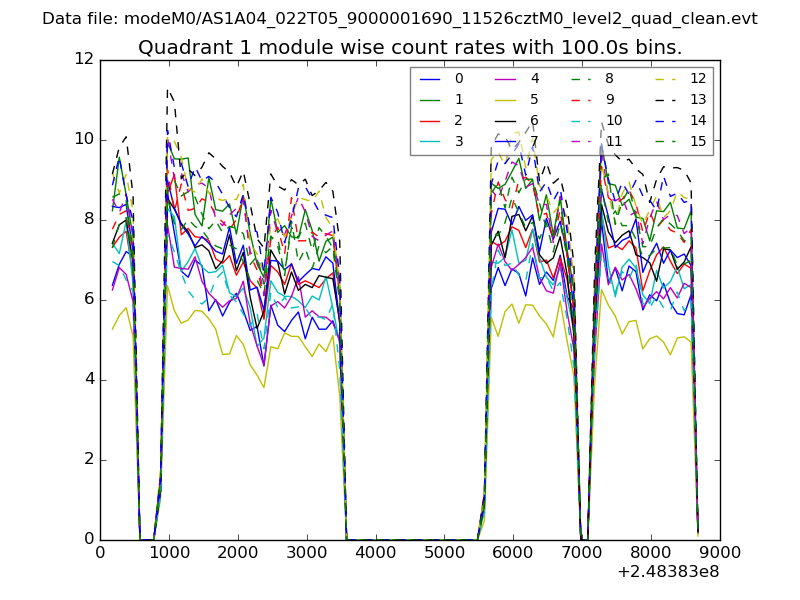 |
 |
| Module-wise count rates for Quadrant C Data is divided into 100 sec bins |
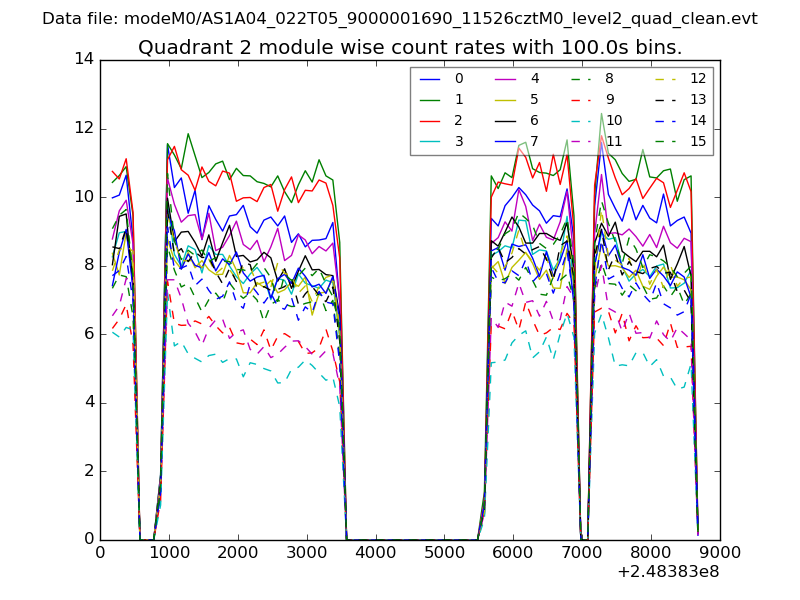 |
 |
| Module-wise count rates for Quadrant D Data is divided into 100 sec bins |
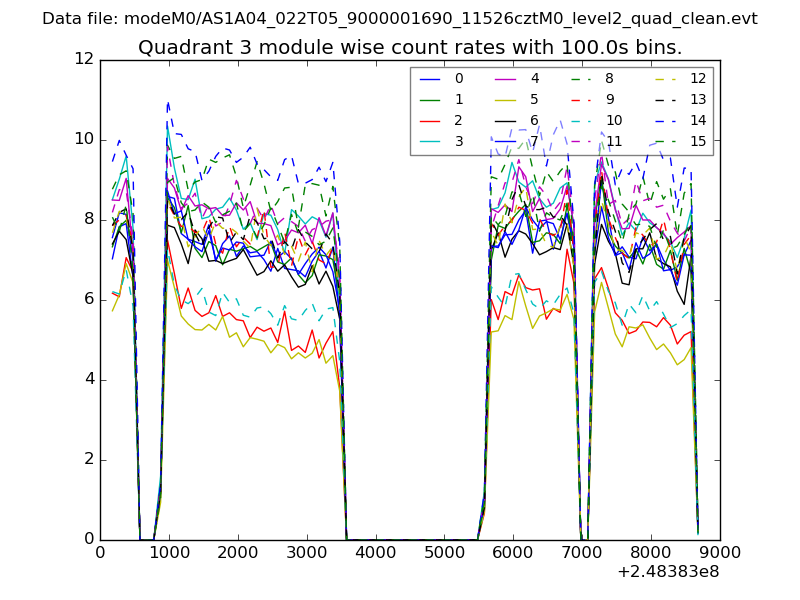 |
 |
| Parameter | Plot |
|---|---|
| CZT HV Monitor | 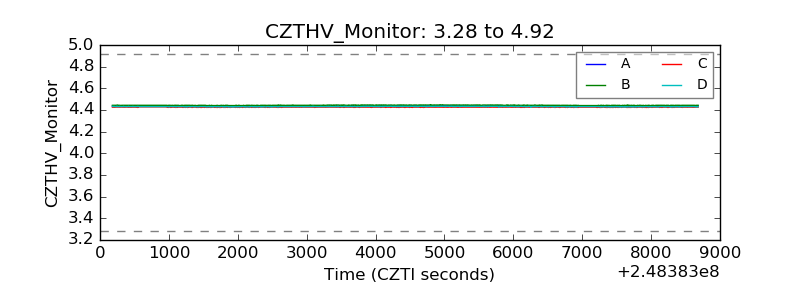 |
| D_VDD | 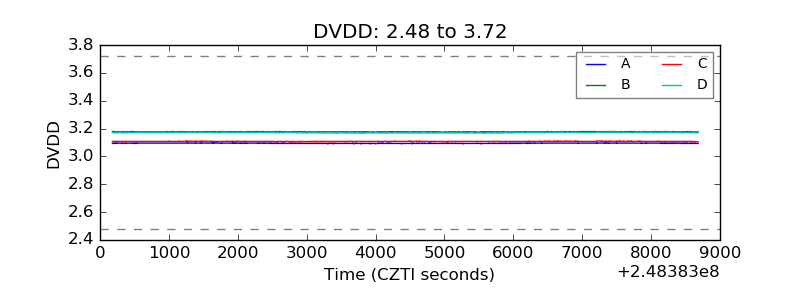 |
| Temperature 1 | 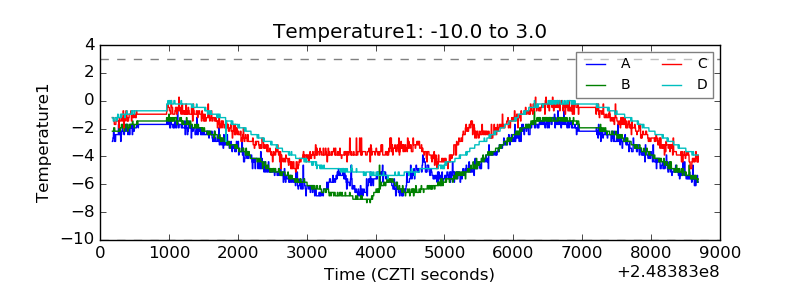 |
| Veto HV Monitor | 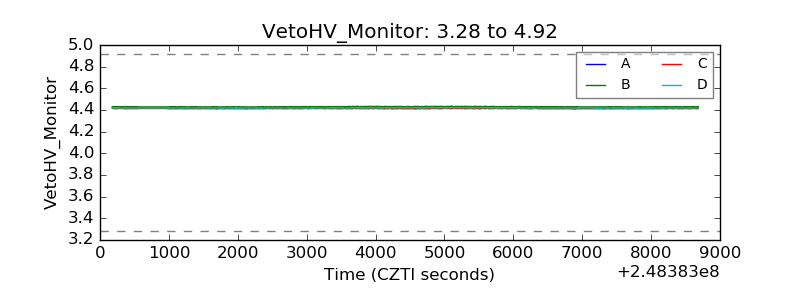 |
| Veto LLD | 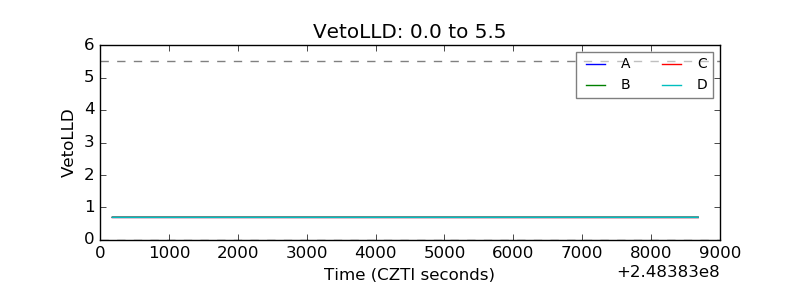 |
| Alpha Counter | 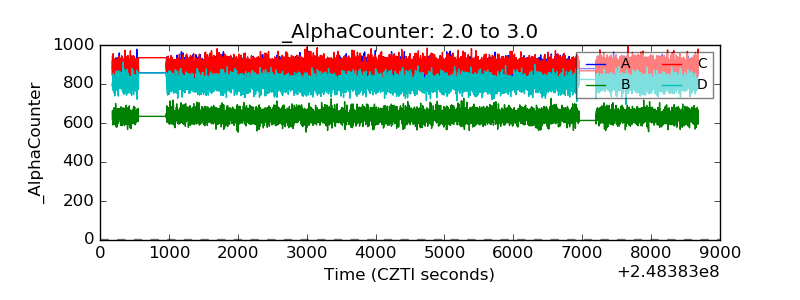 |
| _CPM_Rate | 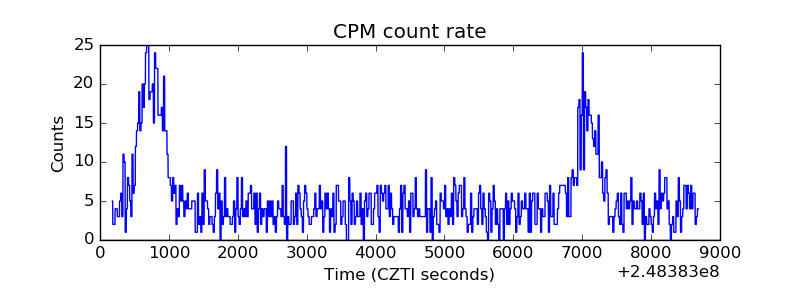 |
| CZT Counter | 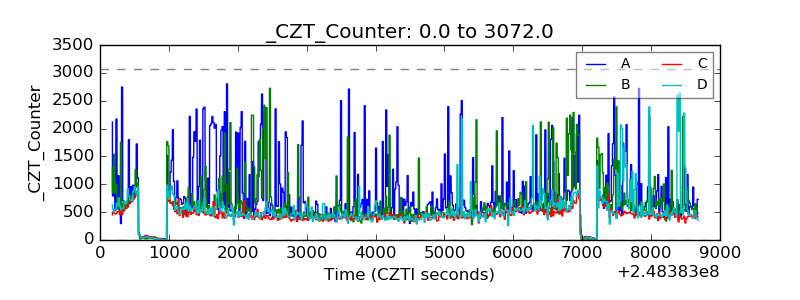 |
| +2.5 Volts monitor |  |
| +5 Volts monitor |  |
| _ROLL_ROT | 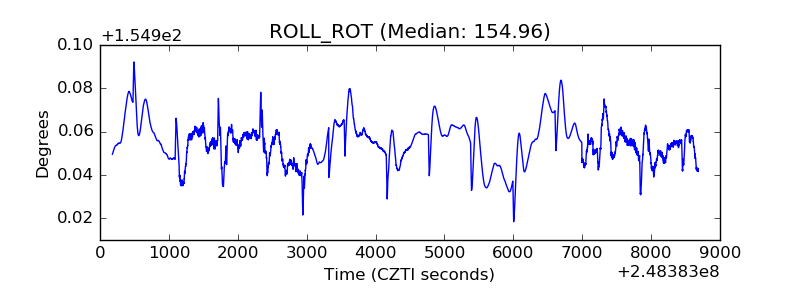 |
| _Roll_DEC | 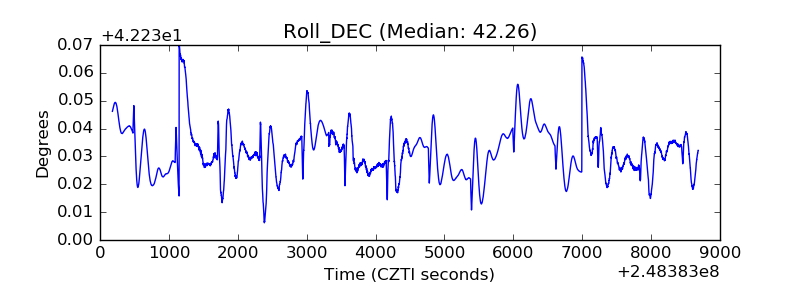 |
| _Roll_RA | 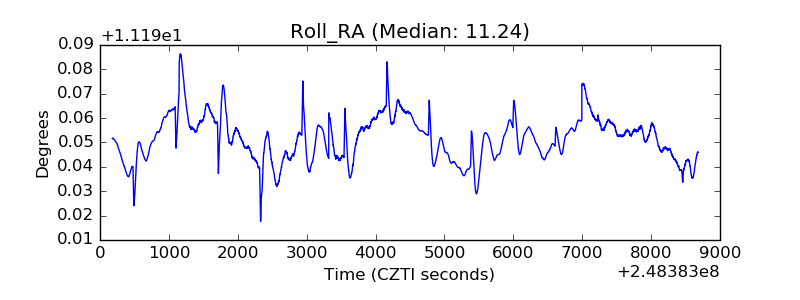 |
| Veto Counter | 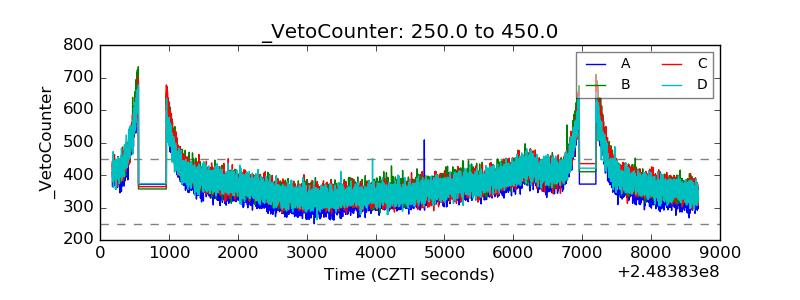 |