| Param | Original file | Final file |
|---|---|---|
| Filename | modeM0/AS1A04_022T05_9000001690_11529cztM0_level2.evt | modeM0/AS1A04_022T05_9000001690_11529cztM0_level2_quad_clean.evt |
| Size (bytes) | 1,062,884,160 | 167,048,640 |
| Size | 1013.6 MB | 159.3 MB |
| Events in quadrant A | 9,587,702 | 1,002,739 |
| Events in quadrant B | 7,744,145 | 1,024,597 |
| Events in quadrant C | 5,983,826 | 1,088,057 |
| Events in quadrant D | 7,969,892 | 1,018,997 |
| Mode M9 | |||
|---|---|---|---|
| Quadrant | BADHDUFLAG | Total packets | Discarded packets |
| A | 0 | 16 | 0 |
| B | 0 | 16 | 0 |
| C | 0 | 16 | 0 |
| D | 0 | 16 | 0 |
| Mode M0 | |||
|---|---|---|---|
| Quadrant | BADHDUFLAG | Total packets | Discarded packets |
| A | 0 | 37554 | 4 |
| B | 0 | 32088 | 3 |
| C | 0 | 27162 | 3 |
| D | 0 | 33326 | 3 |
| Mode SS | |||
|---|---|---|---|
| Quadrant | BADHDUFLAG | Total packets | Discarded packets |
| A | 0 | 274 | 0 |
| B | 0 | 274 | 0 |
| C | 0 | 274 | 0 |
| D | 0 | 274 | 0 |
| Quadrant | Total seconds | Saturated seconds | Saturation percentage |
|---|---|---|---|
| A | 13380 | 841 | 6.285501% |
| B | 13380 | 376 | 2.810164% |
| C | 13380 | 14 | 0.104634% |
| D | 13380 | 215 | 1.606876% |
Noise dominated data is calculated using 1-second bins in cleaned event files. If a bin has >2000 counts, and if more than 50% of those come from <1% of pixels, then it is considered to be noise-dominated and hence unusable.
| Quadrant | # 1 sec bins | Bins with >0 counts | Bins with >2000 counts | High rate bins dominated by noise | Noise dominated (total time) | Noise dominated (detector-on time) | Marked lightcurve |
|---|---|---|---|---|---|---|---|
| A | 15011 | 13382 | 504 | 504 | 3.36% | 3.77% | 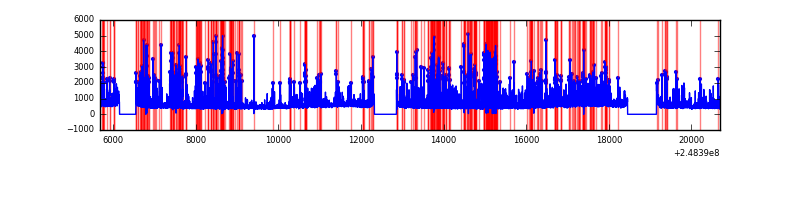 |
| B | 15011 | 13384 | 160 | 160 | 1.07% | 1.20% | 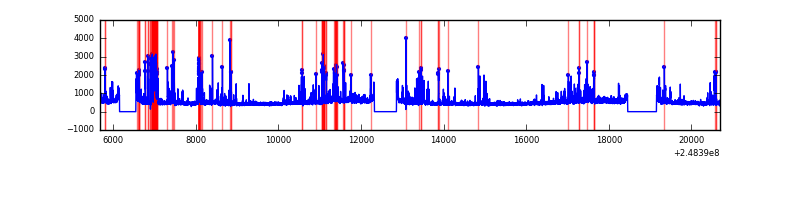 |
| C | 15011 | 13384 | 0 | 0 | 0.00% | 0.00% | 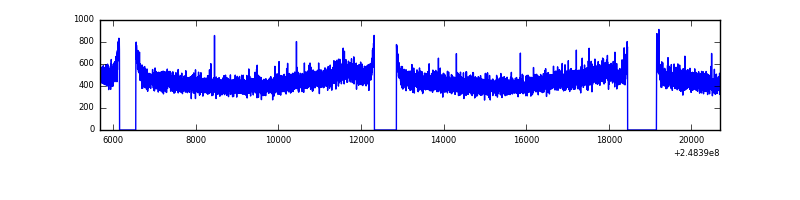 |
| D | 15011 | 13384 | 178 | 178 | 1.19% | 1.33% | 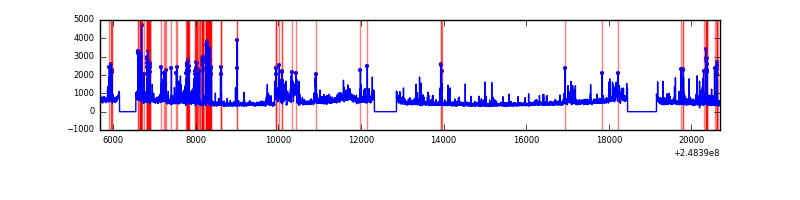 |
Top three noisy pixels from each quadrant. If the there are fewer than three noisy pixels in the level2.evt file, extra rows are filled as -1
| Pixel properties | Quadrant properties | ||||||
|---|---|---|---|---|---|---|---|
| Quadrant | DetID | PixID | Counts | Sigma | Mean | Median | Sigma |
| A | 8 | 5 | 3452507 | 11273.41 | 1508 | 1471 | 306.1 |
| A | 9 | 143 | 113174 | 364.9 | 1508 | 1471 | 306.1 |
| A | 1 | 162 | 73998 | 236.92 | 1508 | 1471 | 306.1 |
| B | 4 | 239 | 1184324 | 4041.99 | 1540 | 1502 | 292.6 |
| B | 15 | 204 | 262786 | 892.87 | 1540 | 1502 | 292.6 |
| B | 3 | 189 | 85847 | 288.23 | 1540 | 1502 | 292.6 |
| C | 13 | 61 | 11158 | 26.94 | 1532 | 1539 | 357.0 |
| C | 14 | 67 | 8021 | 18.16 | 1532 | 1539 | 357.0 |
| C | 7 | 236 | 5043 | 9.82 | 1532 | 1539 | 357.0 |
| D | 1 | 52 | 834100 | 2284.59 | 1512 | 1468 | 364.5 |
| D | 8 | 195 | 531578 | 1454.52 | 1512 | 1468 | 364.5 |
| D | 10 | 253 | 290905 | 794.16 | 1512 | 1468 | 364.5 |
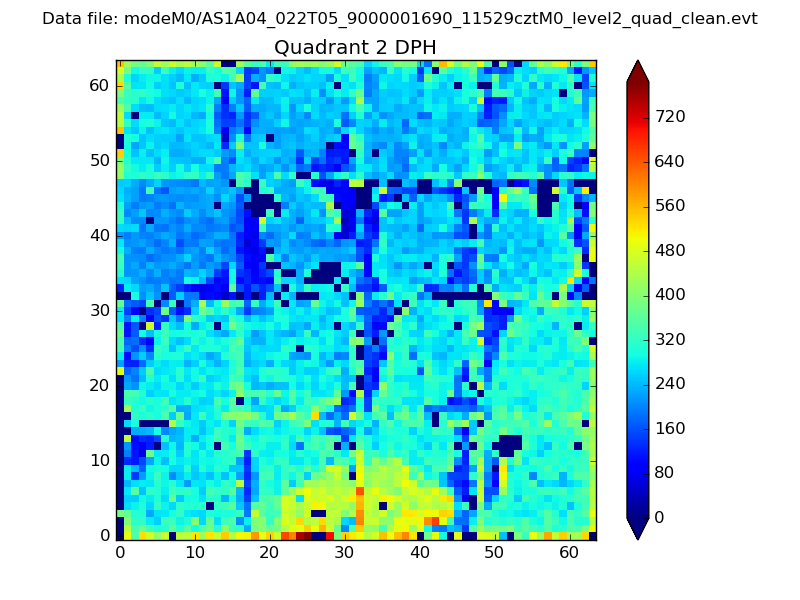
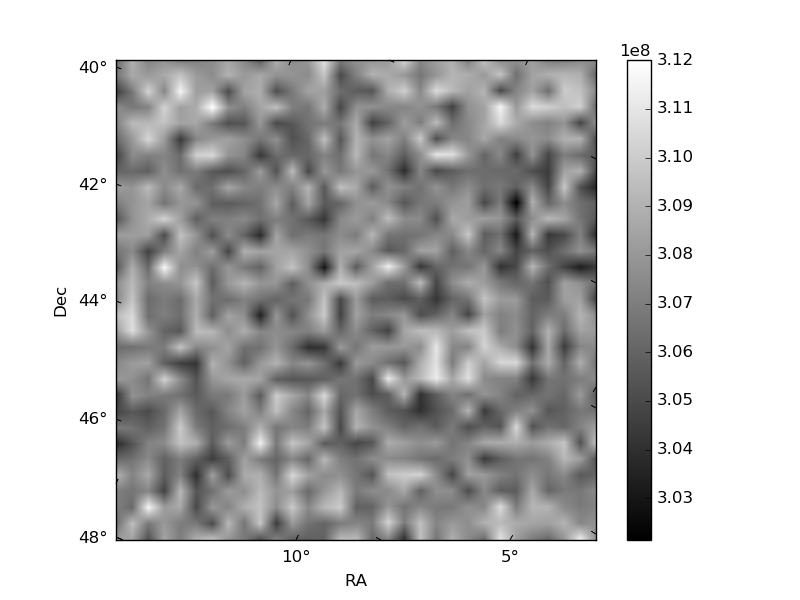
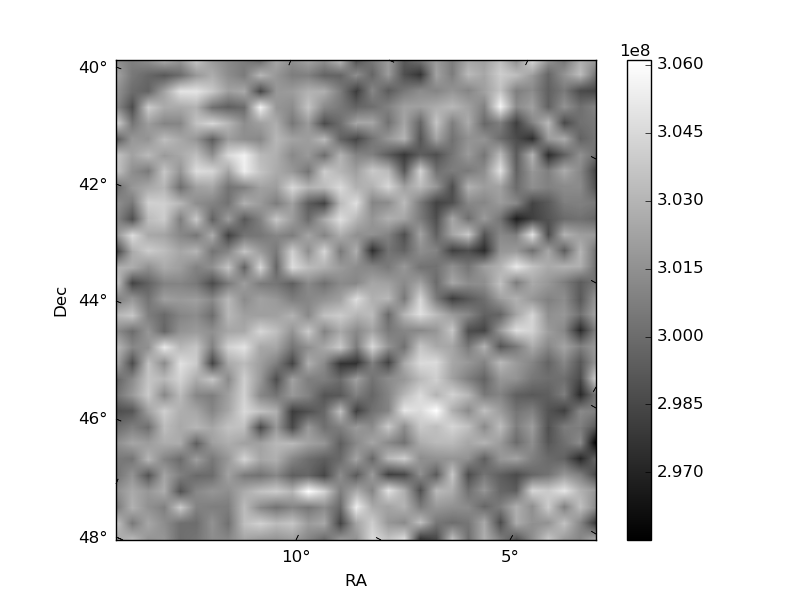
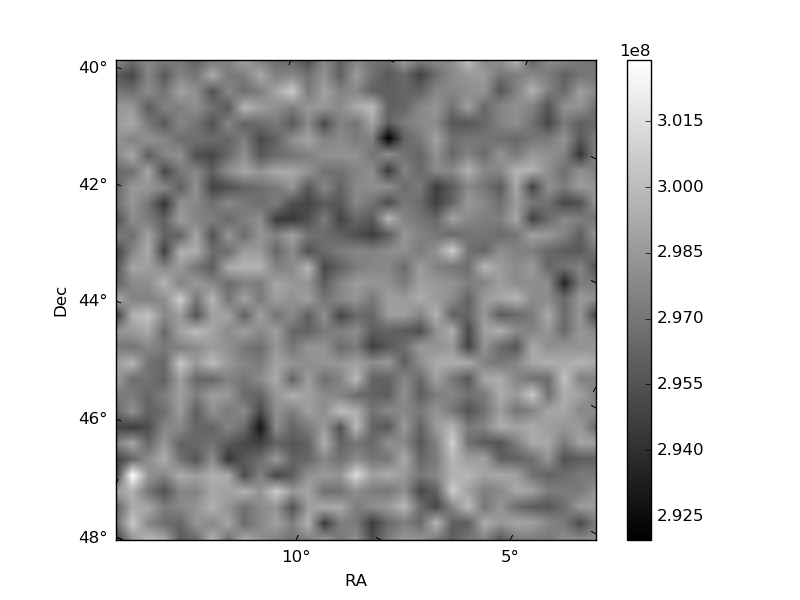
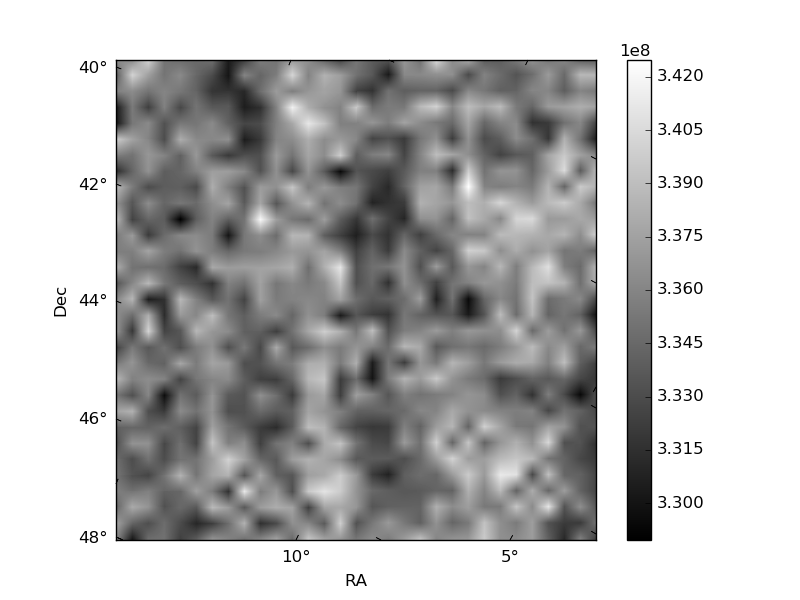
Histogram calculated using DETX and DETY for each event in the final _common_clean file
| Quadrant A | 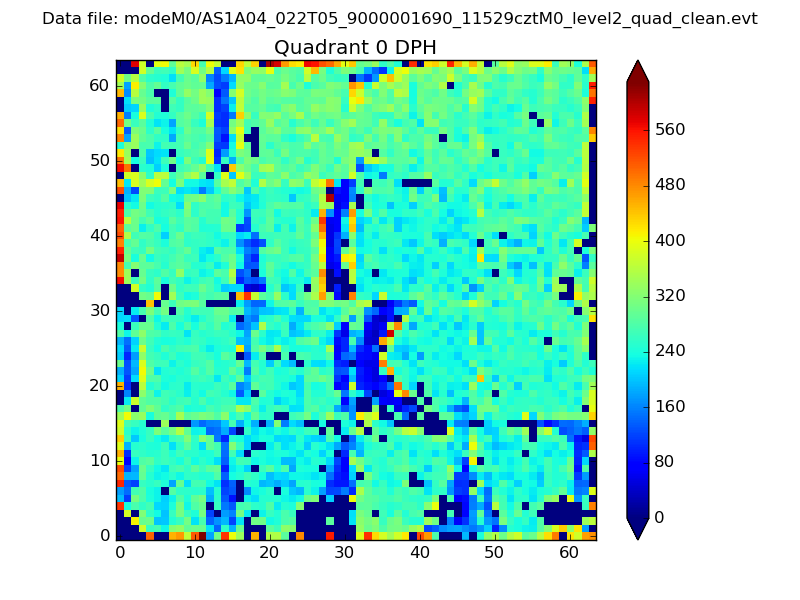 |
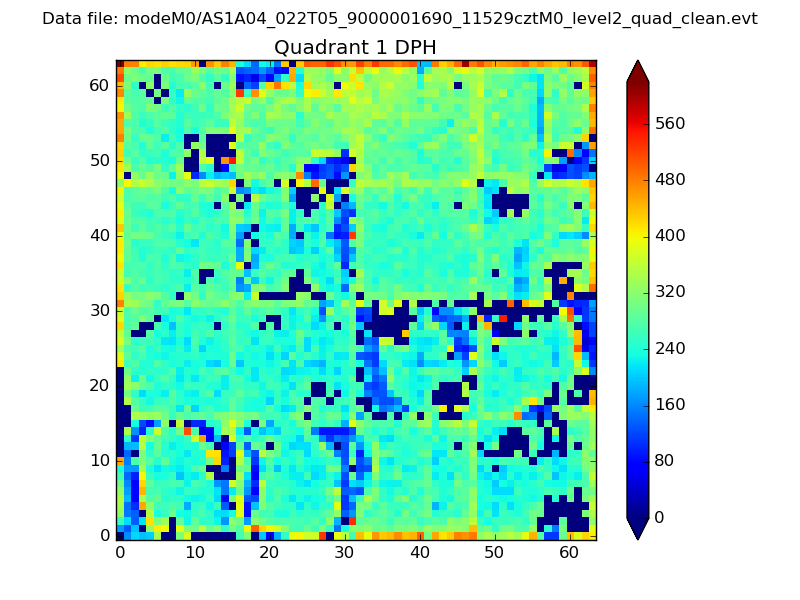 |
Quadrant B |
|---|---|---|---|
| Quadrant D | 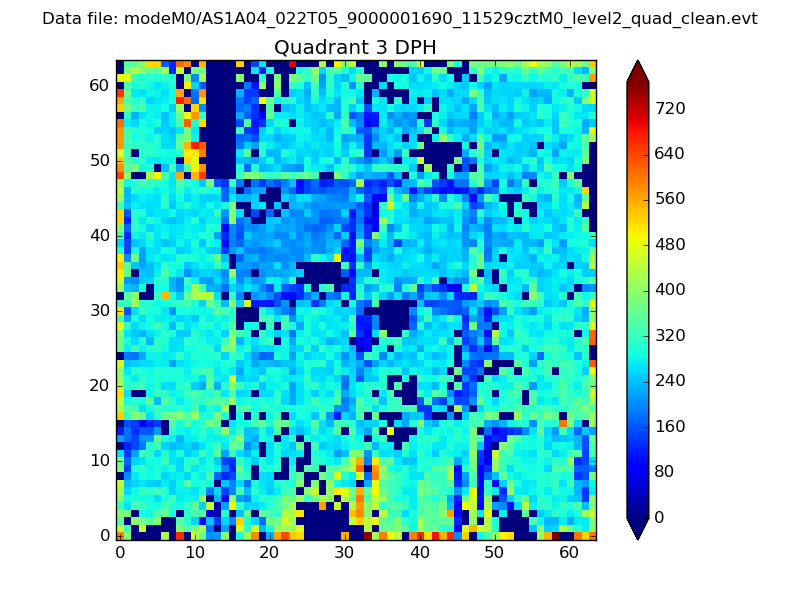 |
 |
Quadrant C |
| Plot type | Count rate plots | Images |
|---|---|---|
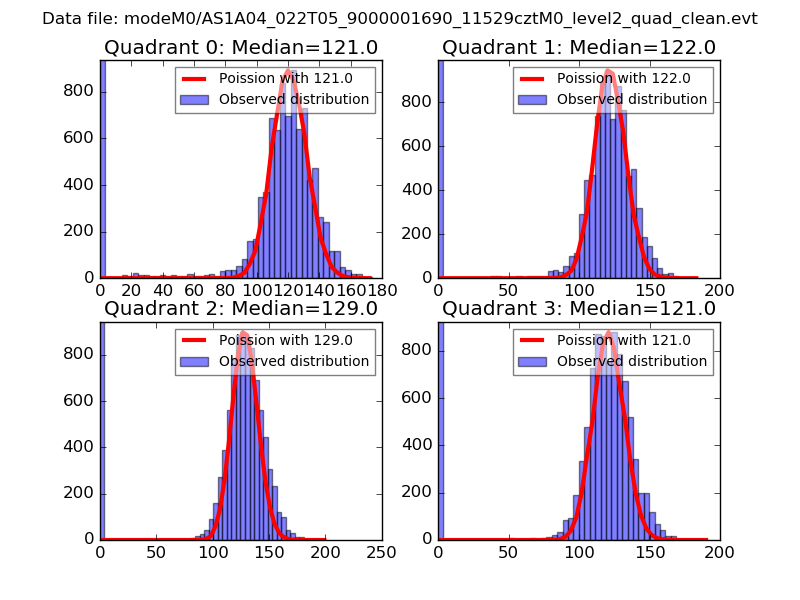
| Comparison with Poisson distribution Blue bars denote a histogram of data divided into 1 sec bins. Red curve is a Poisson curve with rate = median count rate of data. |
 |
 |
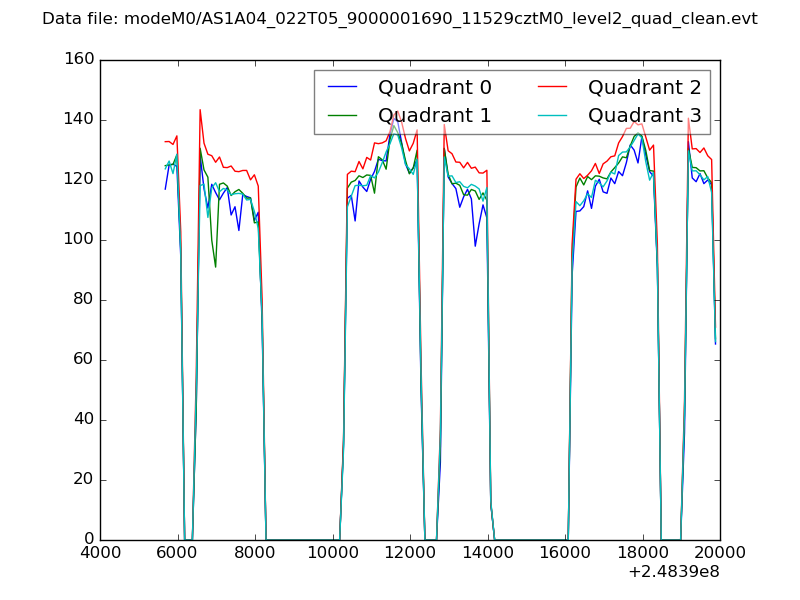
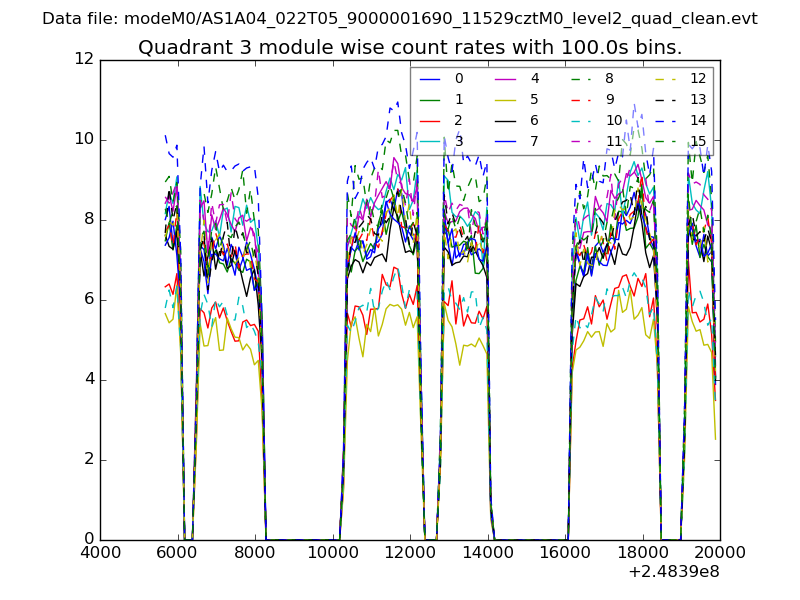
| Quadrant-wise count rates Data is divided into 100 sec bins |
 |
|
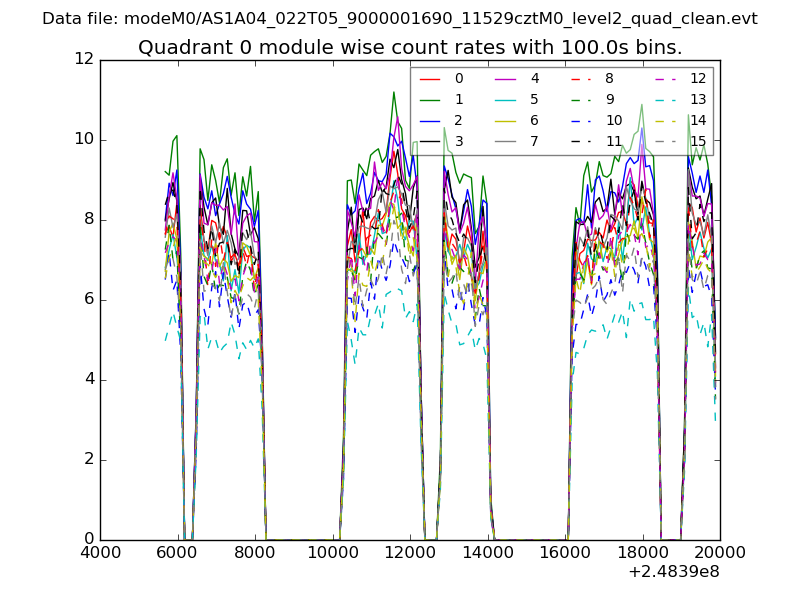
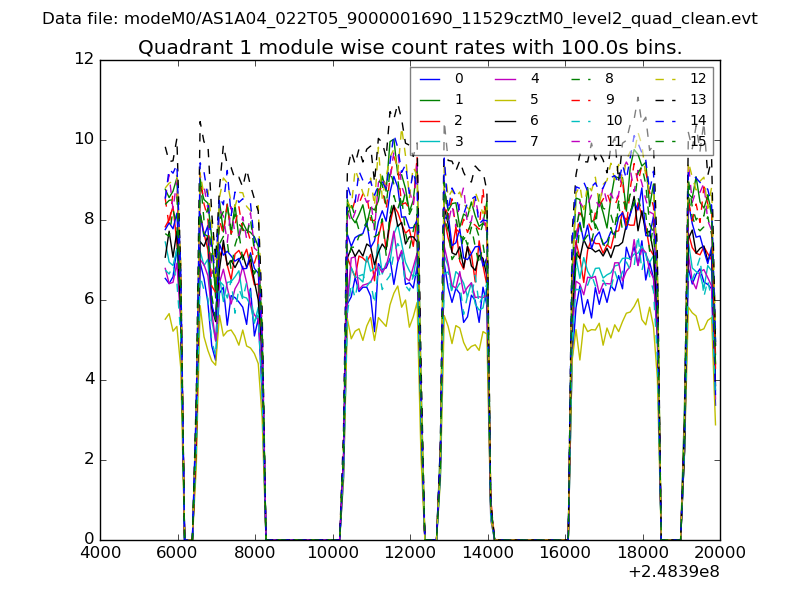
| Module-wise count rates for Quadrant A Data is divided into 100 sec bins |
 |
 |
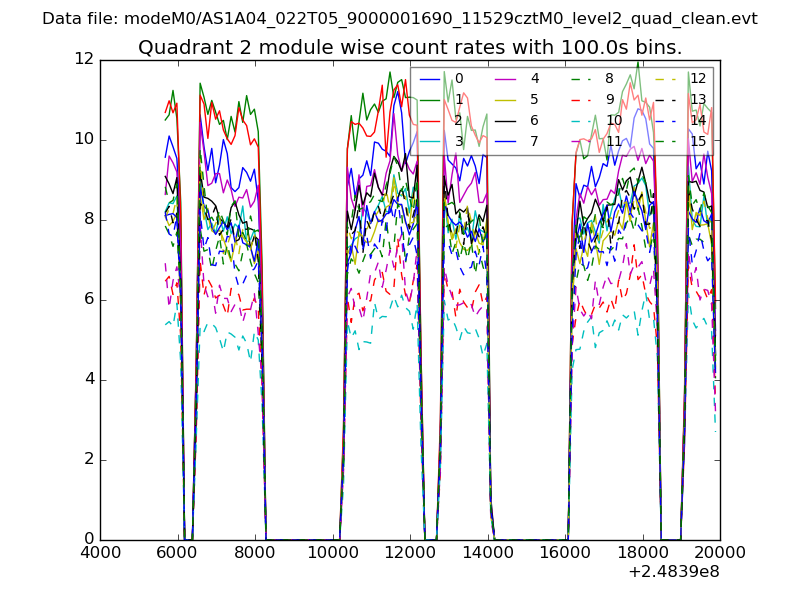
| Module-wise count rates for Quadrant B Data is divided into 100 sec bins |
 |
 |
| Module-wise count rates for Quadrant C Data is divided into 100 sec bins |
 |
 |
| Module-wise count rates for Quadrant D Data is divided into 100 sec bins |
 |
 |
| Parameter | Plot |
|---|---|
| CZT HV Monitor | 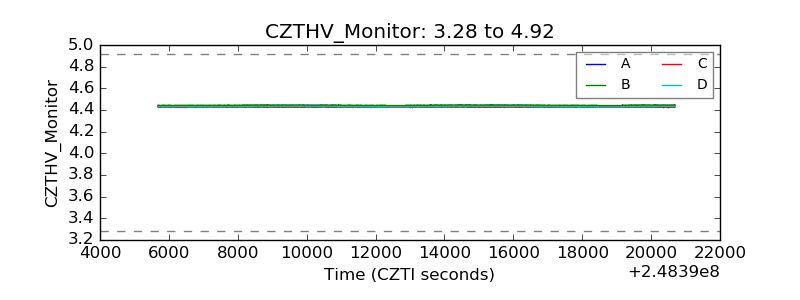 |
| D_VDD | 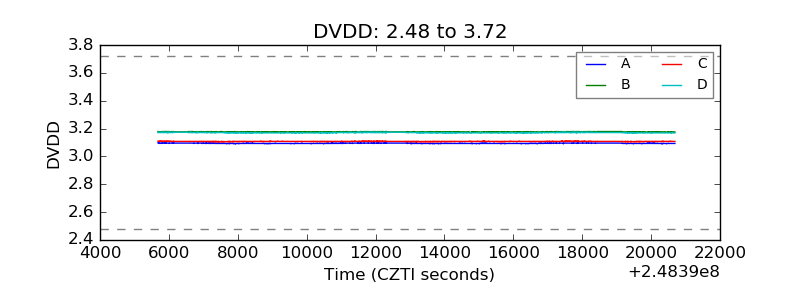 |
| Temperature 1 | 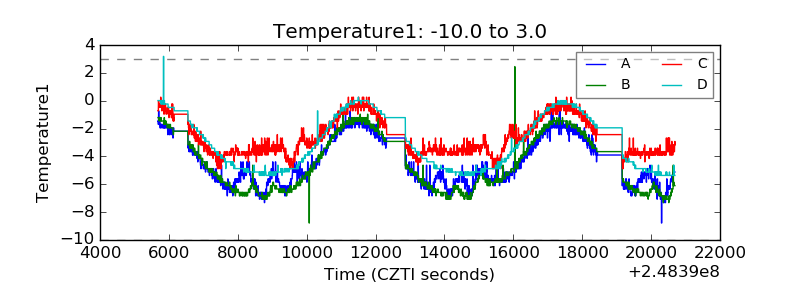 |
| Veto HV Monitor | 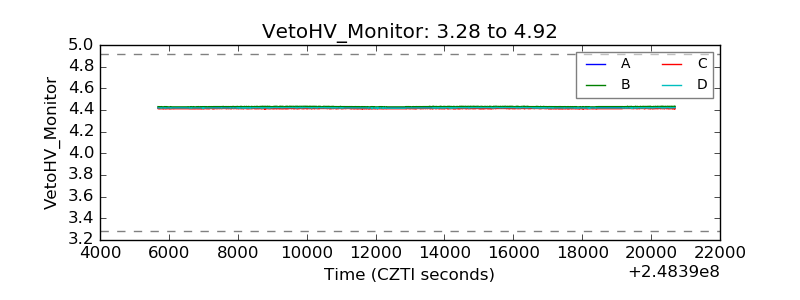 |
| Veto LLD | 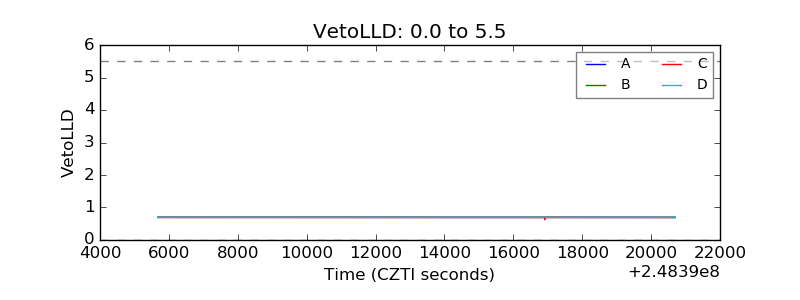 |
| Alpha Counter | 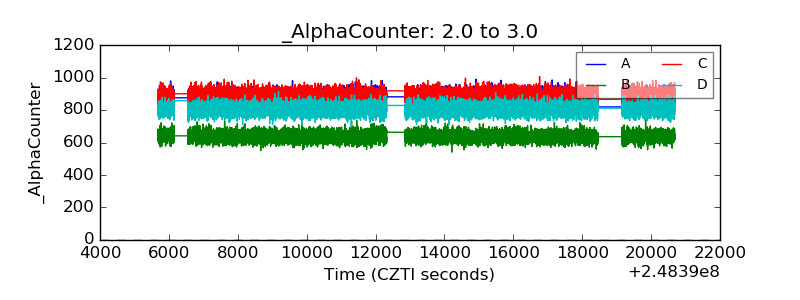 |
| _CPM_Rate | 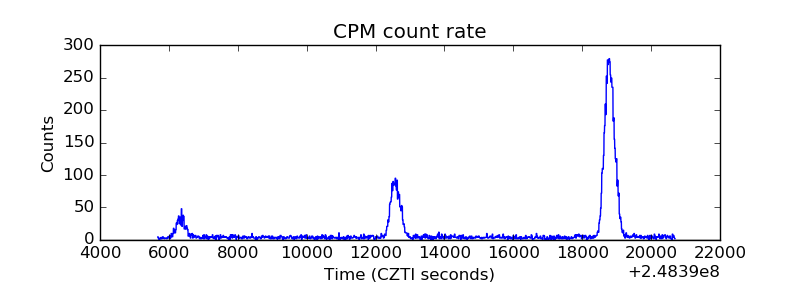 |
| CZT Counter | 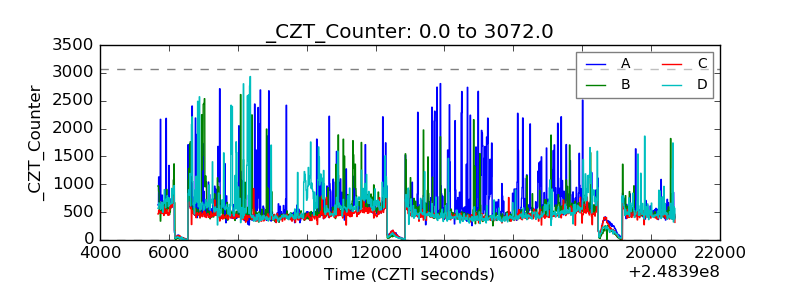 |
| +2.5 Volts monitor |  |
| +5 Volts monitor |  |
| _ROLL_ROT | 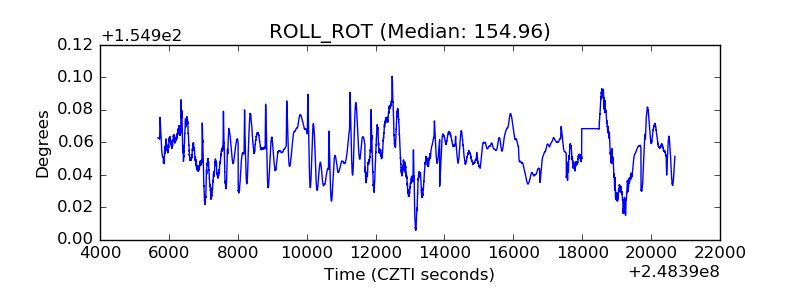 |
| _Roll_DEC | 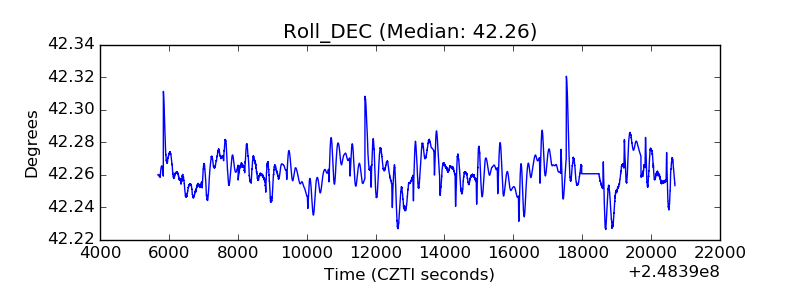 |
| _Roll_RA | 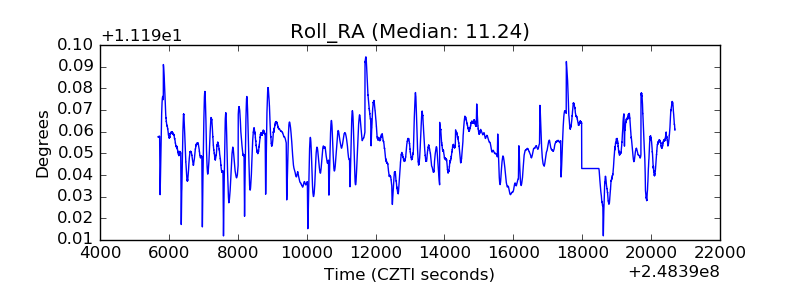 |
| Veto Counter | 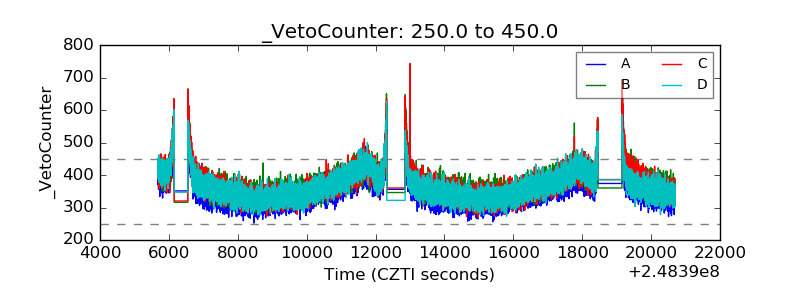 |