| Param | Original file | Final file |
|---|---|---|
| Filename | modeM0/AS1A04_022T05_9000001690_11530cztM0_level2.evt | modeM0/AS1A04_022T05_9000001690_11530cztM0_level2_quad_clean.evt |
| Size (bytes) | 585,950,400 | 91,177,920 |
| Size | 558.8 MB | 87.0 MB |
| Events in quadrant A | 5,079,302 | 541,474 |
| Events in quadrant B | 4,305,160 | 555,652 |
| Events in quadrant C | 3,455,596 | 586,823 |
| Events in quadrant D | 4,393,907 | 551,905 |
| Mode M9 | |||
|---|---|---|---|
| Quadrant | BADHDUFLAG | Total packets | Discarded packets |
| A | 0 | 15 | 0 |
| B | 0 | 15 | 0 |
| C | 0 | 15 | 0 |
| D | 0 | 15 | 0 |
| Mode M0 | |||
|---|---|---|---|
| Quadrant | BADHDUFLAG | Total packets | Discarded packets |
| A | 0 | 20022 | 3 |
| B | 0 | 17774 | 2 |
| C | 0 | 15343 | 2 |
| D | 0 | 18182 | 2 |
| Mode SS | |||
|---|---|---|---|
| Quadrant | BADHDUFLAG | Total packets | Discarded packets |
| A | 0 | 156 | 0 |
| B | 0 | 156 | 0 |
| C | 0 | 156 | 0 |
| D | 0 | 156 | 0 |
| Quadrant | Total seconds | Saturated seconds | Saturation percentage |
|---|---|---|---|
| A | 7543 | 346 | 4.587034% |
| B | 7543 | 171 | 2.267003% |
| C | 7543 | 36 | 0.477264% |
| D | 7543 | 117 | 1.551107% |
Noise dominated data is calculated using 1-second bins in cleaned event files. If a bin has >2000 counts, and if more than 50% of those come from <1% of pixels, then it is considered to be noise-dominated and hence unusable.
| Quadrant | # 1 sec bins | Bins with >0 counts | Bins with >2000 counts | High rate bins dominated by noise | Noise dominated (total time) | Noise dominated (detector-on time) | Marked lightcurve |
|---|---|---|---|---|---|---|---|
| A | 9084 | 7546 | 154 | 154 | 1.70% | 2.04% |  |
| B | 9084 | 7546 | 56 | 56 | 0.62% | 0.74% |  |
| C | 9084 | 7546 | 0 | 0 | 0.00% | 0.00% | 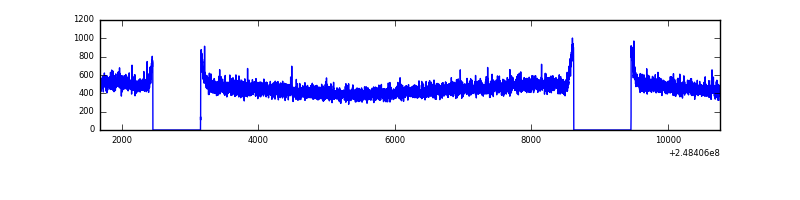 |
| D | 9084 | 7546 | 79 | 79 | 0.87% | 1.05% |  |
Top three noisy pixels from each quadrant. If the there are fewer than three noisy pixels in the level2.evt file, extra rows are filled as -1
| Pixel properties | Quadrant properties | ||||||
|---|---|---|---|---|---|---|---|
| Quadrant | DetID | PixID | Counts | Sigma | Mean | Median | Sigma |
| A | 8 | 5 | 1415318 | 7799.79 | 880 | 859 | 181.3 |
| A | 9 | 143 | 133339 | 730.54 | 880 | 859 | 181.3 |
| A | 1 | 162 | 45944 | 248.61 | 880 | 859 | 181.3 |
| B | 4 | 239 | 479796 | 2796.85 | 893 | 870 | 171.2 |
| B | 15 | 204 | 187140 | 1087.78 | 893 | 870 | 171.2 |
| B | 0 | 229 | 30334 | 172.06 | 893 | 870 | 171.2 |
| C | 14 | 67 | 10615 | 46.89 | 884 | 889 | 207.4 |
| C | 13 | 61 | 6469 | 26.9 | 884 | 889 | 207.4 |
| C | 3 | 202 | 2200 | 6.32 | 884 | 889 | 207.4 |
| D | 1 | 52 | 497679 | 2362.69 | 871 | 846 | 210.3 |
| D | 13 | 104 | 117460 | 554.56 | 871 | 846 | 210.3 |
| D | 5 | 222 | 96684 | 455.76 | 871 | 846 | 210.3 |
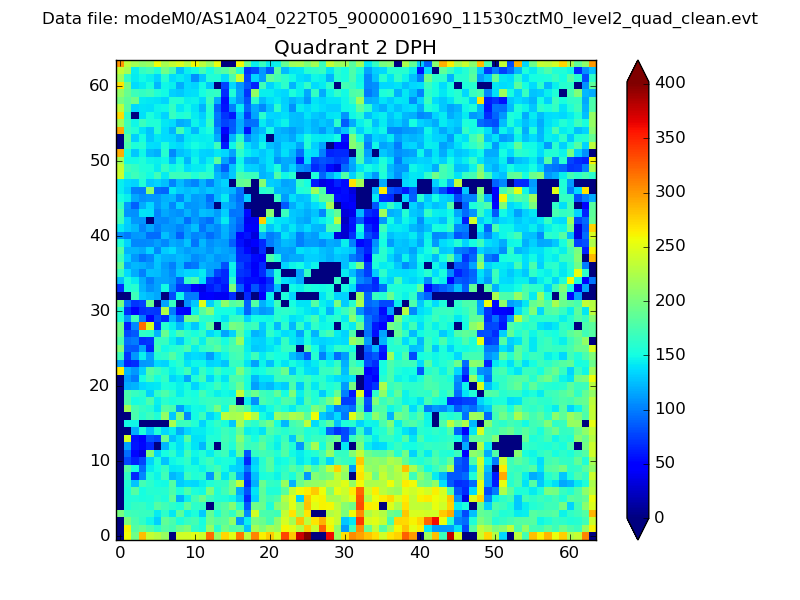
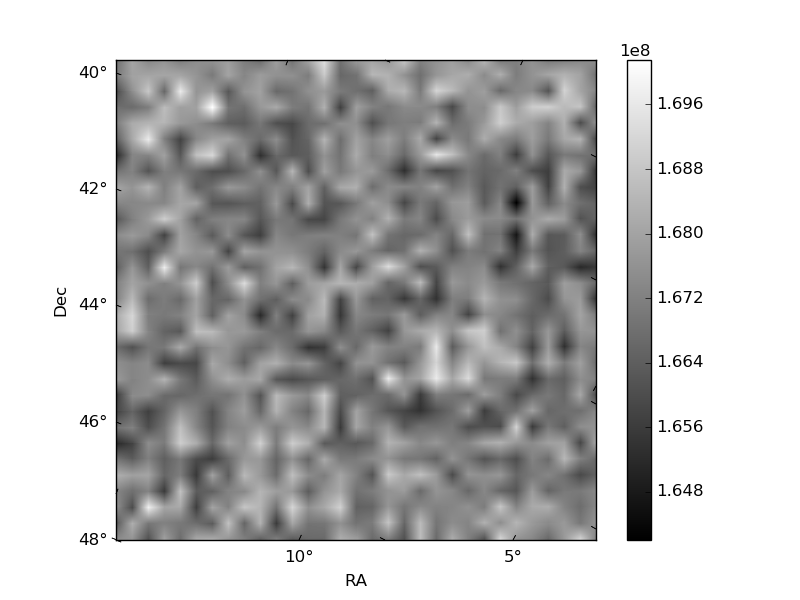
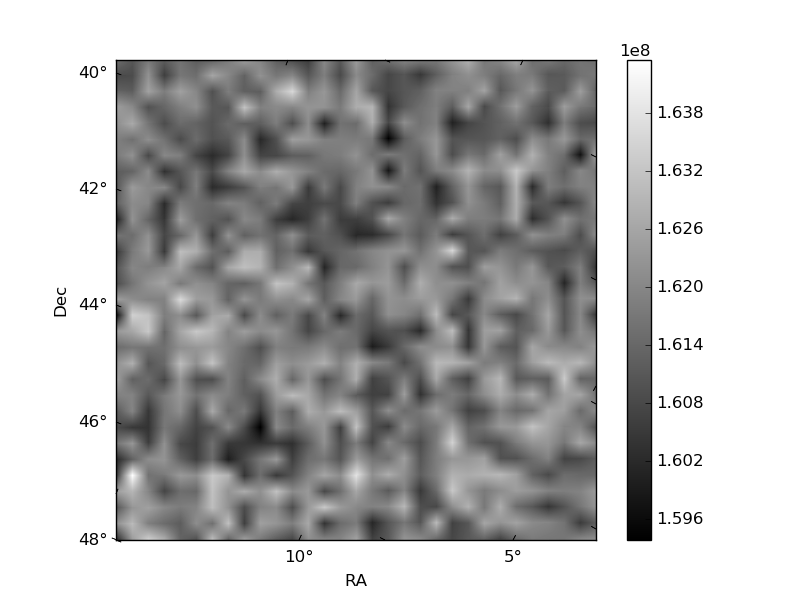
Histogram calculated using DETX and DETY for each event in the final _common_clean file
| Quadrant A | 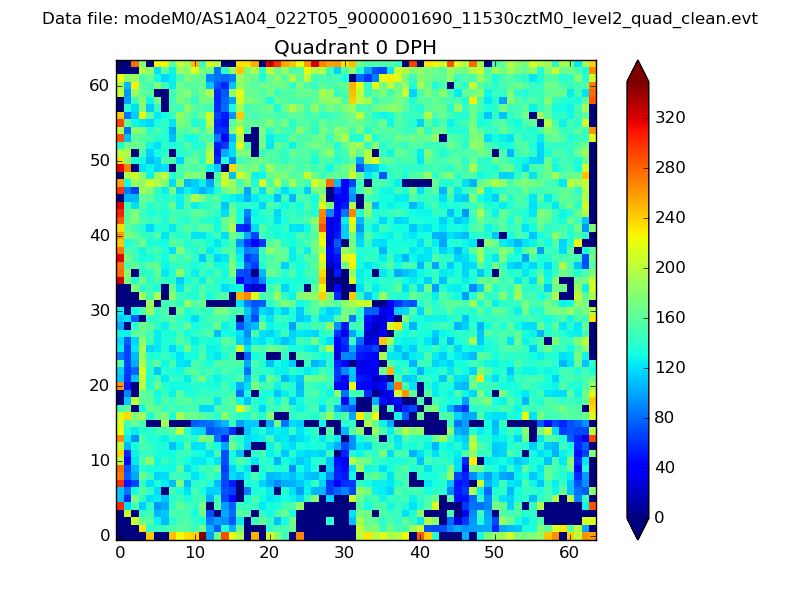 |
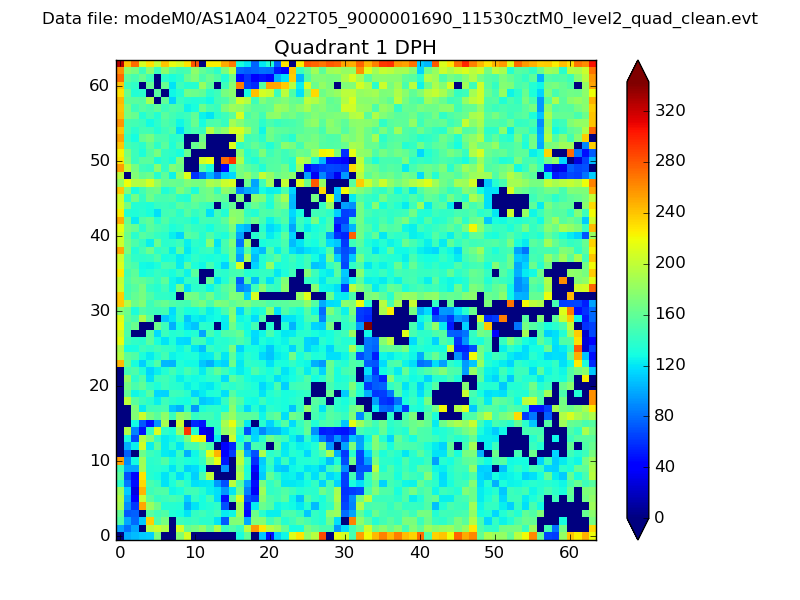 |
Quadrant B |
|---|---|---|---|
| Quadrant D | 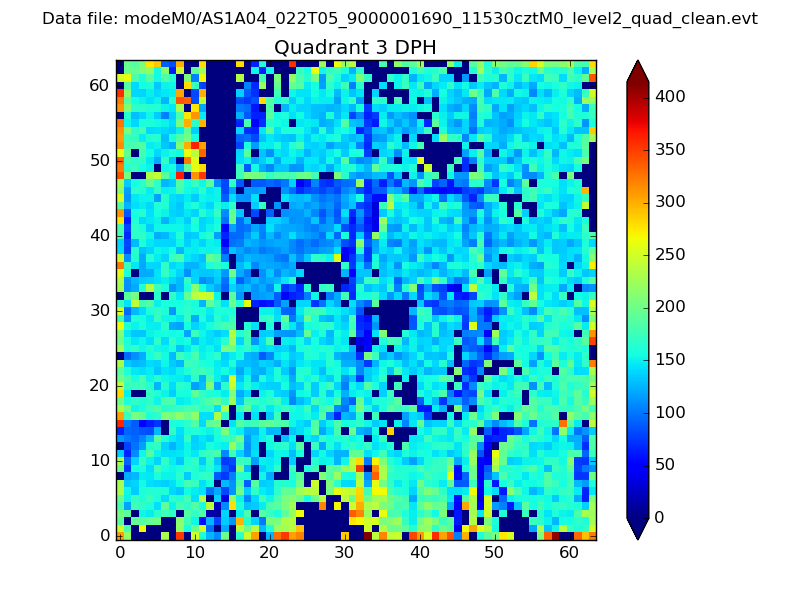 |
 |
Quadrant C |
| Plot type | Count rate plots | Images |
|---|---|---|
| Comparison with Poisson distribution Blue bars denote a histogram of data divided into 1 sec bins. Red curve is a Poisson curve with rate = median count rate of data. |
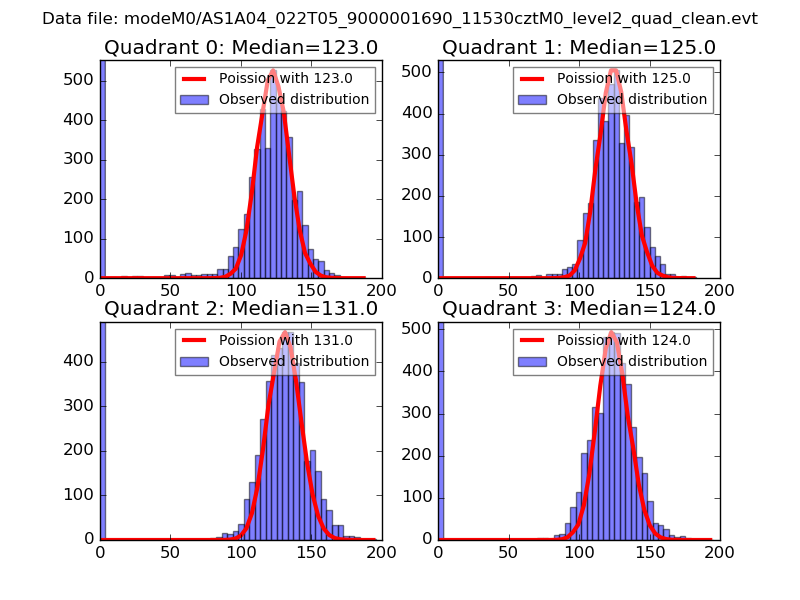 |
 |
| Quadrant-wise count rates Data is divided into 100 sec bins |
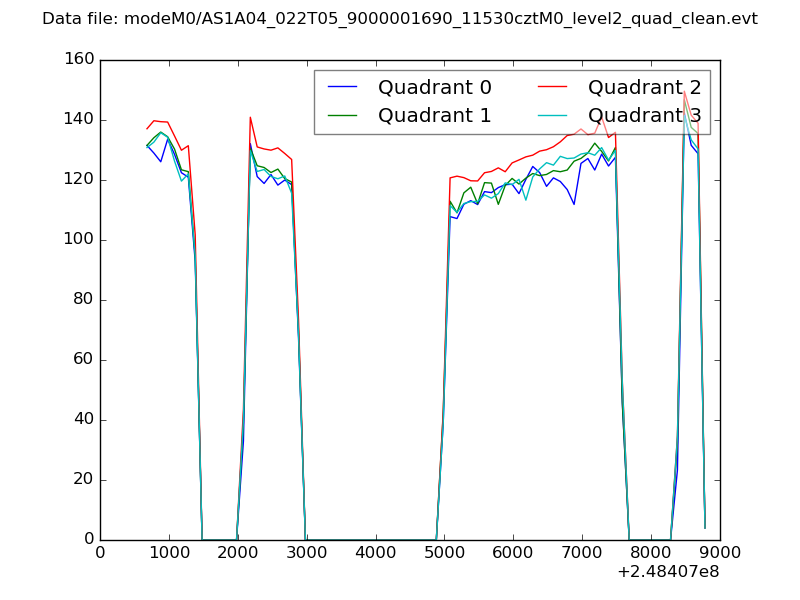 |
|
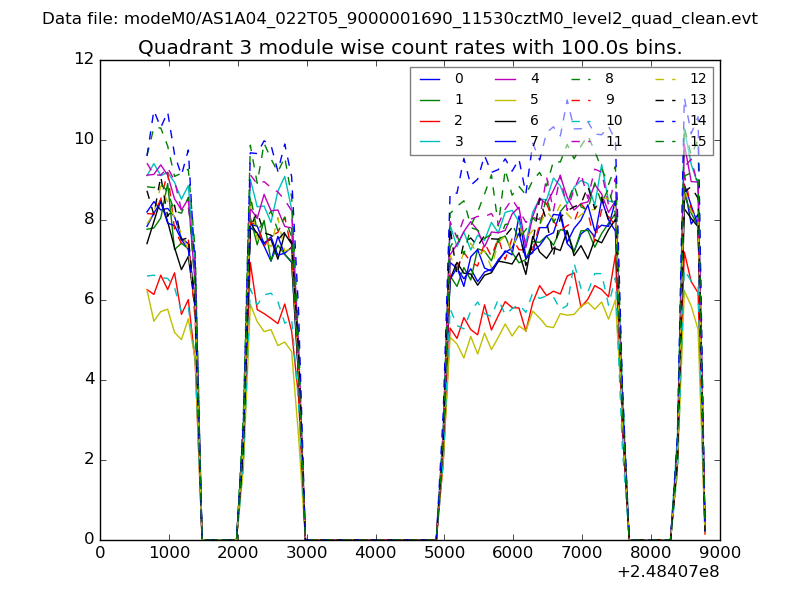
| Module-wise count rates for Quadrant A Data is divided into 100 sec bins |
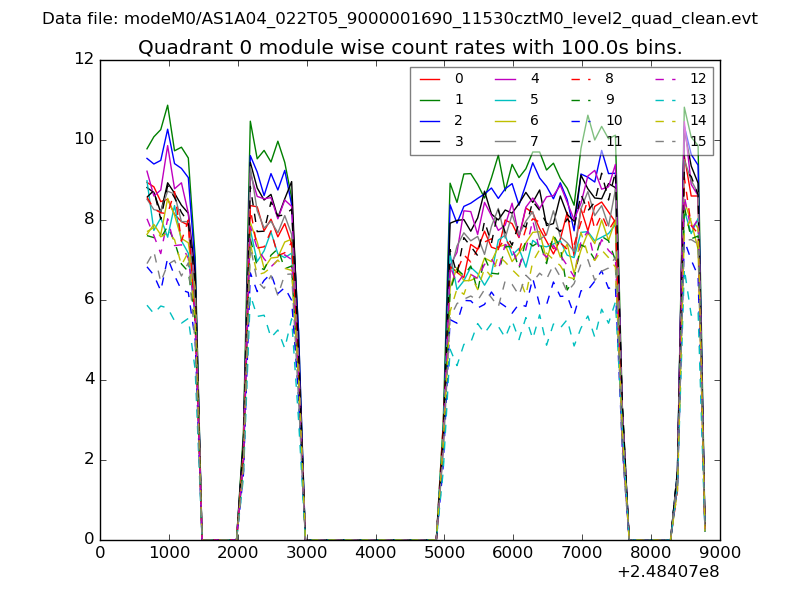 |
 |
| Module-wise count rates for Quadrant B Data is divided into 100 sec bins |
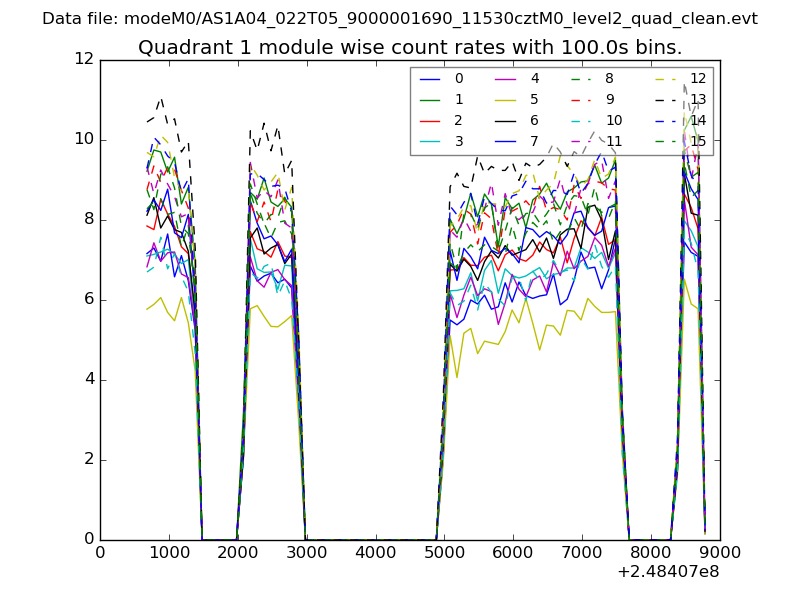 |
 |
| Module-wise count rates for Quadrant C Data is divided into 100 sec bins |
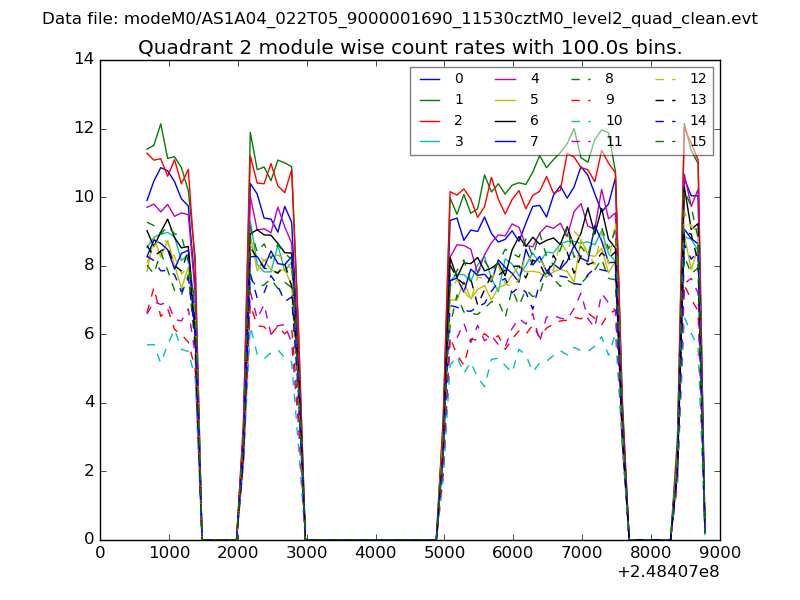 |
 |
| Module-wise count rates for Quadrant D Data is divided into 100 sec bins |
 |
 |
| Parameter | Plot |
|---|---|
| CZT HV Monitor | 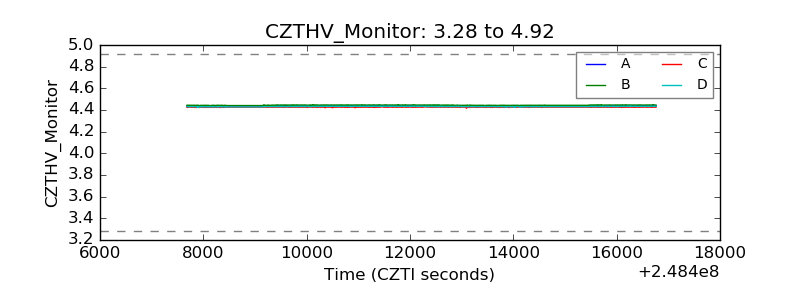 |
| D_VDD | 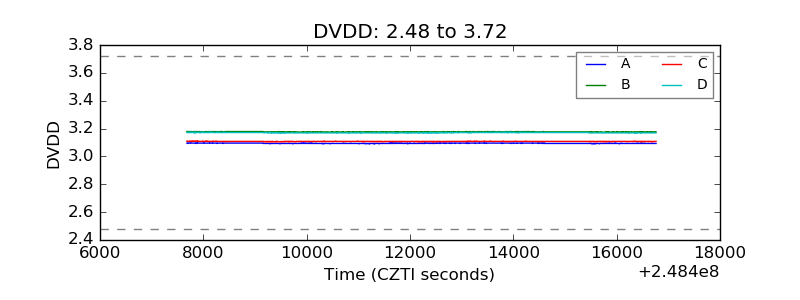 |
| Temperature 1 | 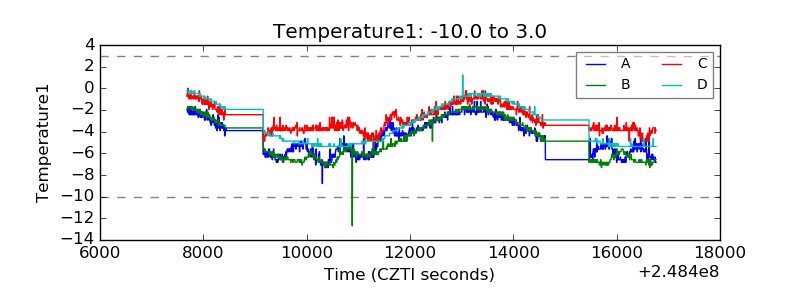 |
| Veto HV Monitor | 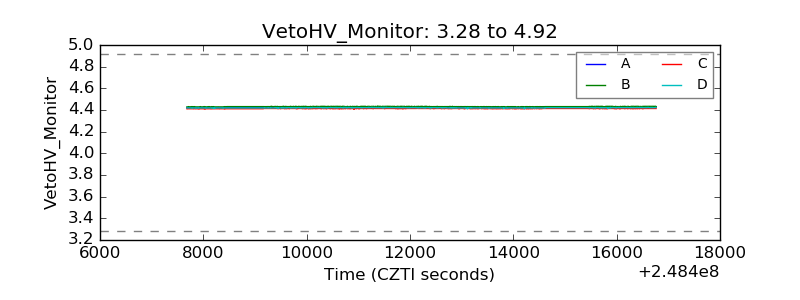 |
| Veto LLD | 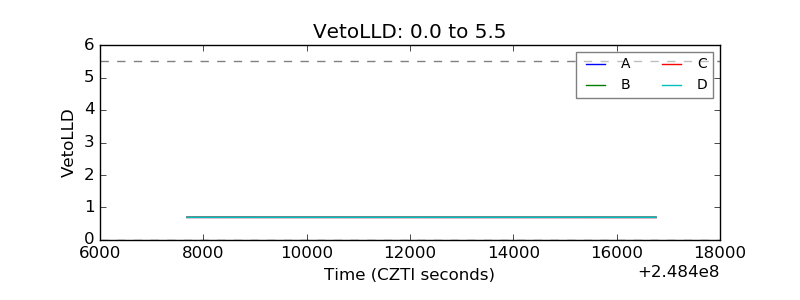 |
| Alpha Counter | 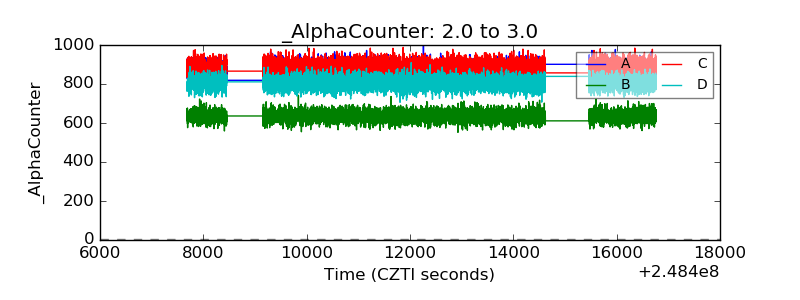 |
| _CPM_Rate | 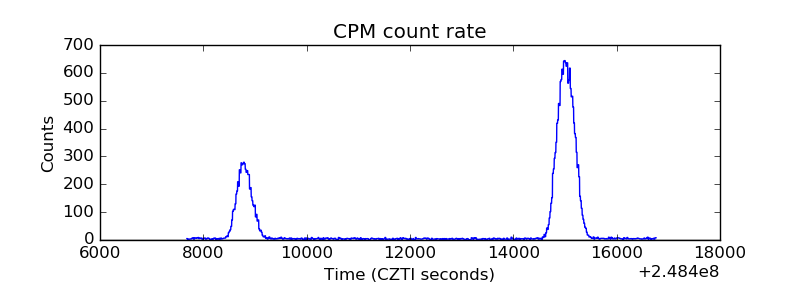 |
| CZT Counter | 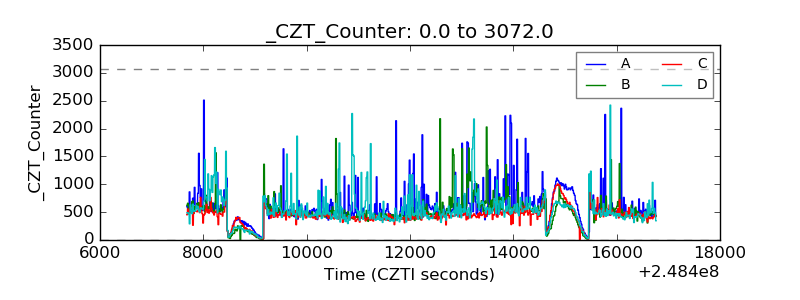 |
| +2.5 Volts monitor |  |
| +5 Volts monitor |  |
| _ROLL_ROT | 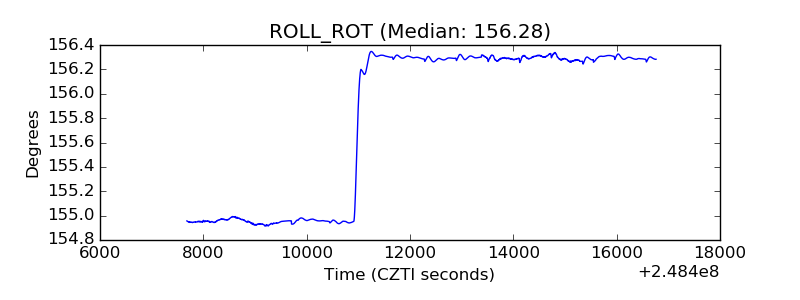 |
| _Roll_DEC | 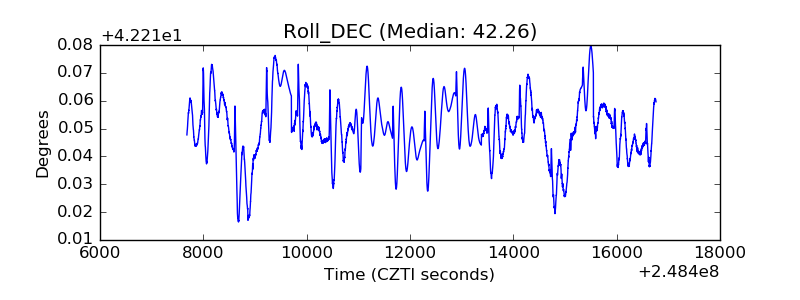 |
| _Roll_RA | 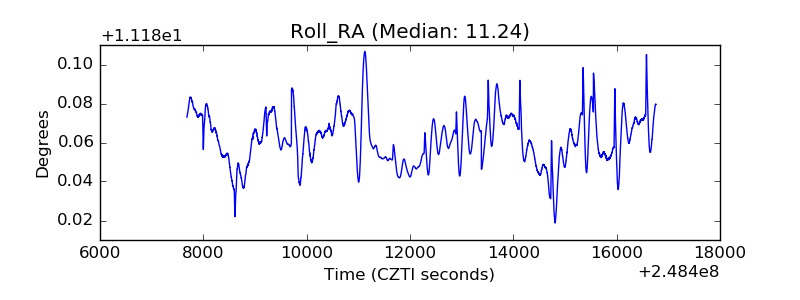 |
| Veto Counter | 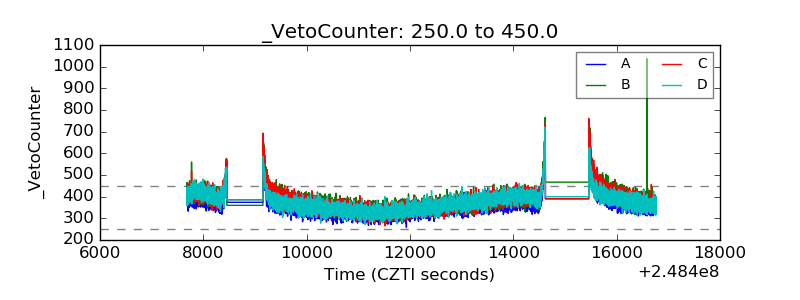 |