| Param | Original file | Final file |
|---|---|---|
| Filename | modeM0/AS1A04_022T05_9000001690_11531cztM0_level2.evt | modeM0/AS1A04_022T05_9000001690_11531cztM0_level2_quad_clean.evt |
| Size (bytes) | 539,735,040 | 69,350,400 |
| Size | 514.7 MB | 66.1 MB |
| Events in quadrant A | 4,631,934 | 395,775 |
| Events in quadrant B | 3,824,820 | 403,558 |
| Events in quadrant C | 3,139,691 | 427,231 |
| Events in quadrant D | 4,288,576 | 399,280 |
| Mode M9 | |||
|---|---|---|---|
| Quadrant | BADHDUFLAG | Total packets | Discarded packets |
| A | 0 | 18 | 0 |
| B | 0 | 18 | 0 |
| C | 0 | 18 | 0 |
| D | 0 | 18 | 0 |
| Mode M0 | |||
|---|---|---|---|
| Quadrant | BADHDUFLAG | Total packets | Discarded packets |
| A | 0 | 18231 | 3 |
| B | 0 | 15654 | 2 |
| C | 0 | 13924 | 2 |
| D | 0 | 17572 | 2 |
| Mode SS | |||
|---|---|---|---|
| Quadrant | BADHDUFLAG | Total packets | Discarded packets |
| A | 0 | 140 | 0 |
| B | 0 | 140 | 0 |
| C | 0 | 140 | 0 |
| D | 0 | 140 | 0 |
| Quadrant | Total seconds | Saturated seconds | Saturation percentage |
|---|---|---|---|
| A | 6797 | 331 | 4.869795% |
| B | 6797 | 191 | 2.810063% |
| C | 6797 | 58 | 0.853318% |
| D | 6797 | 105 | 1.544799% |
Noise dominated data is calculated using 1-second bins in cleaned event files. If a bin has >2000 counts, and if more than 50% of those come from <1% of pixels, then it is considered to be noise-dominated and hence unusable.
| Quadrant | # 1 sec bins | Bins with >0 counts | Bins with >2000 counts | High rate bins dominated by noise | Noise dominated (total time) | Noise dominated (detector-on time) | Marked lightcurve |
|---|---|---|---|---|---|---|---|
| A | 8638 | 6800 | 158 | 158 | 1.83% | 2.32% | 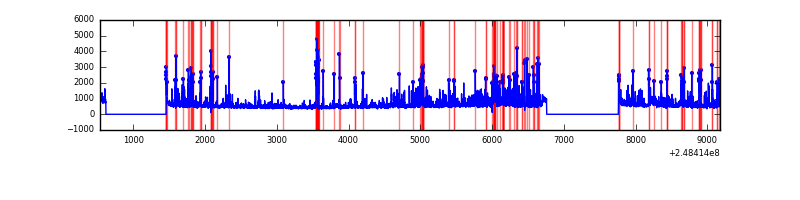 |
| B | 8638 | 6800 | 51 | 51 | 0.59% | 0.75% | 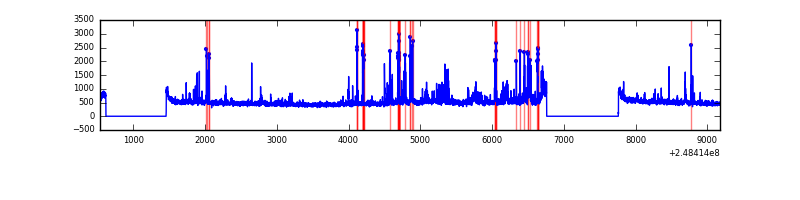 |
| C | 8638 | 6800 | 0 | 0 | 0.00% | 0.00% | 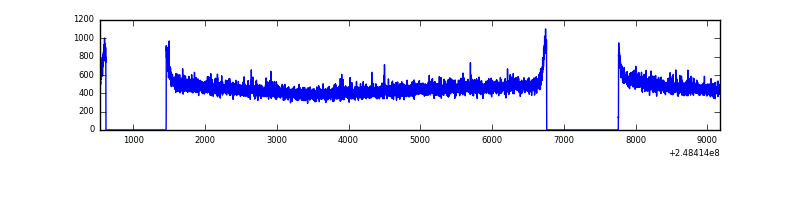 |
| D | 8638 | 6800 | 40 | 40 | 0.46% | 0.59% | 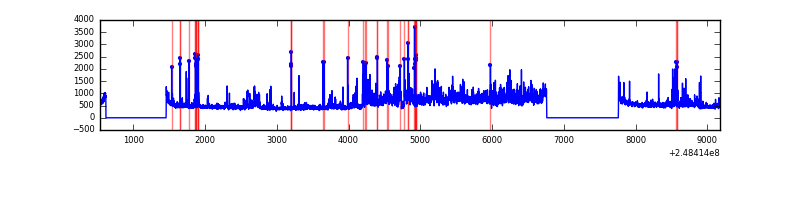 |
Top three noisy pixels from each quadrant. If the there are fewer than three noisy pixels in the level2.evt file, extra rows are filled as -1
| Pixel properties | Quadrant properties | ||||||
|---|---|---|---|---|---|---|---|
| Quadrant | DetID | PixID | Counts | Sigma | Mean | Median | Sigma |
| A | 8 | 5 | 1357853 | 8210.74 | 804 | 785 | 165.3 |
| A | 9 | 143 | 53095 | 316.49 | 804 | 785 | 165.3 |
| A | 1 | 162 | 41491 | 246.29 | 804 | 785 | 165.3 |
| B | 4 | 239 | 469280 | 2987.97 | 818 | 797 | 156.8 |
| B | 15 | 204 | 91185 | 576.49 | 818 | 797 | 156.8 |
| B | 12 | 111 | 18045 | 110.0 | 818 | 797 | 156.8 |
| C | 13 | 61 | 5854 | 27.03 | 803 | 810 | 186.6 |
| C | 7 | 236 | 4335 | 18.89 | 803 | 810 | 186.6 |
| C | 14 | 67 | 2991 | 11.69 | 803 | 810 | 186.6 |
| D | 5 | 222 | 726158 | 3798.49 | 792 | 771 | 191.0 |
| D | 1 | 52 | 176089 | 918.05 | 792 | 771 | 191.0 |
| D | 13 | 122 | 125638 | 653.87 | 792 | 771 | 191.0 |
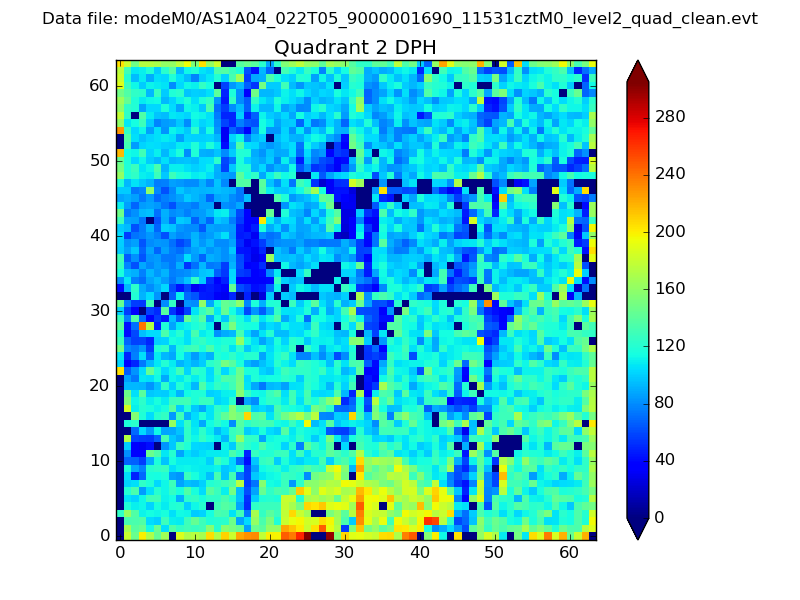
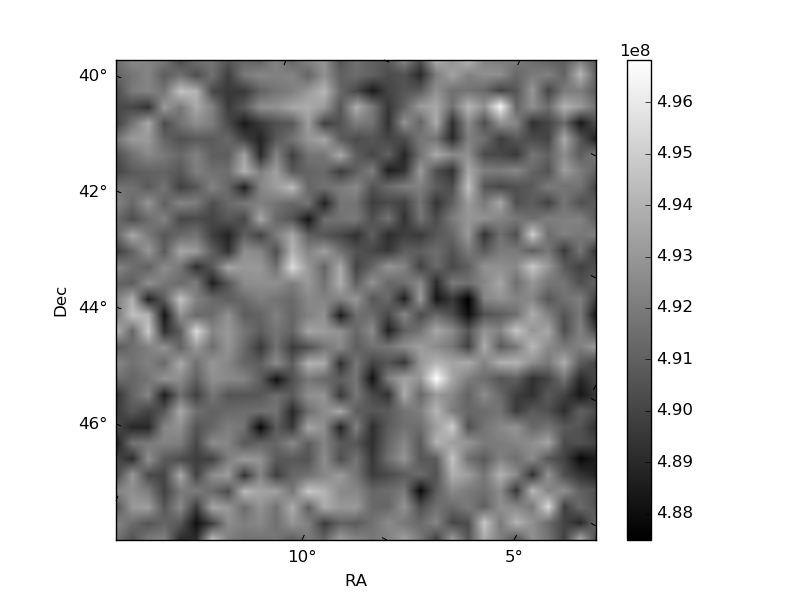
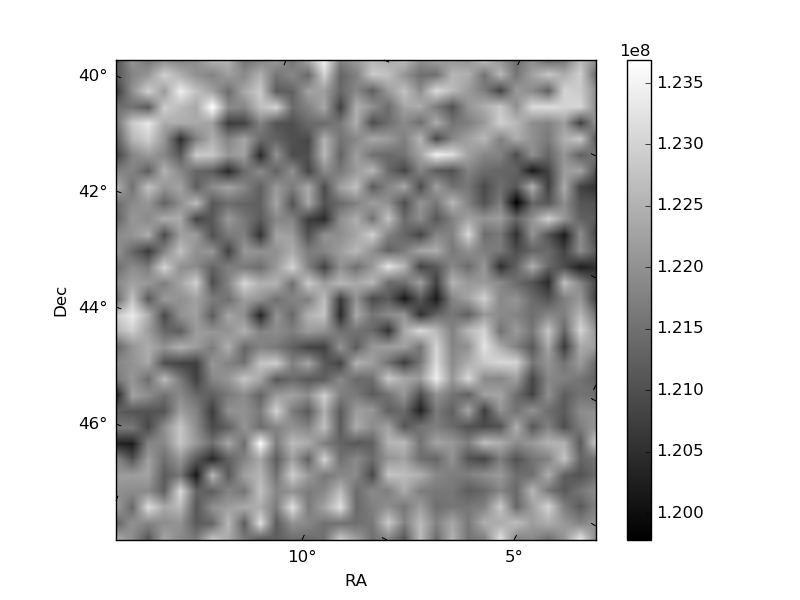
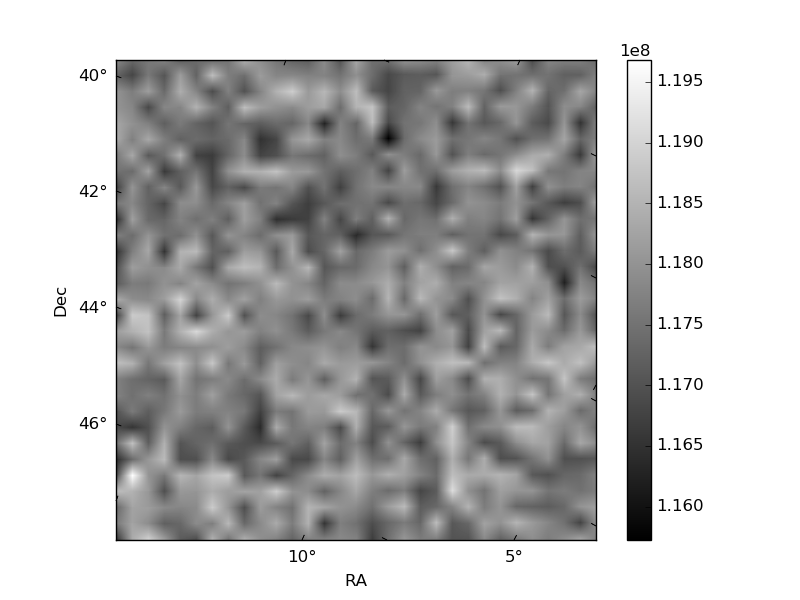
Histogram calculated using DETX and DETY for each event in the final _common_clean file
| Quadrant A | 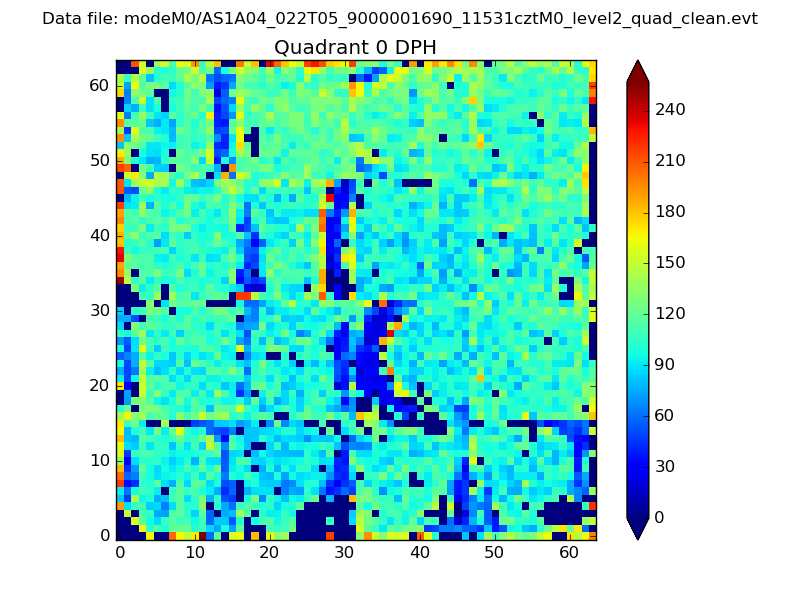 |
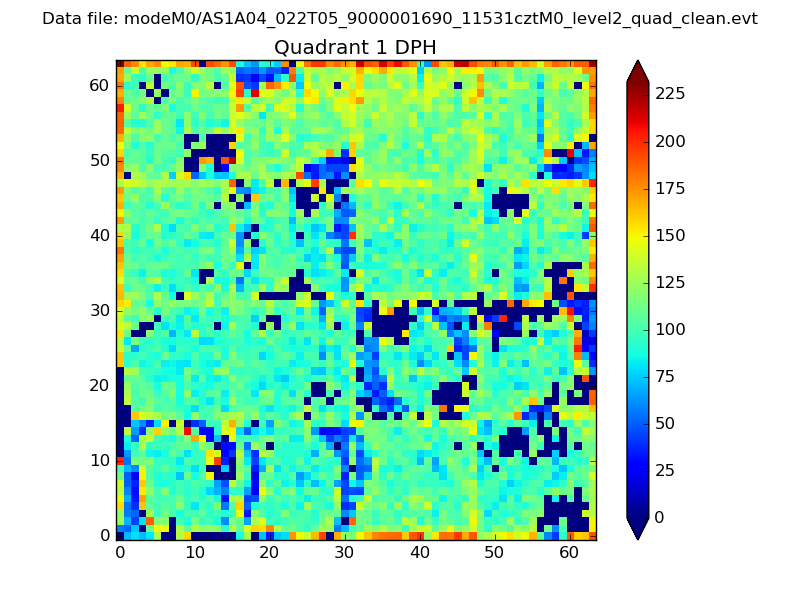 |
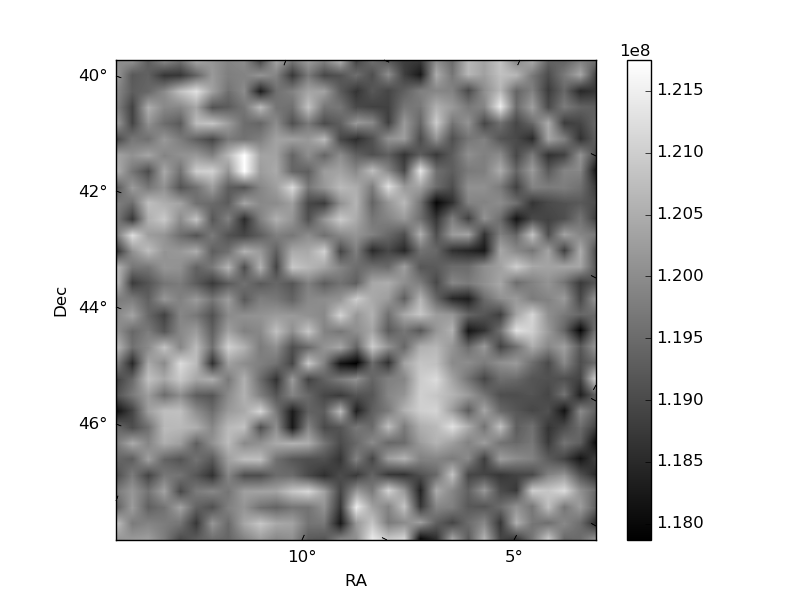
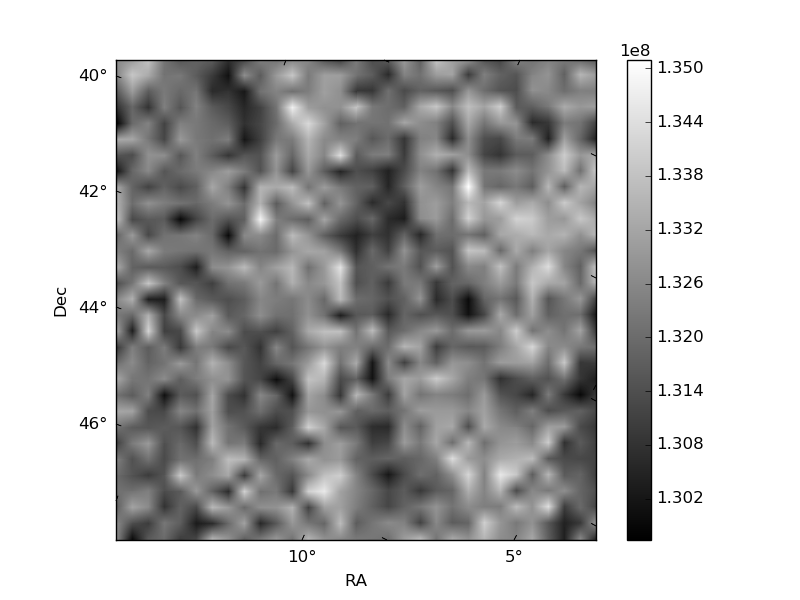
Quadrant B |
|---|---|---|---|
| Quadrant D | 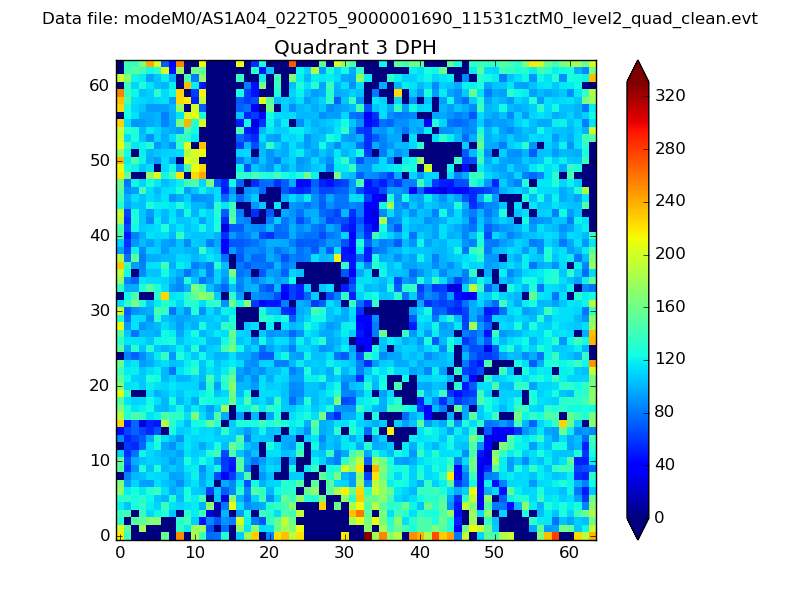 |
 |
Quadrant C |
| Plot type | Count rate plots | Images |
|---|---|---|
| Comparison with Poisson distribution Blue bars denote a histogram of data divided into 1 sec bins. Red curve is a Poisson curve with rate = median count rate of data. |
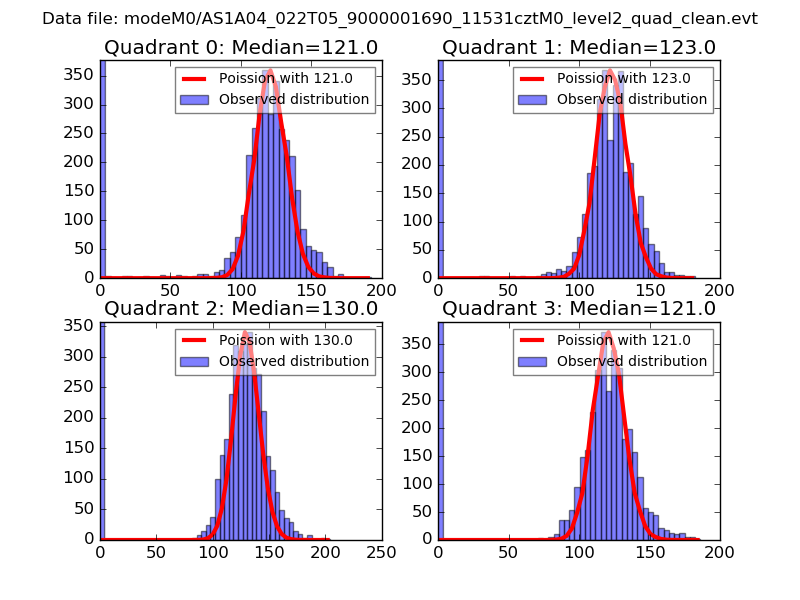 |
 |
| Quadrant-wise count rates Data is divided into 100 sec bins |
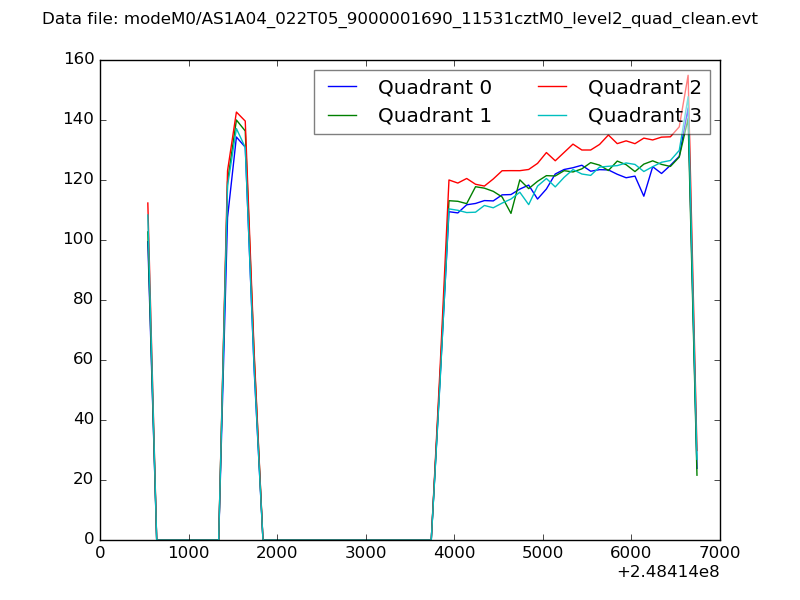 |
|
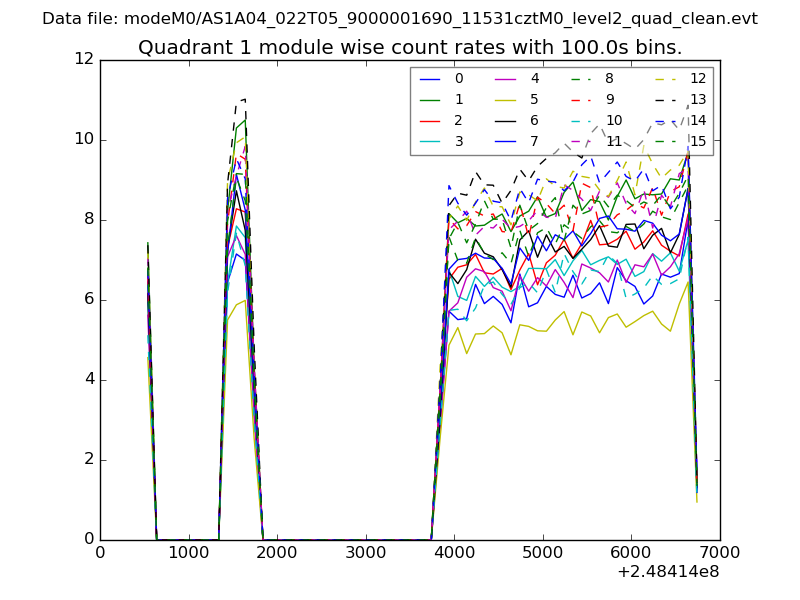
| Module-wise count rates for Quadrant A Data is divided into 100 sec bins |
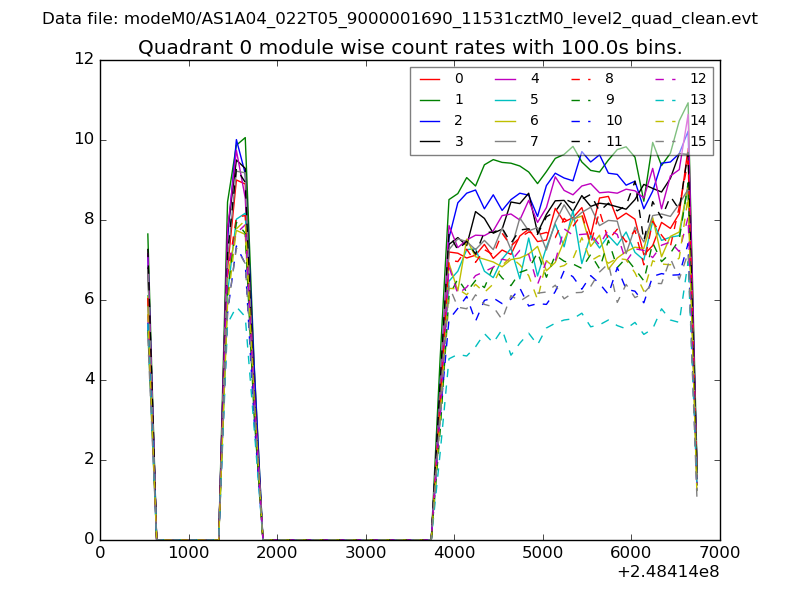 |
 |
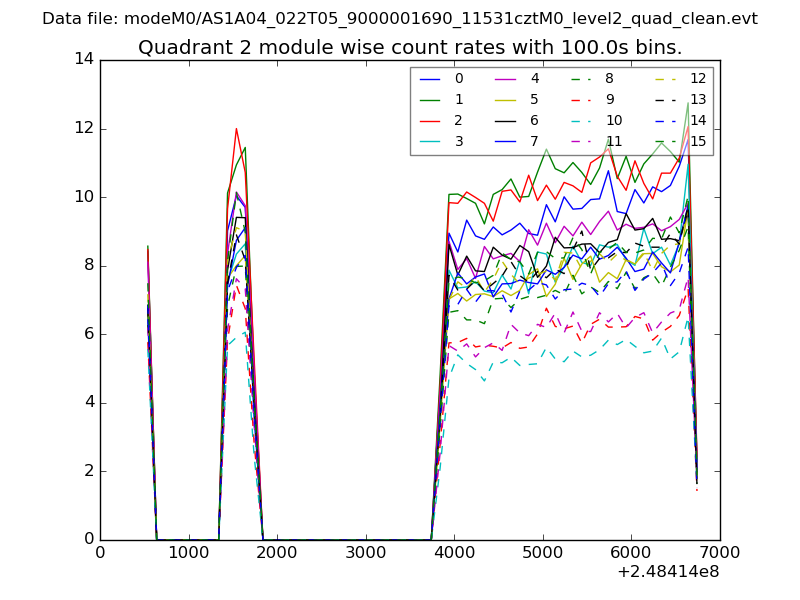
| Module-wise count rates for Quadrant B Data is divided into 100 sec bins |
 |
 |
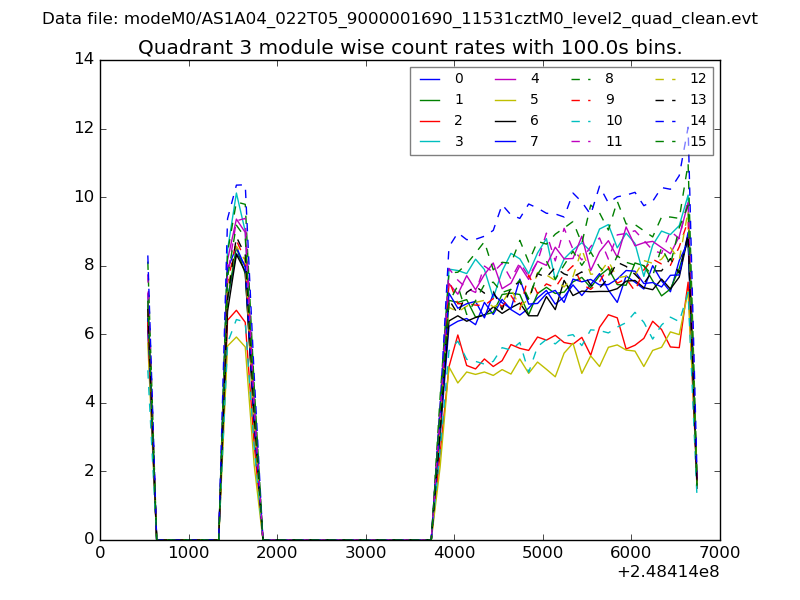
| Module-wise count rates for Quadrant C Data is divided into 100 sec bins |
 |
 |
| Module-wise count rates for Quadrant D Data is divided into 100 sec bins |
 |
 |
| Parameter | Plot |
|---|---|
| CZT HV Monitor | 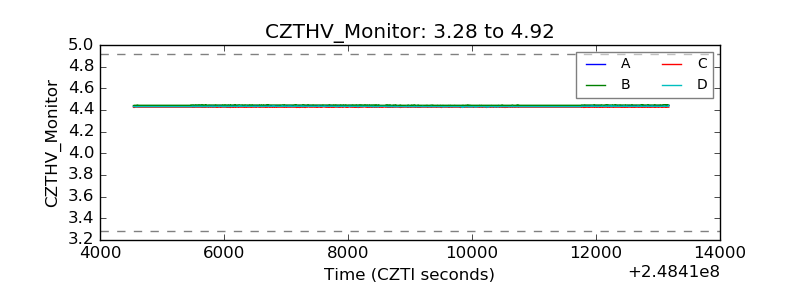 |
| D_VDD | 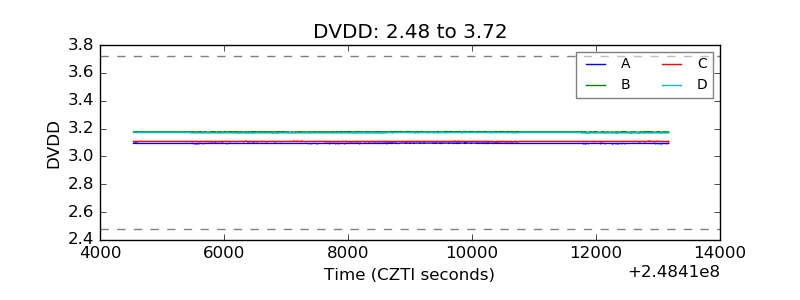 |
| Temperature 1 | 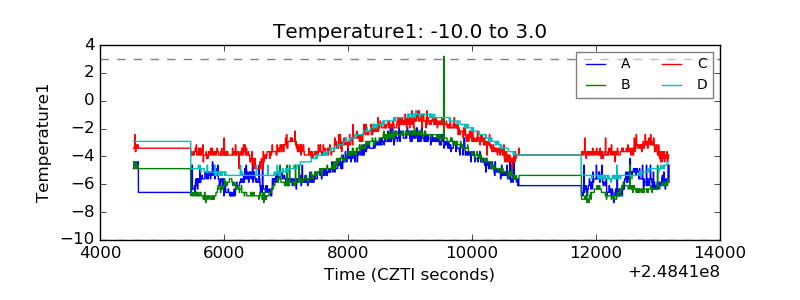 |
| Veto HV Monitor | 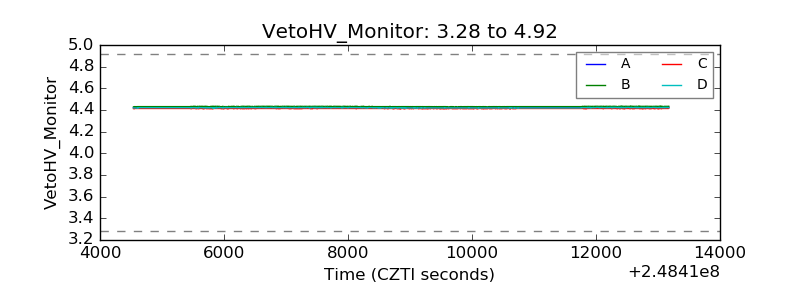 |
| Veto LLD | 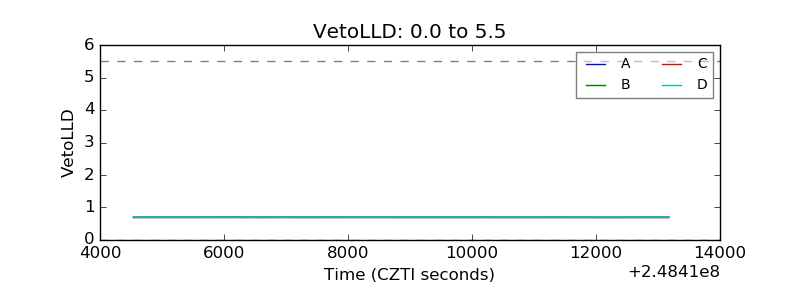 |
| Alpha Counter | 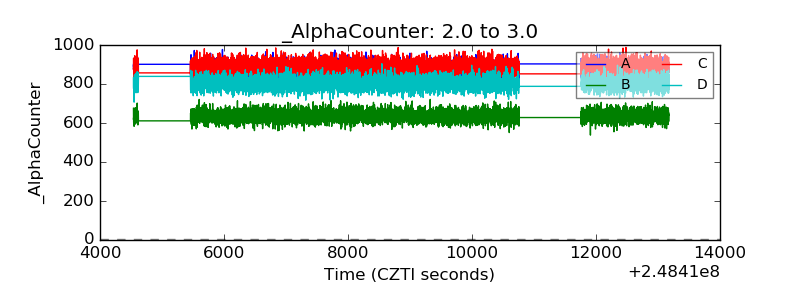 |
| _CPM_Rate | 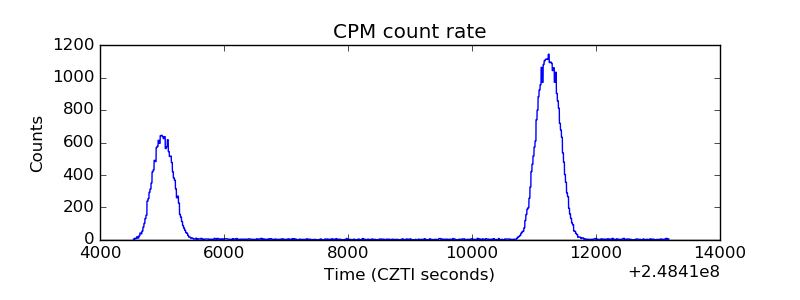 |
| CZT Counter | 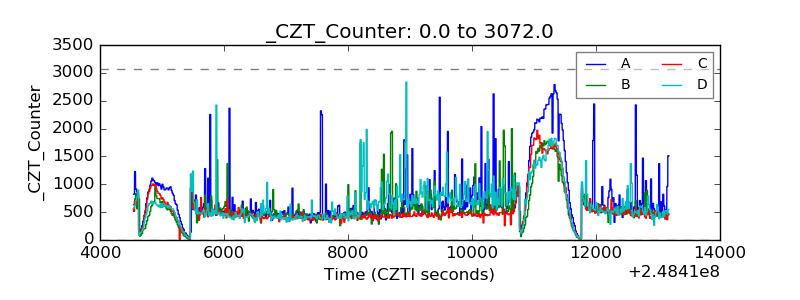 |
| +2.5 Volts monitor | 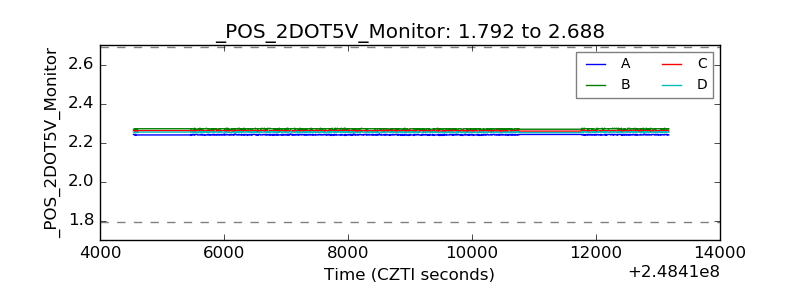 |
| +5 Volts monitor | 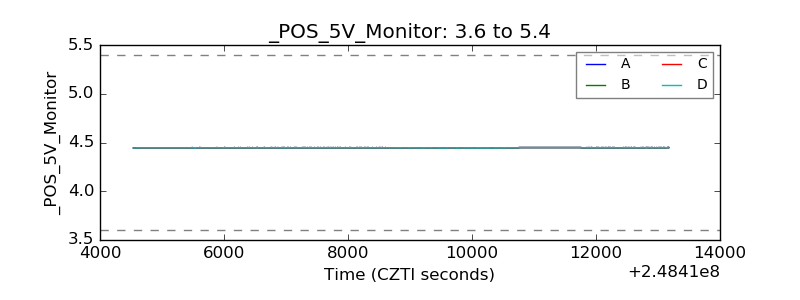 |
| _ROLL_ROT | 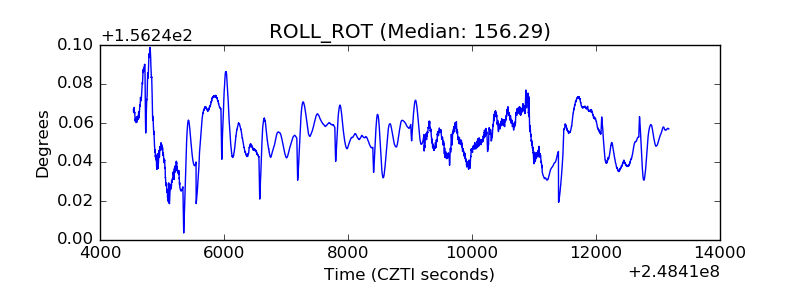 |
| _Roll_DEC | 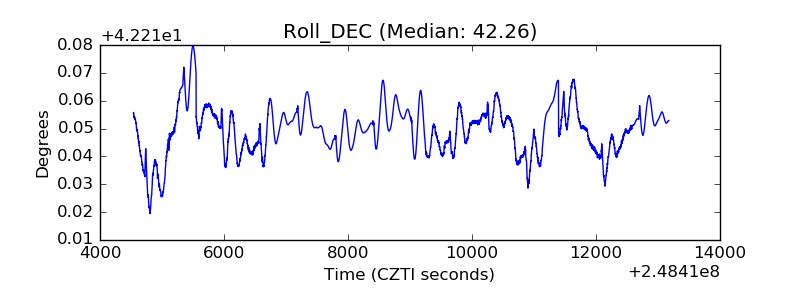 |
| _Roll_RA | 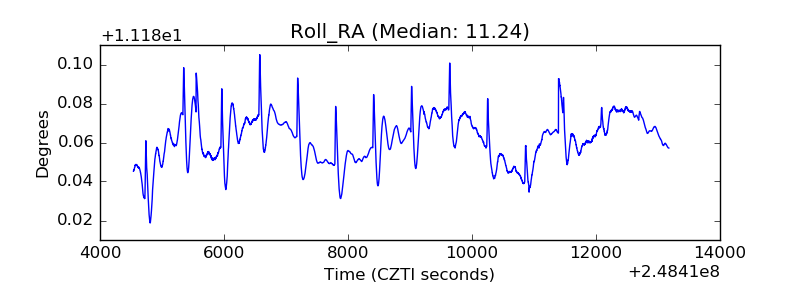 |
| Veto Counter | 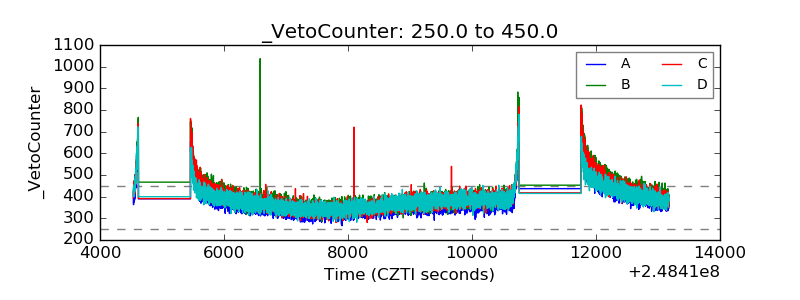 |