| Param | Original file | Final file |
|---|---|---|
| Filename | modeM0/AS1A04_022T05_9000001690_11533cztM0_level2.evt | modeM0/AS1A04_022T05_9000001690_11533cztM0_level2_quad_clean.evt |
| Size (bytes) | 607,432,320 | 66,205,440 |
| Size | 579.3 MB | 63.1 MB |
| Events in quadrant A | 6,144,490 | 366,443 |
| Events in quadrant B | 3,867,524 | 389,868 |
| Events in quadrant C | 3,087,100 | 410,961 |
| Events in quadrant D | 4,851,588 | 378,113 |
| Mode M9 | |||
|---|---|---|---|
| Quadrant | BADHDUFLAG | Total packets | Discarded packets |
| A | 0 | 14 | 0 |
| B | 0 | 14 | 0 |
| C | 0 | 14 | 0 |
| D | 0 | 15 | 0 |
| Mode M0 | |||
|---|---|---|---|
| Quadrant | BADHDUFLAG | Total packets | Discarded packets |
| A | 0 | 22766 | 3 |
| B | 0 | 15498 | 2 |
| C | 0 | 13508 | 2 |
| D | 0 | 18749 | 2 |
| Mode SS | |||
|---|---|---|---|
| Quadrant | BADHDUFLAG | Total packets | Discarded packets |
| A | 0 | 134 | 0 |
| B | 0 | 134 | 0 |
| C | 0 | 134 | 0 |
| D | 0 | 134 | 0 |
| Quadrant | Total seconds | Saturated seconds | Saturation percentage |
|---|---|---|---|
| A | 6578 | 746 | 11.340833% |
| B | 6578 | 198 | 3.010033% |
| C | 6578 | 34 | 0.516874% |
| D | 6578 | 247 | 3.754941% |
Noise dominated data is calculated using 1-second bins in cleaned event files. If a bin has >2000 counts, and if more than 50% of those come from <1% of pixels, then it is considered to be noise-dominated and hence unusable.
| Quadrant | # 1 sec bins | Bins with >0 counts | Bins with >2000 counts | High rate bins dominated by noise | Noise dominated (total time) | Noise dominated (detector-on time) | Marked lightcurve |
|---|---|---|---|---|---|---|---|
| A | 7709 | 6579 | 496 | 496 | 6.43% | 7.54% | 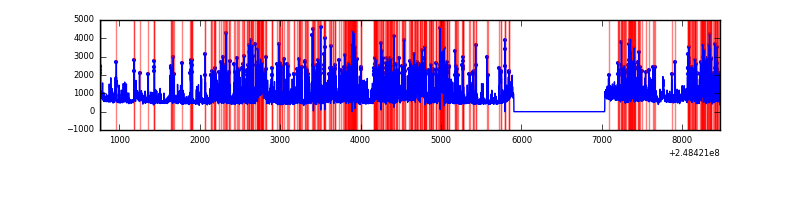 |
| B | 7709 | 6580 | 91 | 91 | 1.18% | 1.38% | 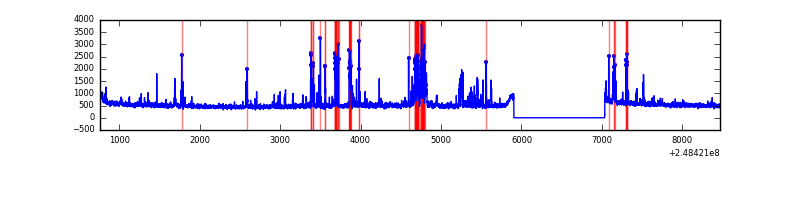 |
| C | 7709 | 6580 | 1 | 1 | 0.01% | 0.02% | 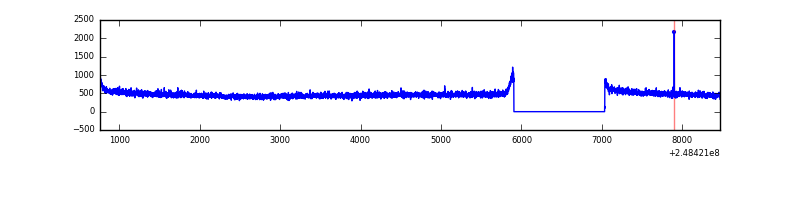 |
| D | 7709 | 6580 | 180 | 180 | 2.33% | 2.74% | 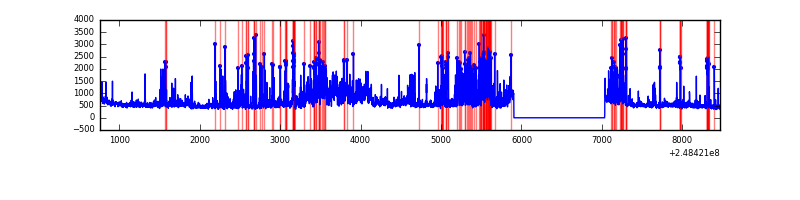 |
Top three noisy pixels from each quadrant. If the there are fewer than three noisy pixels in the level2.evt file, extra rows are filled as -1
| Pixel properties | Quadrant properties | ||||||
|---|---|---|---|---|---|---|---|
| Quadrant | DetID | PixID | Counts | Sigma | Mean | Median | Sigma |
| A | 8 | 5 | 2980098 | 18955.47 | 780 | 764 | 157.2 |
| A | 1 | 162 | 45903 | 287.19 | 780 | 764 | 157.2 |
| A | 1 | 178 | 22187 | 136.3 | 780 | 764 | 157.2 |
| B | 4 | 239 | 572535 | 3673.13 | 811 | 792 | 155.7 |
| B | 15 | 204 | 83608 | 532.05 | 811 | 792 | 155.7 |
| B | 0 | 214 | 19007 | 117.02 | 811 | 792 | 155.7 |
| C | 13 | 61 | 5778 | 27.18 | 790 | 795 | 183.3 |
| C | 7 | 159 | 3645 | 15.55 | 790 | 795 | 183.3 |
| C | 7 | 236 | 3568 | 15.13 | 790 | 795 | 183.3 |
| D | 1 | 52 | 980791 | 5263.24 | 776 | 754 | 186.2 |
| D | 5 | 222 | 548710 | 2942.77 | 776 | 754 | 186.2 |
| D | 2 | 120 | 100586 | 536.14 | 776 | 754 | 186.2 |
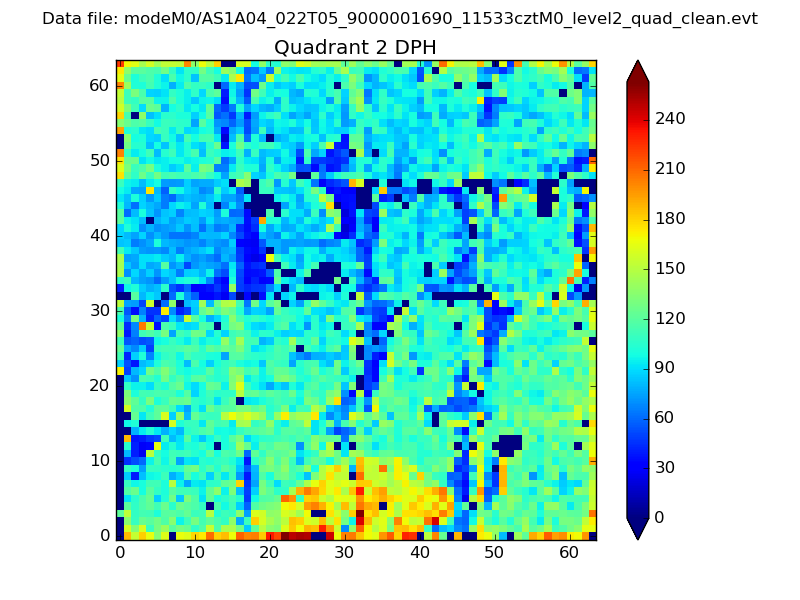
Histogram calculated using DETX and DETY for each event in the final _common_clean file
| Quadrant A | 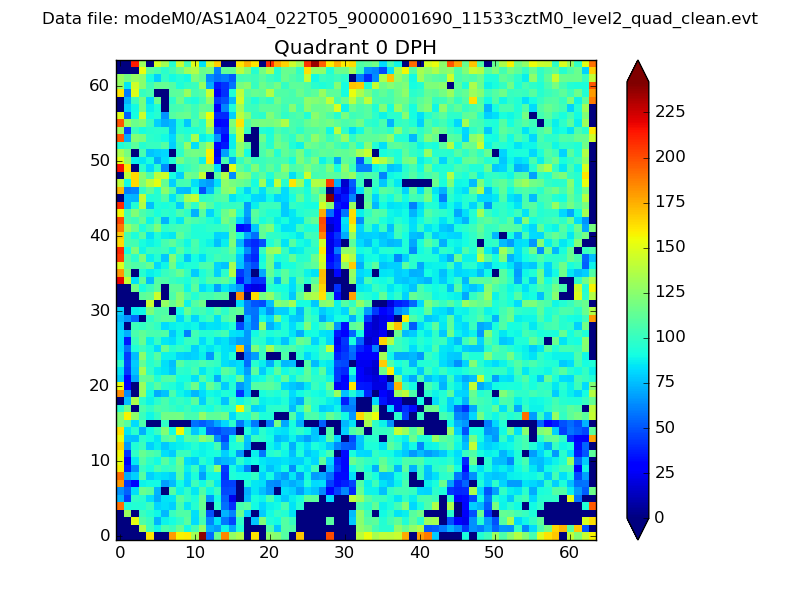 |
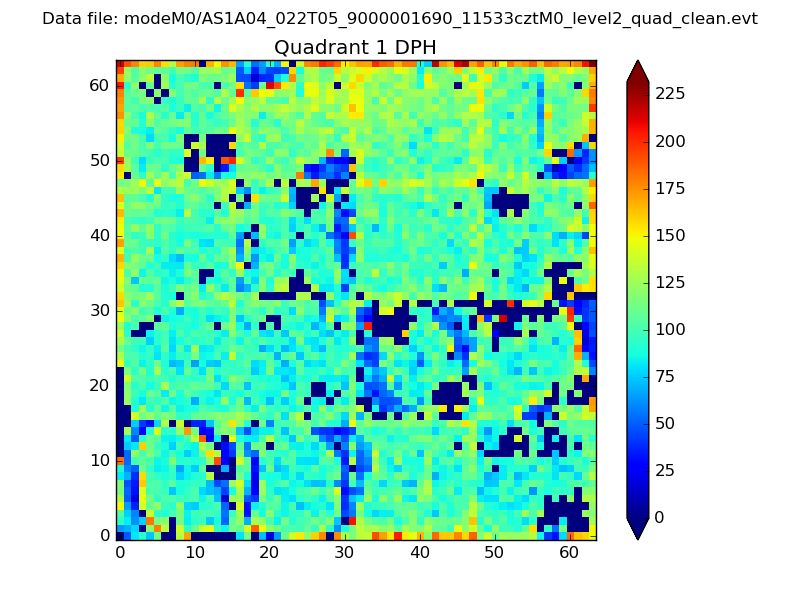 |
Quadrant B |
|---|---|---|---|
| Quadrant D | 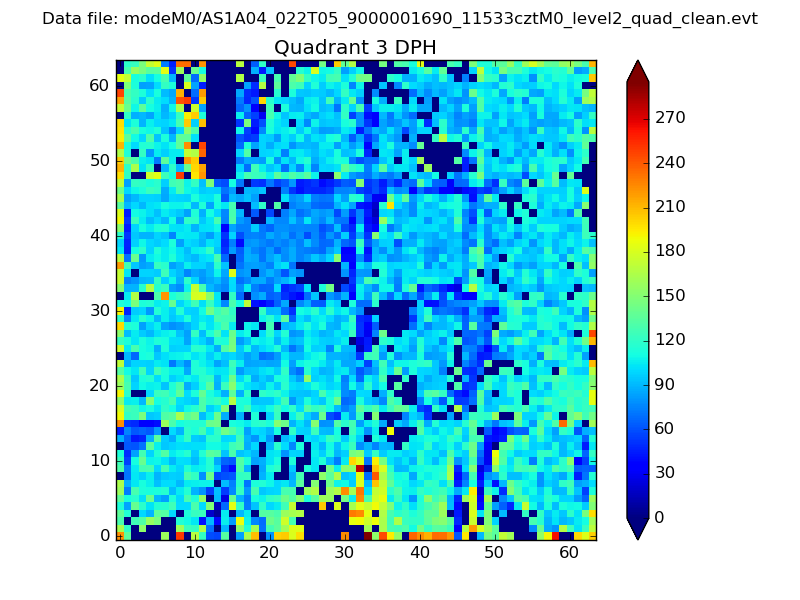 |
 |
Quadrant C |
| Plot type | Count rate plots | Images |
|---|---|---|
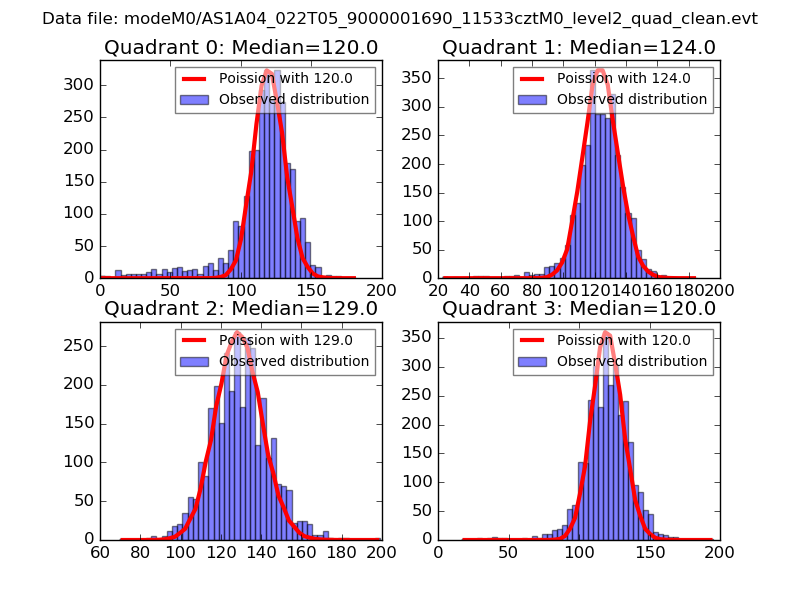
| Comparison with Poisson distribution Blue bars denote a histogram of data divided into 1 sec bins. Red curve is a Poisson curve with rate = median count rate of data. |
 |
 |
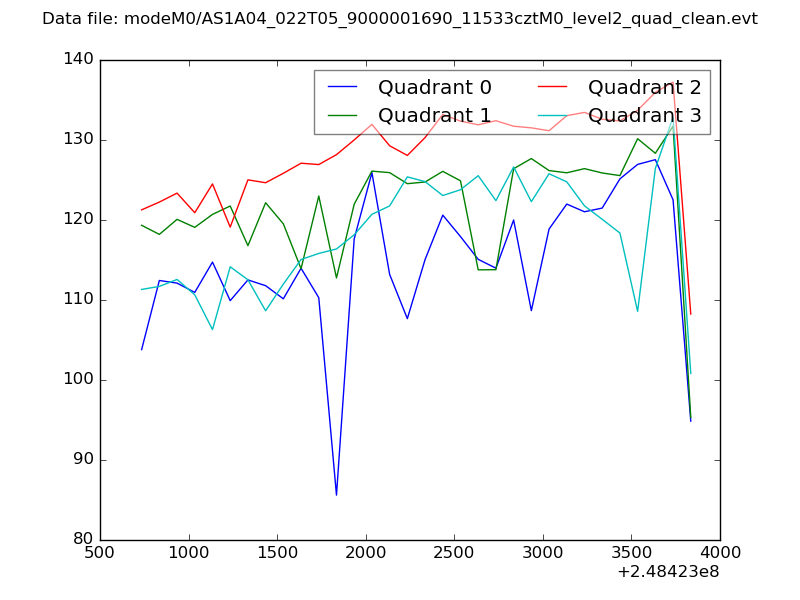
| Quadrant-wise count rates Data is divided into 100 sec bins |
 |
|
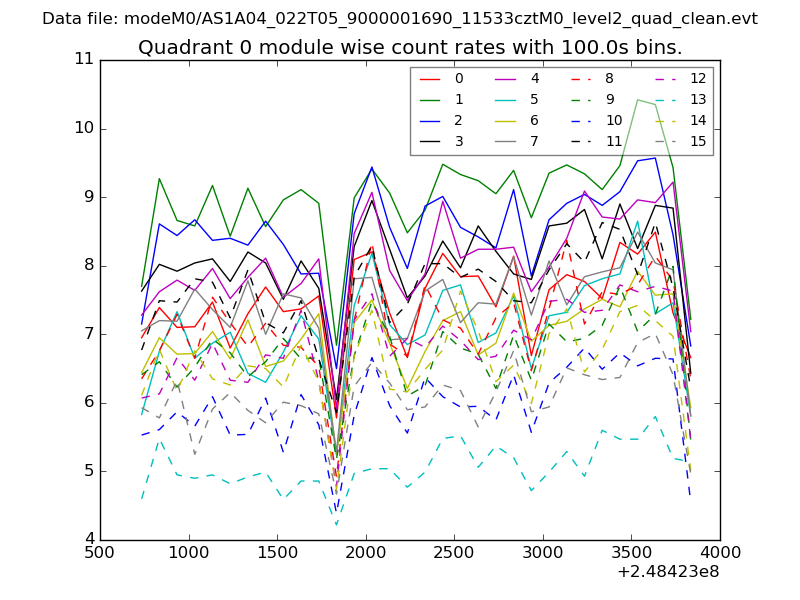
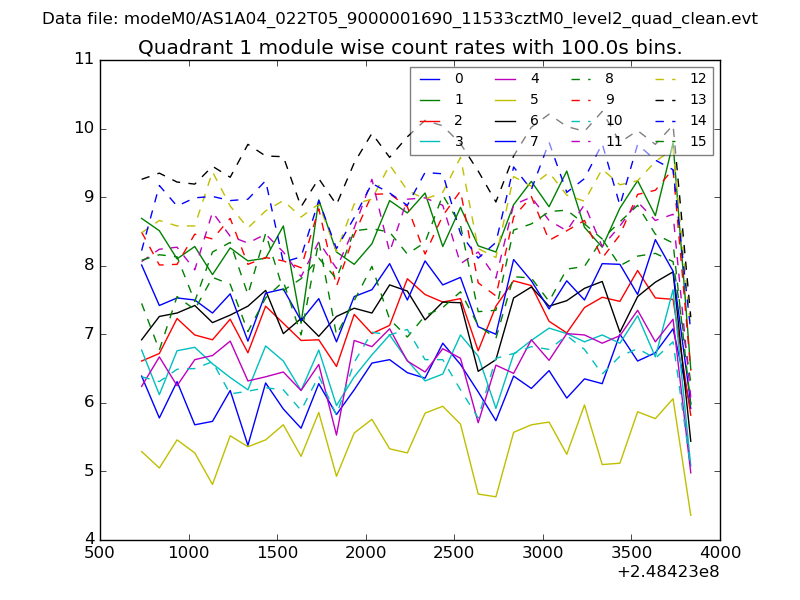
| Module-wise count rates for Quadrant A Data is divided into 100 sec bins |
 |
 |
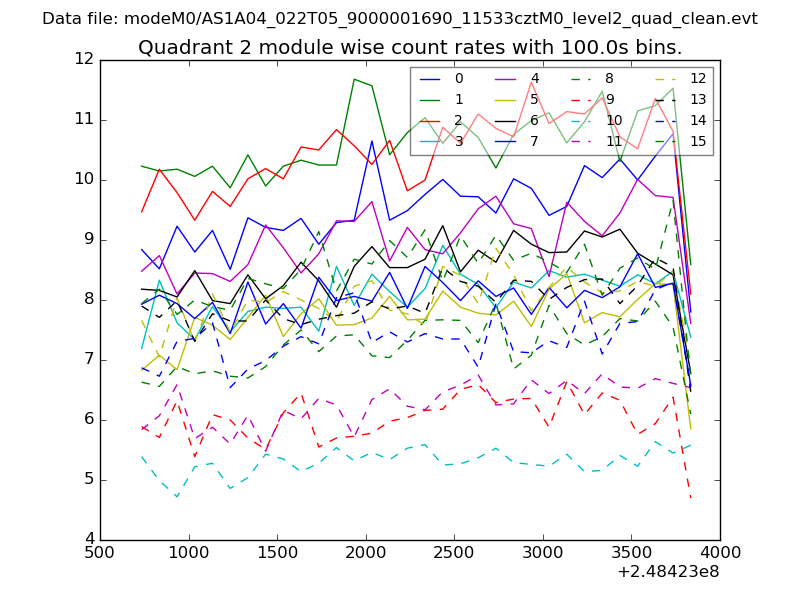
| Module-wise count rates for Quadrant B Data is divided into 100 sec bins |
 |
 |
| Module-wise count rates for Quadrant C Data is divided into 100 sec bins |
 |
 |
| Module-wise count rates for Quadrant D Data is divided into 100 sec bins |
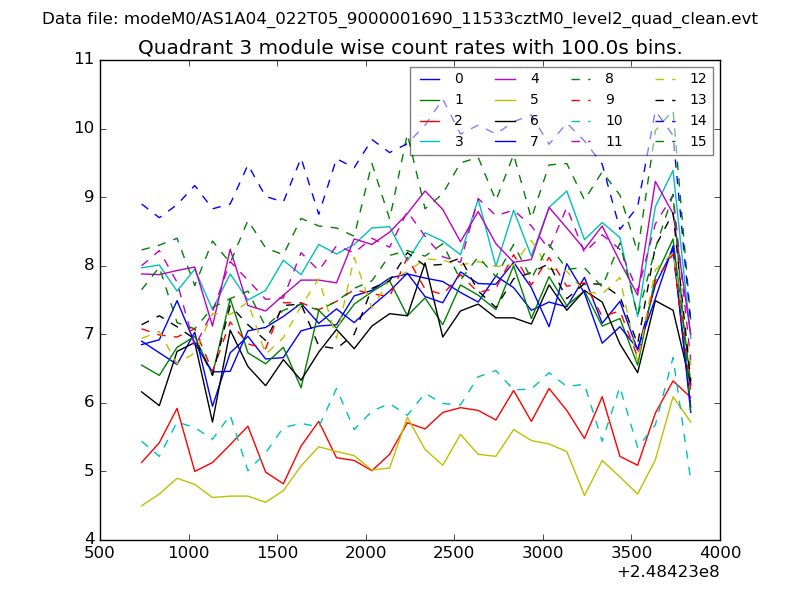 |
 |
| Parameter | Plot |
|---|---|
| CZT HV Monitor | 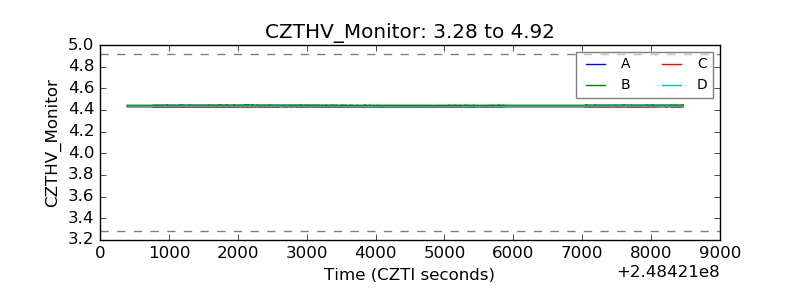 |
| D_VDD | 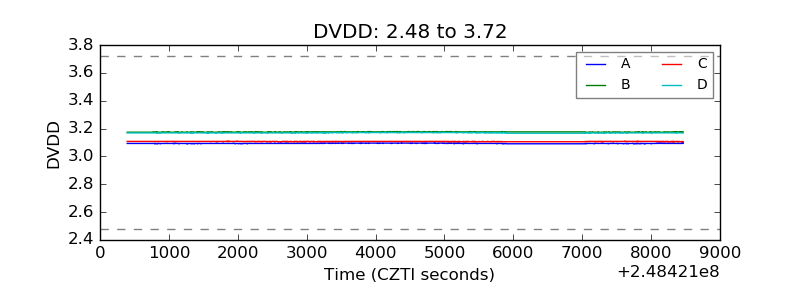 |
| Temperature 1 | 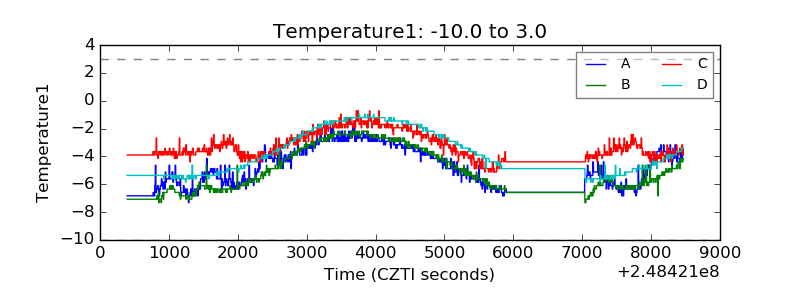 |
| Veto HV Monitor | 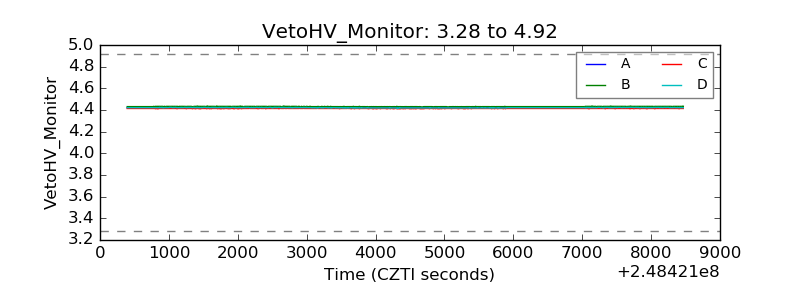 |
| Veto LLD | 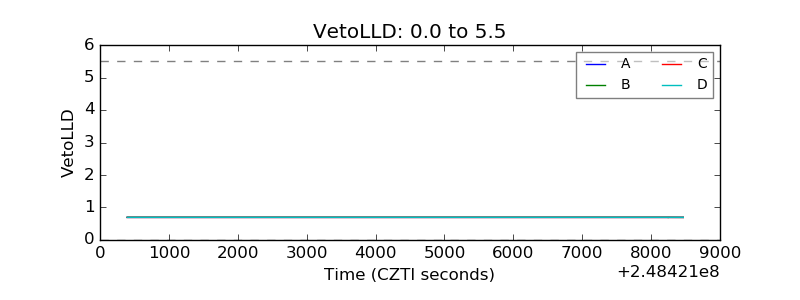 |
| Alpha Counter | 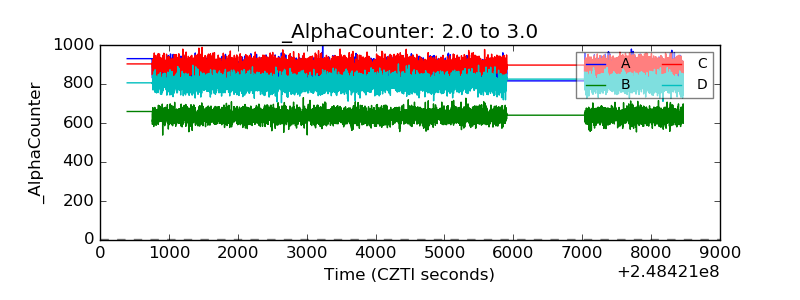 |
| _CPM_Rate | 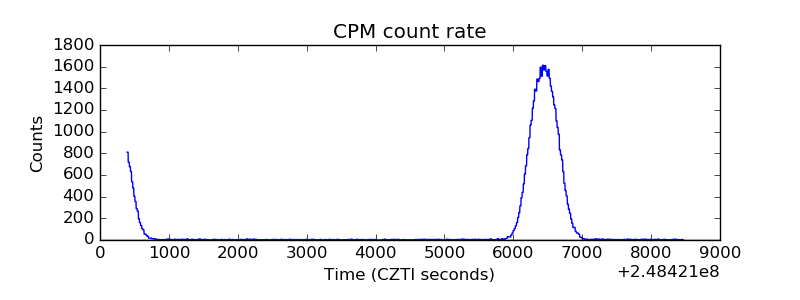 |
| CZT Counter | 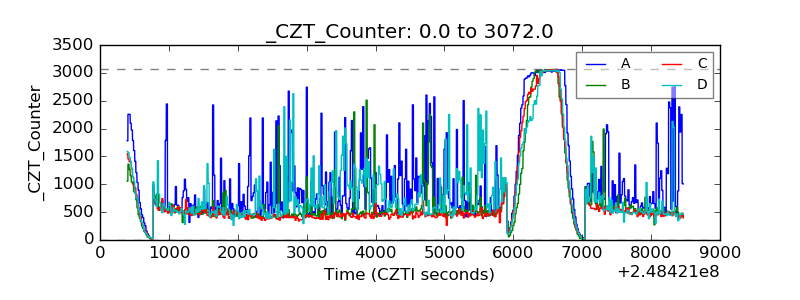 |
| +2.5 Volts monitor | 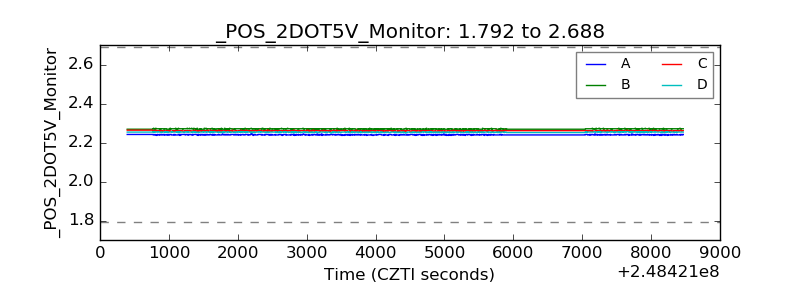 |
| +5 Volts monitor | 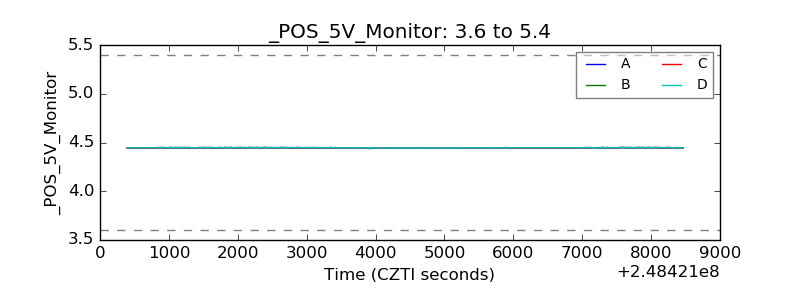 |
| _ROLL_ROT | 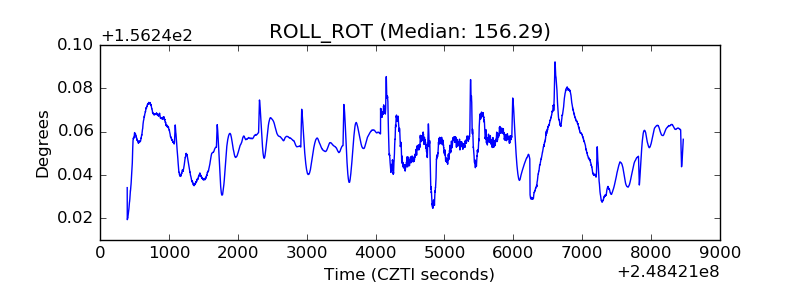 |
| _Roll_DEC | 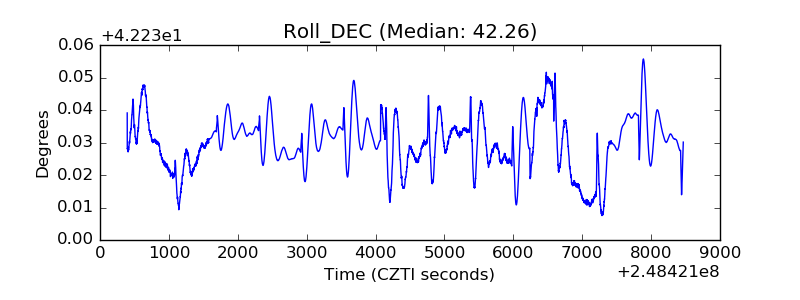 |
| _Roll_RA | 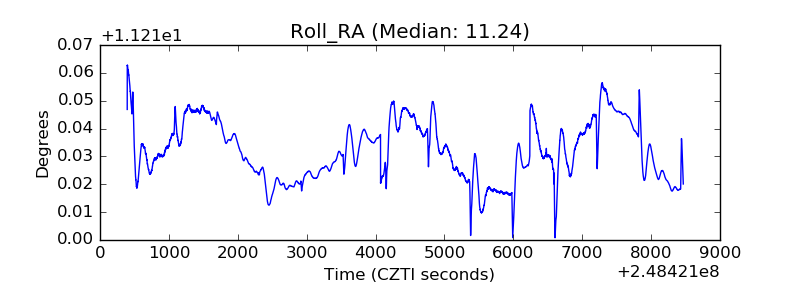 |
| Veto Counter | 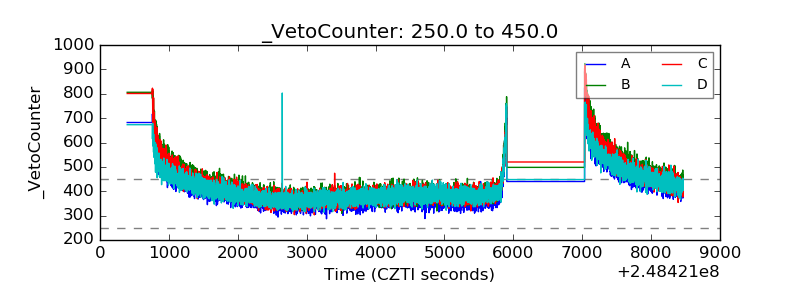 |