| Param | Original file | Final file |
|---|---|---|
| Filename | modeM0/AS1A04_022T05_9000001690_11534cztM0_level2.evt | modeM0/AS1A04_022T05_9000001690_11534cztM0_level2_quad_clean.evt |
| Size (bytes) | 563,256,000 | 75,879,360 |
| Size | 537.2 MB | 72.4 MB |
| Events in quadrant A | 5,249,933 | 452,221 |
| Events in quadrant B | 3,987,012 | 465,292 |
| Events in quadrant C | 3,060,101 | 486,833 |
| Events in quadrant D | 4,333,442 | 452,423 |
| Mode M9 | |||
|---|---|---|---|
| Quadrant | BADHDUFLAG | Total packets | Discarded packets |
| A | 0 | 16 | 0 |
| B | 0 | 16 | 0 |
| C | 0 | 16 | 0 |
| D | 0 | 17 | 0 |
| Mode M0 | |||
|---|---|---|---|
| Quadrant | BADHDUFLAG | Total packets | Discarded packets |
| A | 0 | 19827 | 3 |
| B | 0 | 15716 | 2 |
| C | 0 | 13096 | 2 |
| D | 0 | 17176 | 2 |
| Mode SS | |||
|---|---|---|---|
| Quadrant | BADHDUFLAG | Total packets | Discarded packets |
| A | 0 | 128 | 0 |
| B | 0 | 128 | 0 |
| C | 0 | 128 | 0 |
| D | 0 | 128 | 0 |
| Quadrant | Total seconds | Saturated seconds | Saturation percentage |
|---|---|---|---|
| A | 6314 | 534 | 8.457396% |
| B | 6314 | 212 | 3.357618% |
| C | 6314 | 31 | 0.490972% |
| D | 6314 | 207 | 3.278429% |
Noise dominated data is calculated using 1-second bins in cleaned event files. If a bin has >2000 counts, and if more than 50% of those come from <1% of pixels, then it is considered to be noise-dominated and hence unusable.
| Quadrant | # 1 sec bins | Bins with >0 counts | Bins with >2000 counts | High rate bins dominated by noise | Noise dominated (total time) | Noise dominated (detector-on time) | Marked lightcurve |
|---|---|---|---|---|---|---|---|
| A | 7545 | 6316 | 323 | 323 | 4.28% | 5.11% | 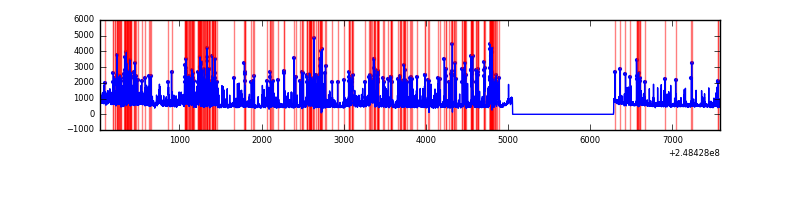 |
| B | 7545 | 6316 | 98 | 98 | 1.30% | 1.55% | 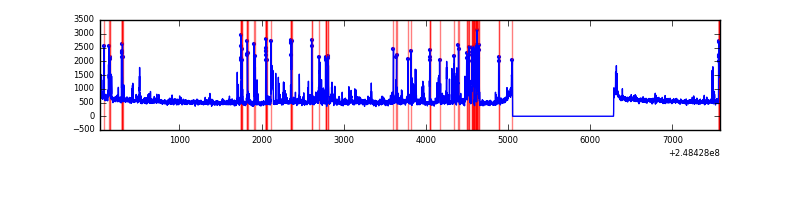 |
| C | 7545 | 6316 | 1 | 1 | 0.01% | 0.02% | 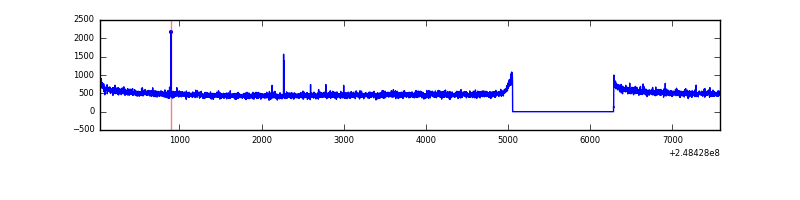 |
| D | 7545 | 6316 | 152 | 152 | 2.01% | 2.41% | 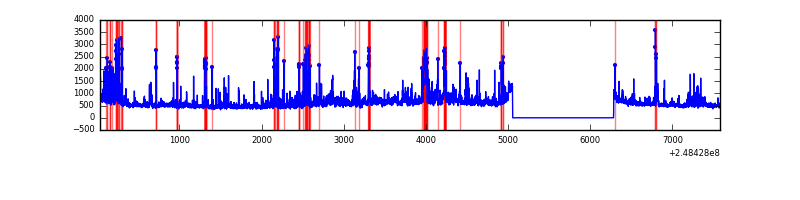 |
Top three noisy pixels from each quadrant. If the there are fewer than three noisy pixels in the level2.evt file, extra rows are filled as -1
| Pixel properties | Quadrant properties | ||||||
|---|---|---|---|---|---|---|---|
| Quadrant | DetID | PixID | Counts | Sigma | Mean | Median | Sigma |
| A | 8 | 5 | 2080240 | 13045.49 | 789 | 774 | 159.4 |
| A | 1 | 162 | 38478 | 236.54 | 789 | 774 | 159.4 |
| A | 9 | 143 | 24059 | 146.08 | 789 | 774 | 159.4 |
| B | 4 | 239 | 672427 | 4444.12 | 803 | 784 | 151.1 |
| B | 15 | 204 | 133994 | 881.42 | 803 | 784 | 151.1 |
| B | 0 | 214 | 19825 | 125.99 | 803 | 784 | 151.1 |
| C | 13 | 61 | 5678 | 27.06 | 783 | 789 | 180.7 |
| C | 14 | 234 | 3901 | 17.23 | 783 | 789 | 180.7 |
| C | 7 | 159 | 3524 | 15.14 | 783 | 789 | 180.7 |
| D | 1 | 52 | 559586 | 3038.97 | 774 | 754 | 183.9 |
| D | 5 | 222 | 403845 | 2192.04 | 774 | 754 | 183.9 |
| D | 13 | 122 | 183450 | 993.51 | 774 | 754 | 183.9 |
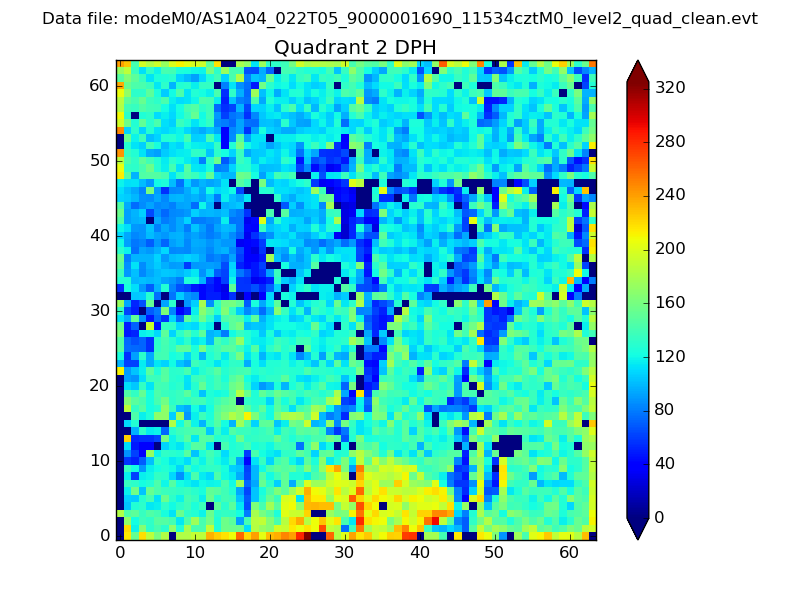
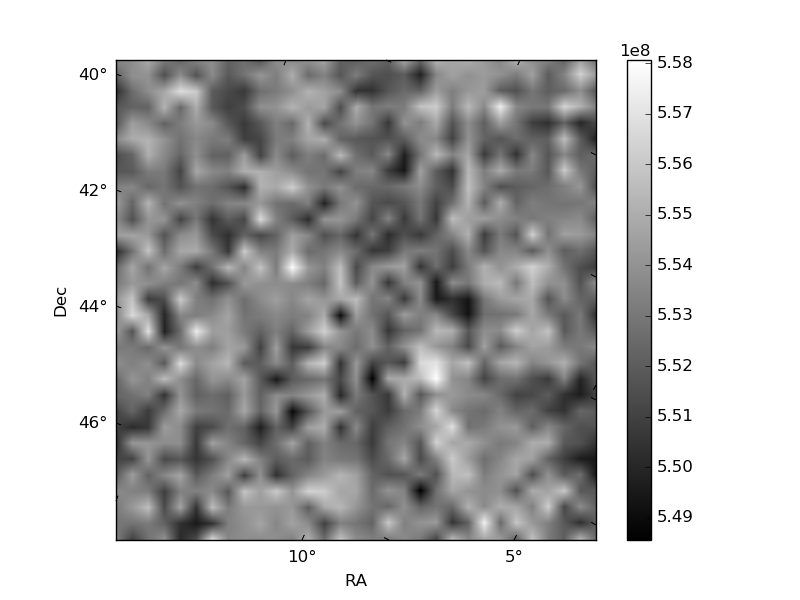
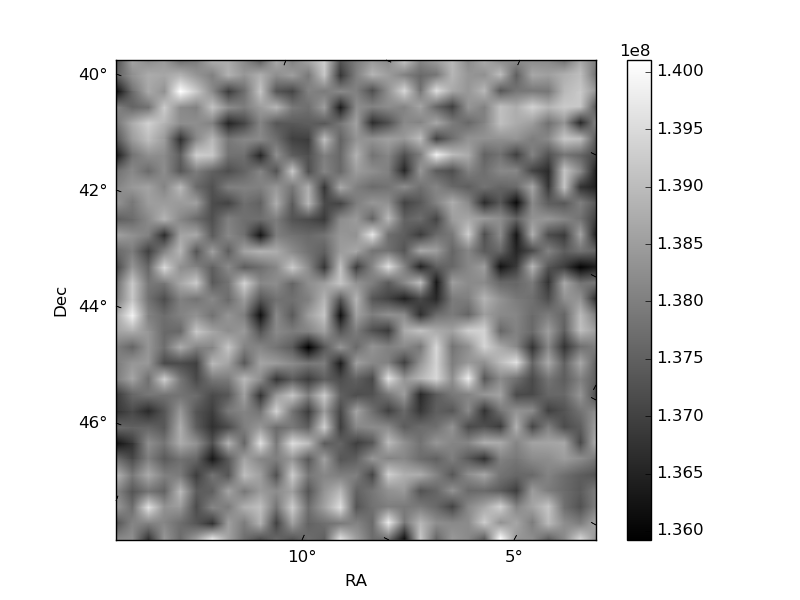
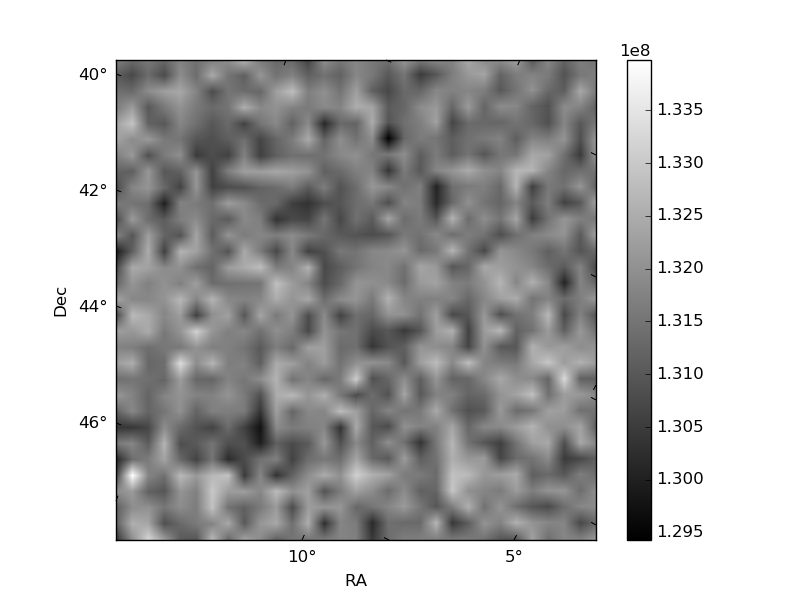
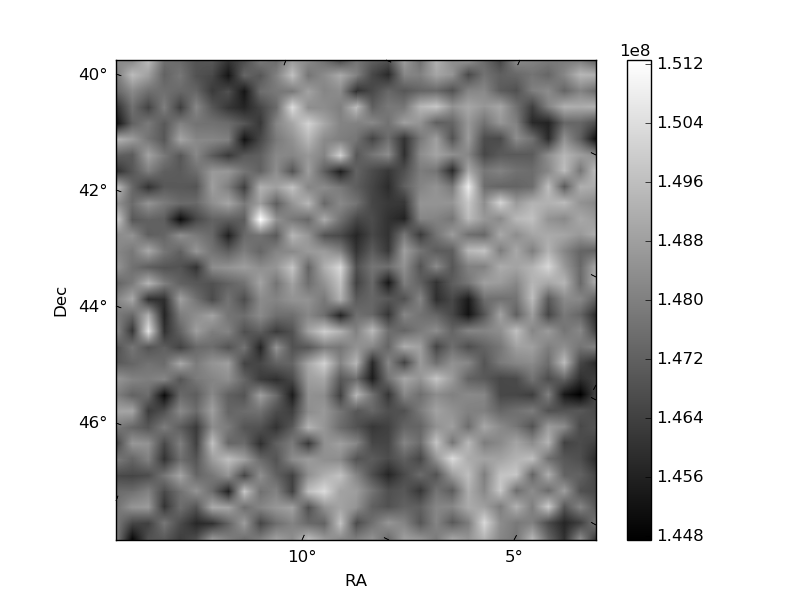
Histogram calculated using DETX and DETY for each event in the final _common_clean file
| Quadrant A | 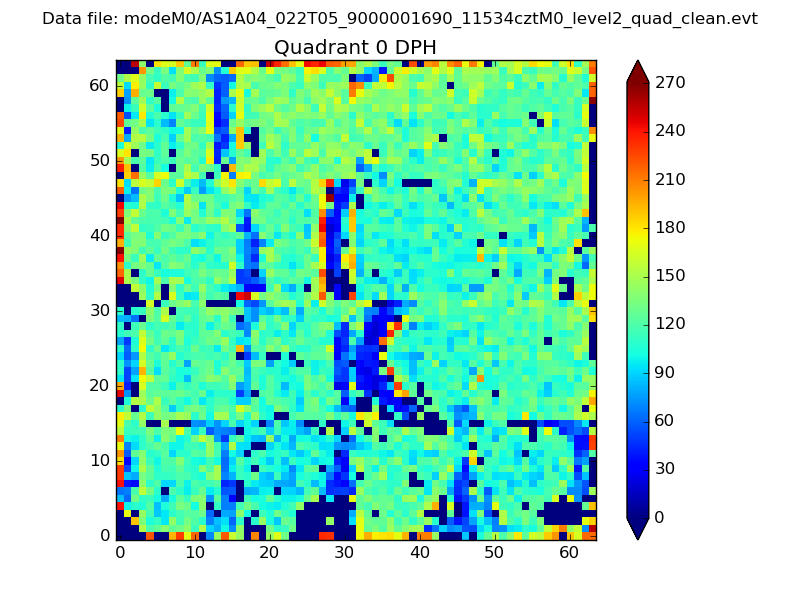 |
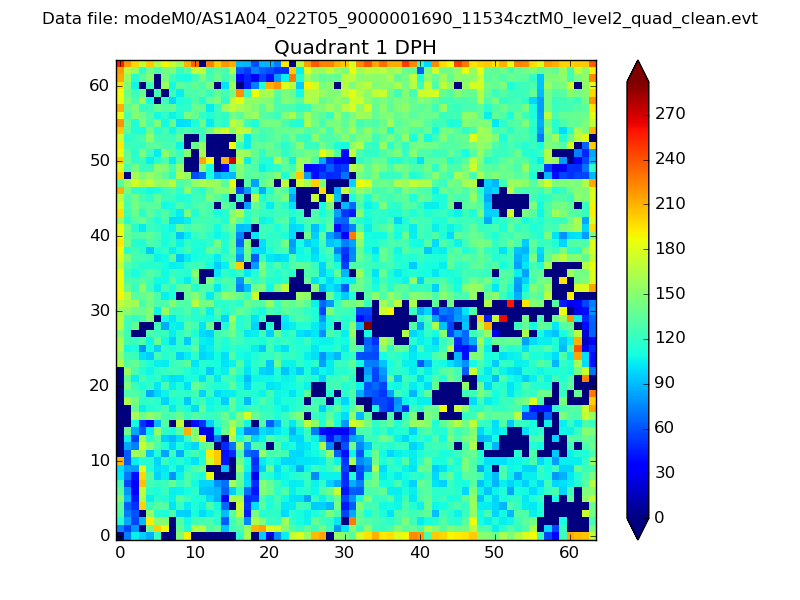 |
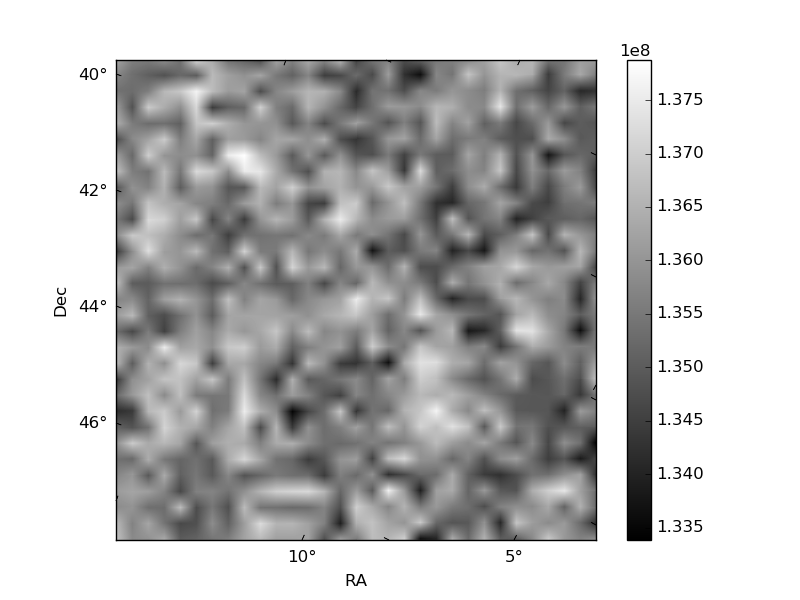
Quadrant B |
|---|---|---|---|
| Quadrant D | 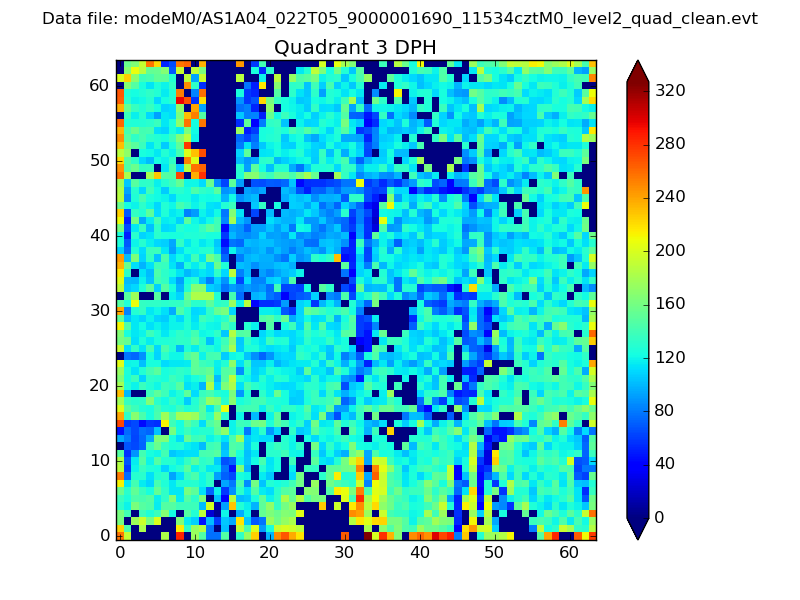 |
 |
Quadrant C |
| Plot type | Count rate plots | Images |
|---|---|---|
| Comparison with Poisson distribution Blue bars denote a histogram of data divided into 1 sec bins. Red curve is a Poisson curve with rate = median count rate of data. |
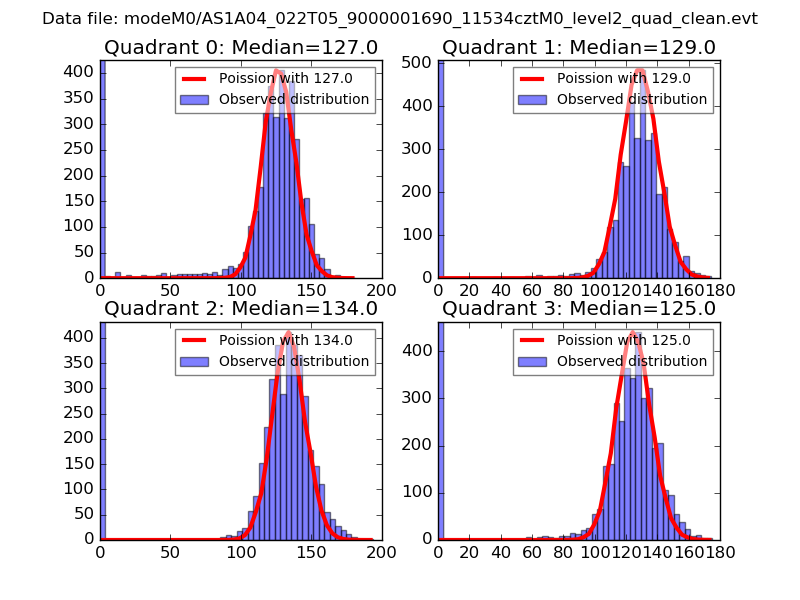 |
 |
| Quadrant-wise count rates Data is divided into 100 sec bins |
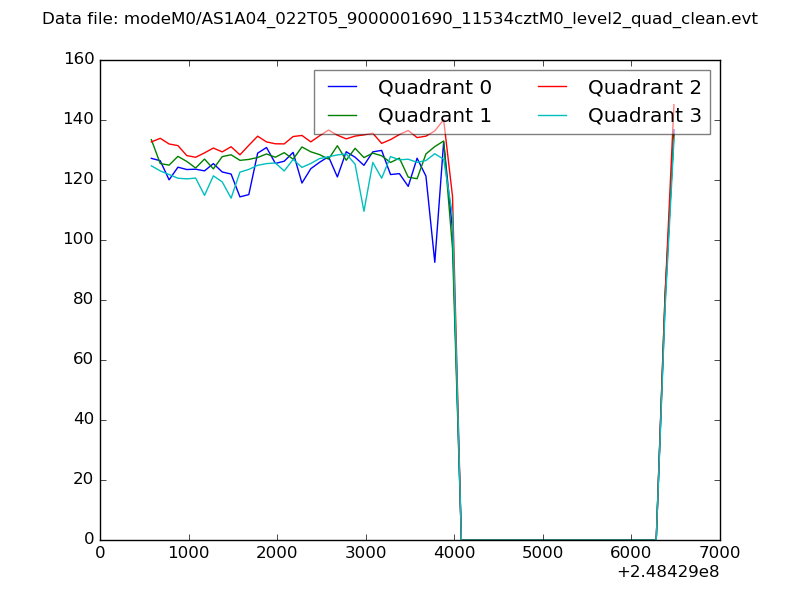 |
|
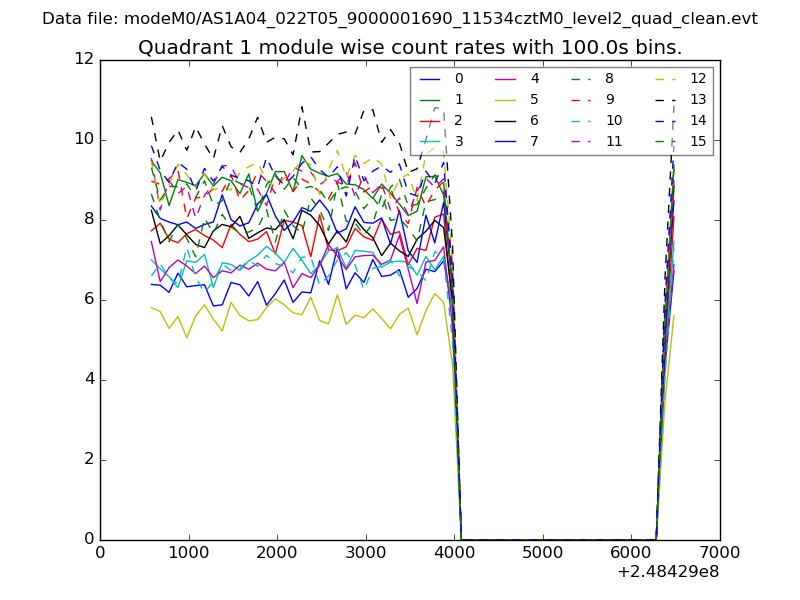
| Module-wise count rates for Quadrant A Data is divided into 100 sec bins |
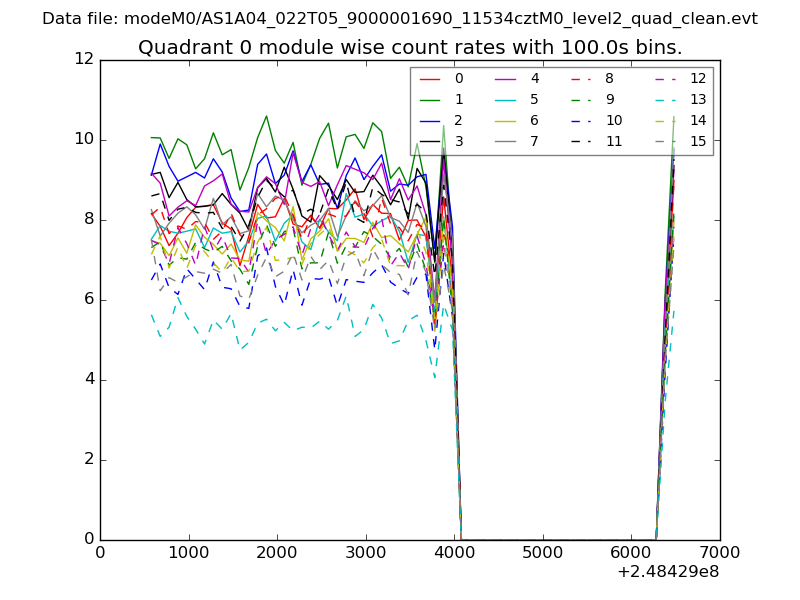 |
 |
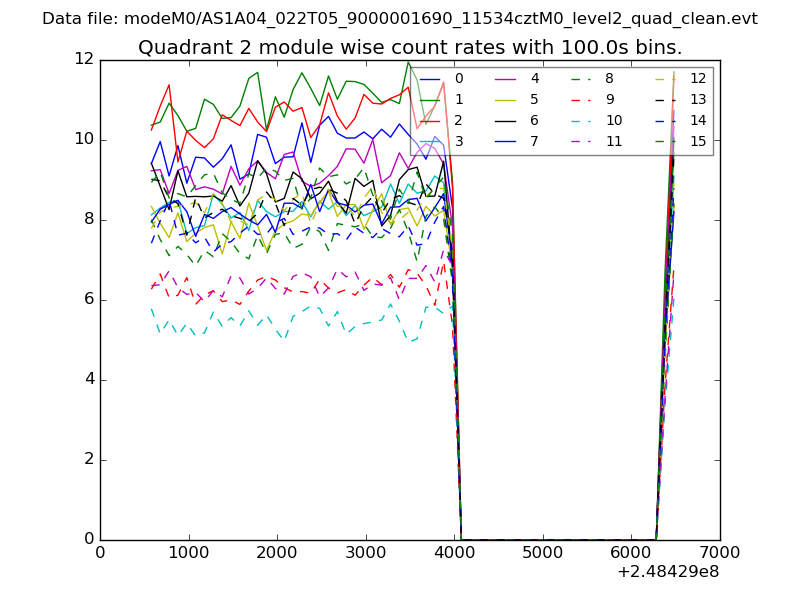
| Module-wise count rates for Quadrant B Data is divided into 100 sec bins |
 |
 |
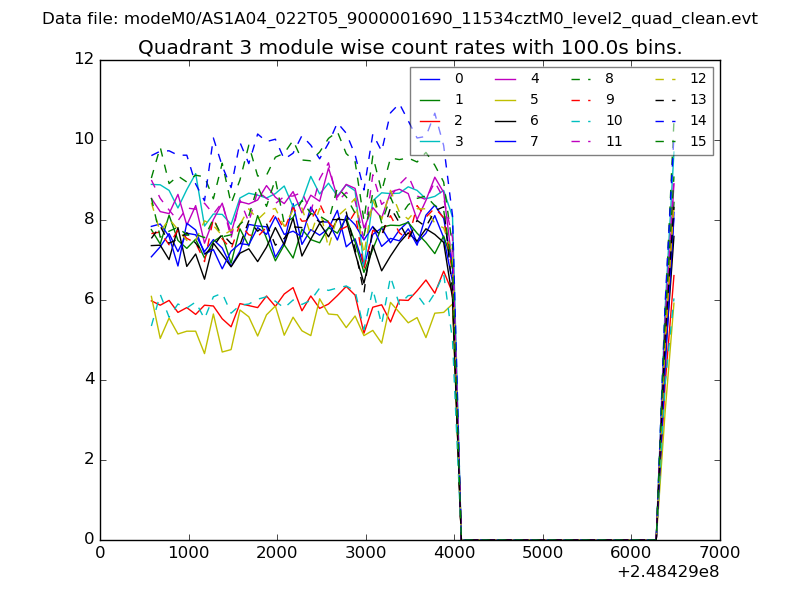
| Module-wise count rates for Quadrant C Data is divided into 100 sec bins |
 |
 |
| Module-wise count rates for Quadrant D Data is divided into 100 sec bins |
 |
 |
| Parameter | Plot |
|---|---|
| CZT HV Monitor | 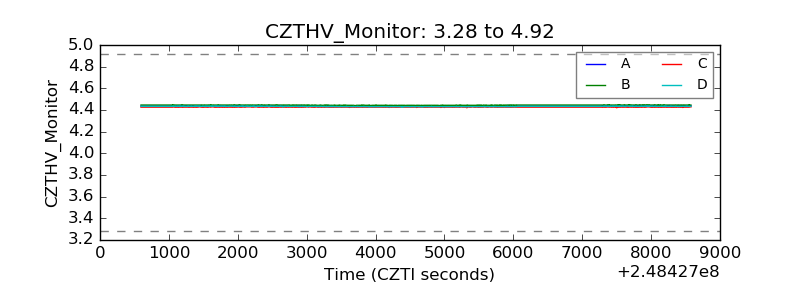 |
| D_VDD | 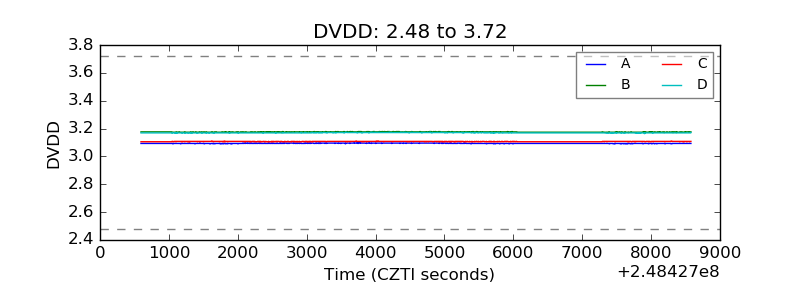 |
| Temperature 1 | 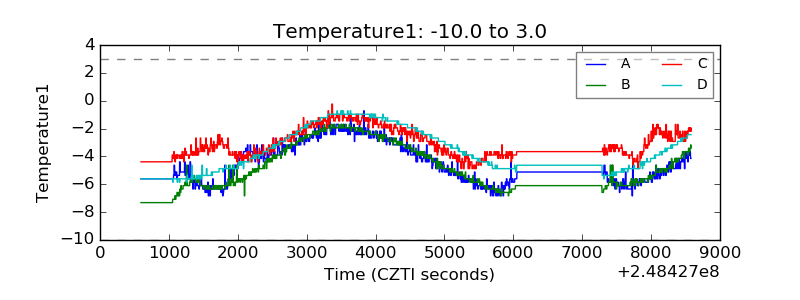 |
| Veto HV Monitor | 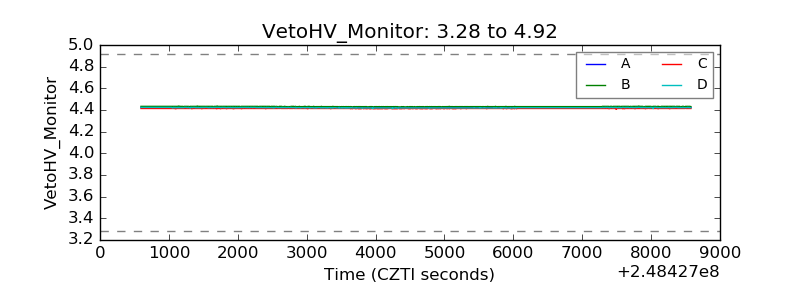 |
| Veto LLD | 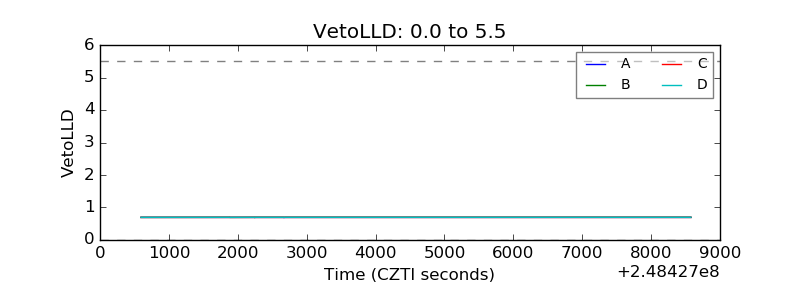 |
| Alpha Counter | 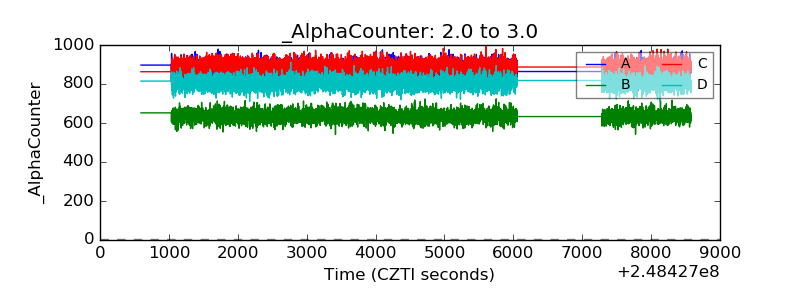 |
| _CPM_Rate | 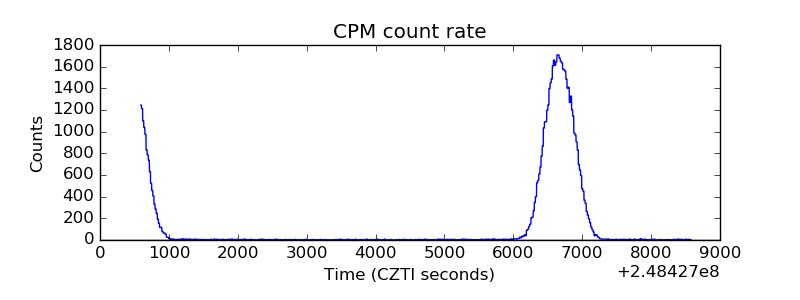 |
| CZT Counter | 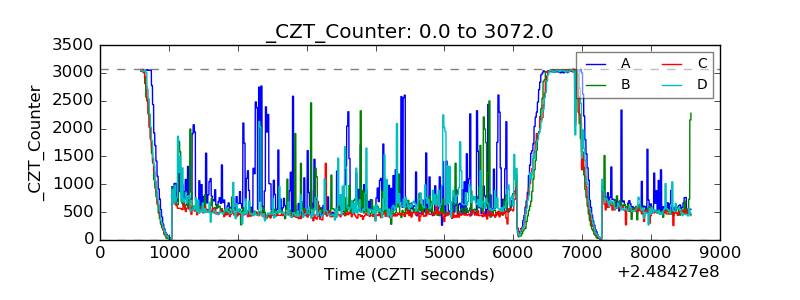 |
| +2.5 Volts monitor |  |
| +5 Volts monitor |  |
| _ROLL_ROT | 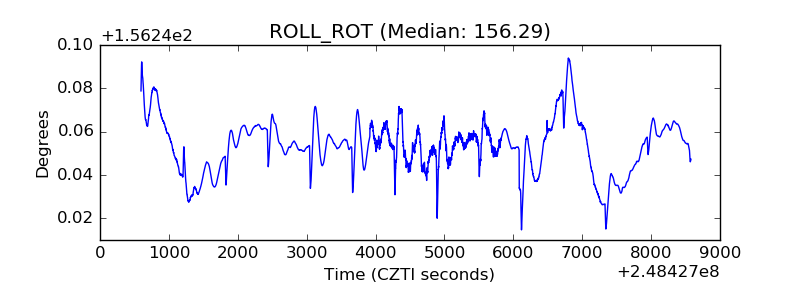 |
| _Roll_DEC | 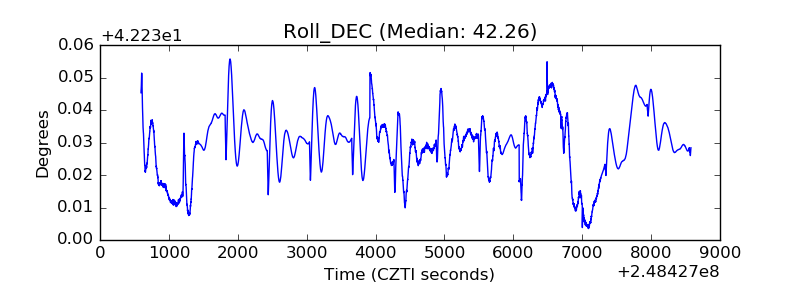 |
| _Roll_RA | 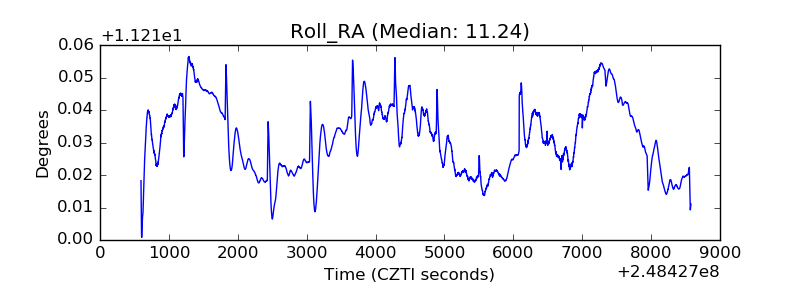 |
| Veto Counter | 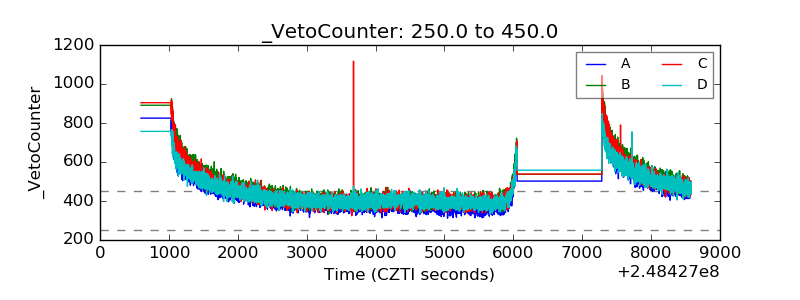 |