| Param | Original file | Final file |
|---|---|---|
| Filename | modeM0/AS1G08_009T01_9000001692cztM0_level2.fits | modeM0/AS1G08_009T01_9000001692cztM0_level2_quad_clean.evt |
| Size (bytes) | 991,719,360 | 950,247,360 |
| Size | 945.8 MB | 906.2 MB |
| Events in quadrant A | 5,958,178 | 5,725,218 |
| Events in quadrant B | 5,814,420 | 5,685,152 |
| Events in quadrant C | 6,049,688 | 5,568,770 |
| Events in quadrant D | 4,948,520 | 4,544,106 |
| Mode M0 | |||
|---|---|---|---|
| Quadrant | BADHDUFLAG | Total packets | Discarded packets |
| A | 0 | 314302 | 0 |
| B | 0 | 278666 | 0 |
| C | 0 | 217657 | 0 |
| D | 0 | 331449 | 0 |
| Mode M9 | |||
|---|---|---|---|
| Quadrant | BADHDUFLAG | Total packets | Discarded packets |
| A | 0 | 167 | 0 |
| B | 0 | 167 | 0 |
| C | 0 | 167 | 0 |
| D | 0 | 167 | 0 |
| Mode SS | |||
|---|---|---|---|
| Quadrant | BADHDUFLAG | Total packets | Discarded packets |
| A | 0 | 2160 | 0 |
| B | 0 | 2160 | 0 |
| C | 0 | 2160 | 0 |
| D | 0 | 2160 | 0 |
| Quadrant | Total seconds | Saturated seconds | Saturation percentage |
|---|---|---|---|
| A | 105832 | 6436 | 6.081336% |
| B | 105832 | 5414 | 5.115655% |
| C | 105832 | 688 | 0.650087% |
| D | 105832 | 12316 | 11.637312% |
Noise dominated data is calculated using 1-second bins in cleaned event files. If a bin has >2000 counts, and if more than 50% of those come from <1% of pixels, then it is considered to be noise-dominated and hence unusable.
| Quadrant | # 1 sec bins | Bins with >0 counts | Bins with >2000 counts | High rate bins dominated by noise | Noise dominated (total time) | Noise dominated (detector-on time) | Marked lightcurve |
|---|---|---|---|---|---|---|---|
| A | 122668 | 105649 | 0 | 0 | 0.00% | 0.00% |  |
| B | 122668 | 105829 | 0 | 0 | 0.00% | 0.00% |  |
| C | 122668 | 105834 | 0 | 0 | 0.00% | 0.00% |  |
| D | 122668 | 105642 | 0 | 0 | 0.00% | 0.00% | 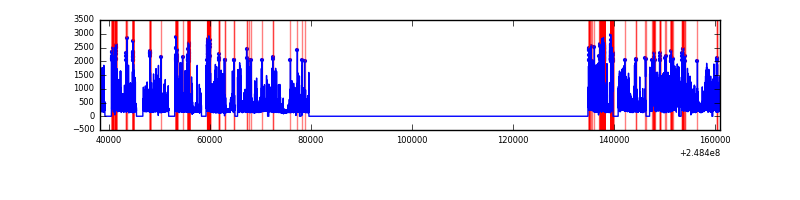 |
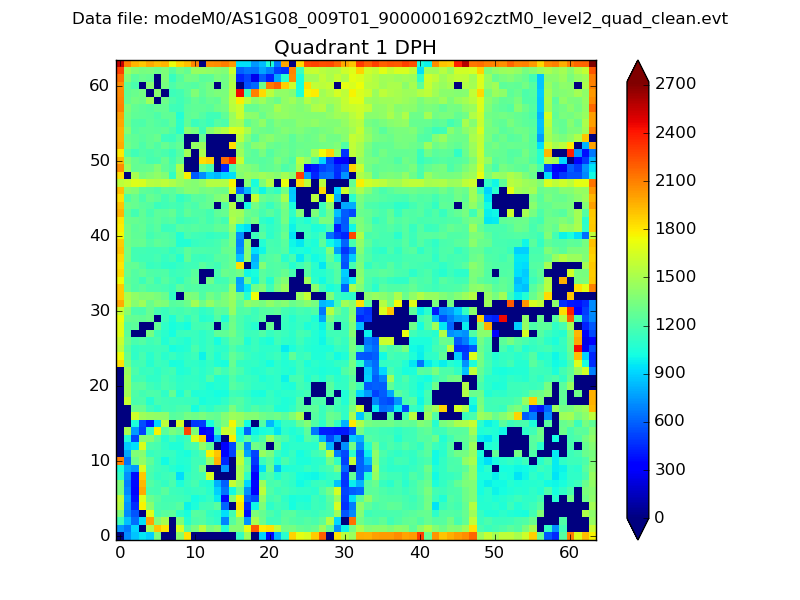
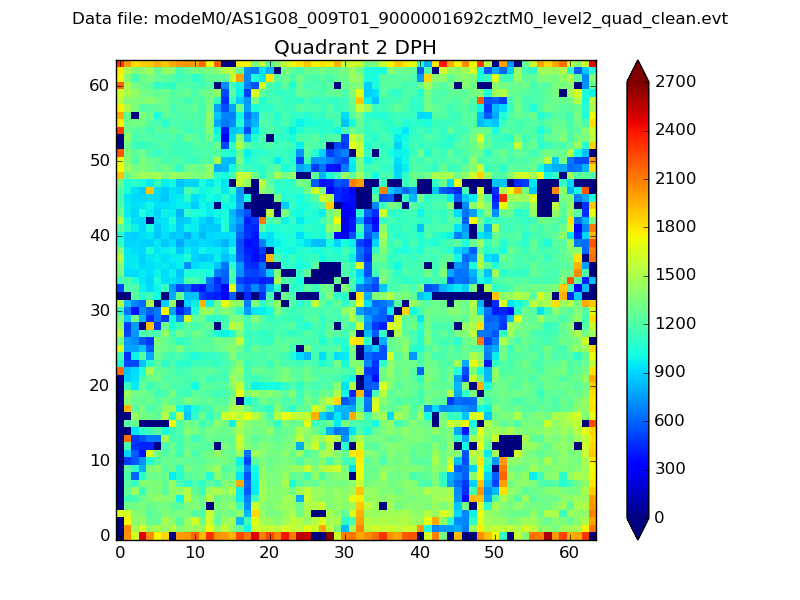
Top three noisy pixels from each quadrant. If the there are fewer than three noisy pixels in the level2.evt file, extra rows are filled as -1
| Pixel properties | Quadrant properties | ||||||
|---|---|---|---|---|---|---|---|
| Quadrant | DetID | PixID | Counts | Sigma | Mean | Median | Sigma |
| A | 0 | 29 | 5789 | 11.07 | 1551 | 1448 | 392.3 |
| A | 7 | 110 | 4901 | 8.8 | 1551 | 1448 | 392.3 |
| A | 9 | 19 | 4491 | 7.76 | 1551 | 1448 | 392.3 |
| B | 2 | 9 | 5003 | 11.68 | 1532 | 1457 | 303.6 |
| B | 3 | 17 | 3818 | 7.78 | 1532 | 1457 | 303.6 |
| B | 12 | 226 | 3779 | 7.65 | 1532 | 1457 | 303.6 |
| C | 1 | 81 | 4462 | 7.18 | 1596 | 1480 | 415.4 |
| C | 1 | 80 | 4462 | 7.18 | 1596 | 1480 | 415.4 |
| C | 12 | 241 | 4262 | 6.7 | 1596 | 1480 | 415.4 |
| D | 6 | 231 | 3626 | 6.2 | 1412 | 1282 | 377.9 |
| D | 3 | 14 | 3595 | 6.12 | 1412 | 1282 | 377.9 |
| D | 1 | 19 | 3459 | 5.76 | 1412 | 1282 | 377.9 |
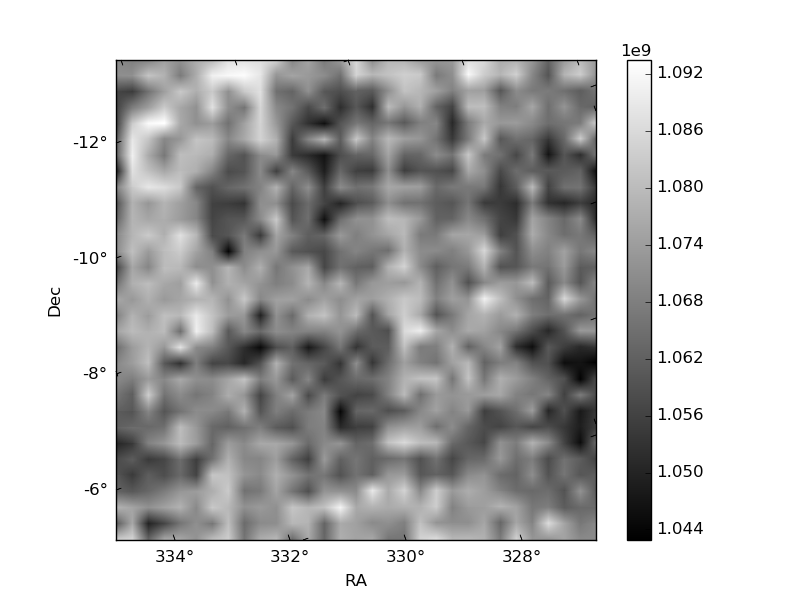
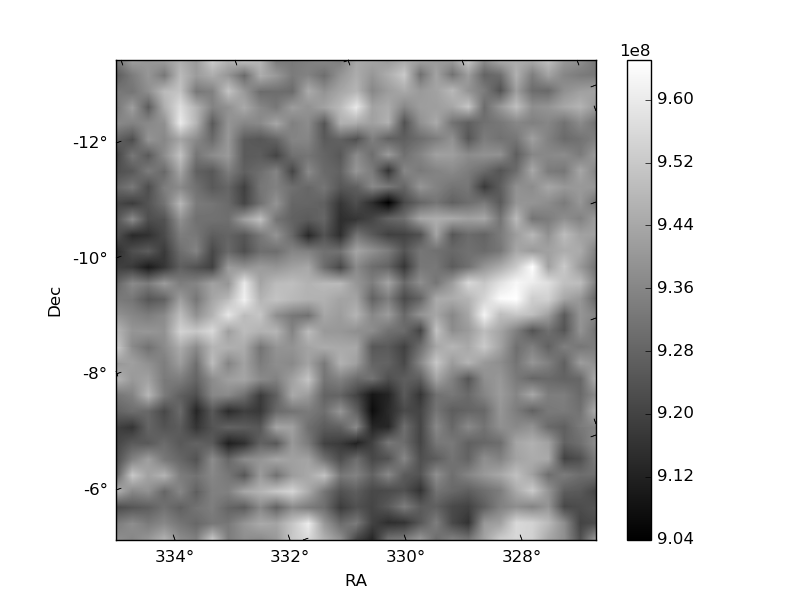
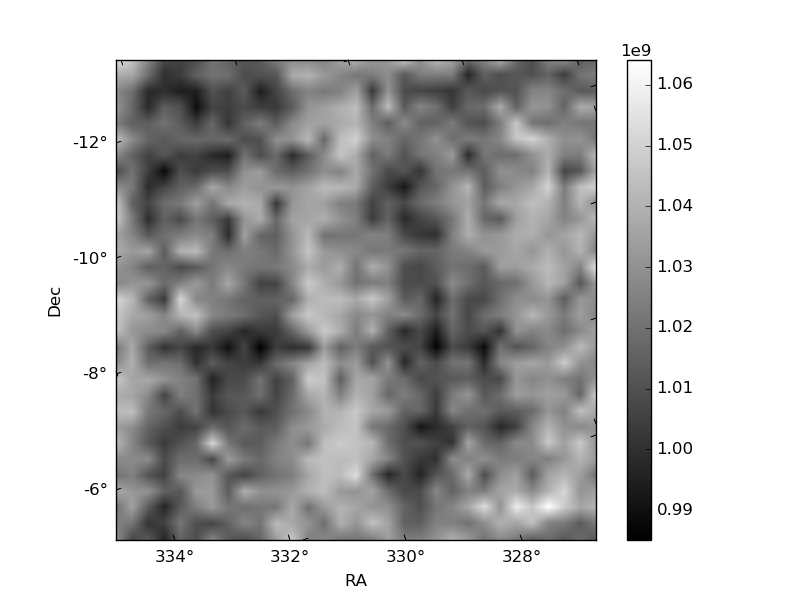
Histogram calculated using DETX and DETY for each event in the final _common_clean file
| Quadrant A | 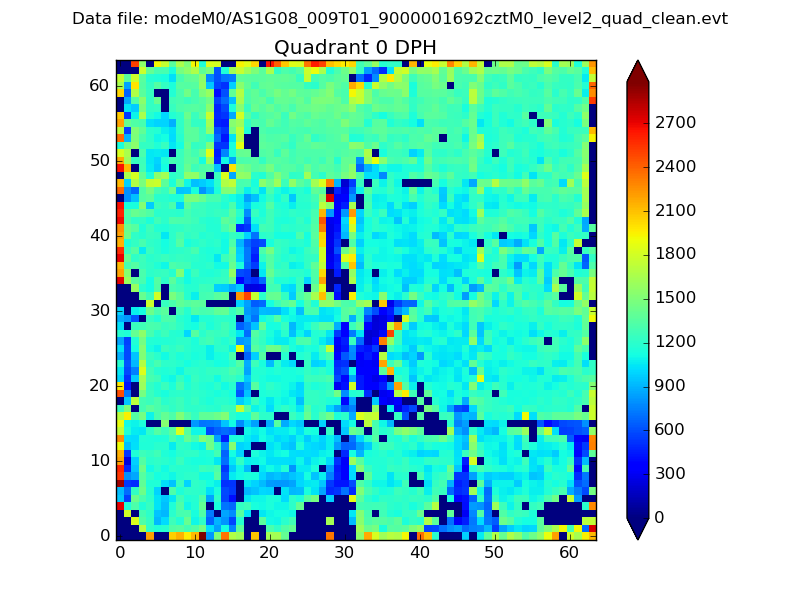 |
 |
Quadrant B |
|---|---|---|---|
| Quadrant D |  |
 |
Quadrant C |
| Plot type | Count rate plots | Images |
|---|---|---|
| Comparison with Poisson distribution Blue bars denote a histogram of data divided into 1 sec bins. Red curve is a Poisson curve with rate = median count rate of data. |
 |
 |
| Quadrant-wise count rates Data is divided into 100 sec bins |
 |
|
| Module-wise count rates for Quadrant A Data is divided into 100 sec bins |
 |
 |
| Module-wise count rates for Quadrant B Data is divided into 100 sec bins |
 |
 |
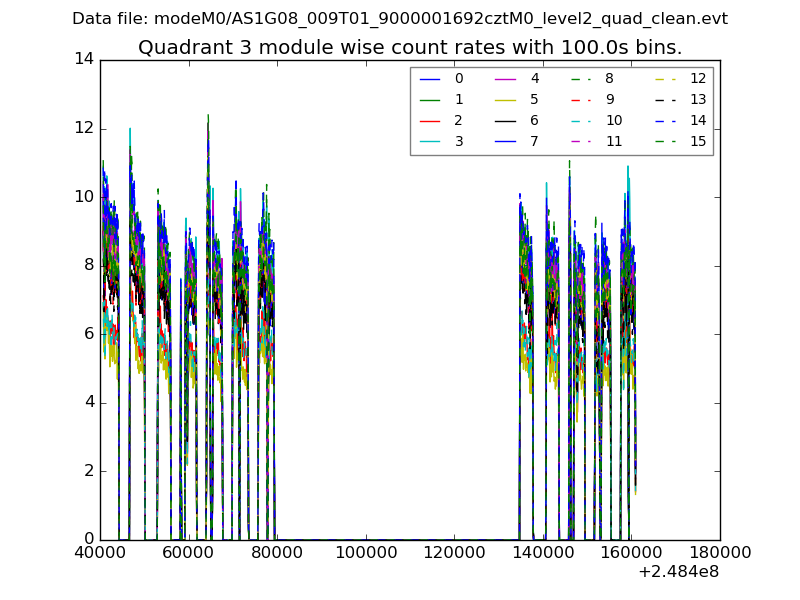
| Module-wise count rates for Quadrant C Data is divided into 100 sec bins |
 |
 |
| Module-wise count rates for Quadrant D Data is divided into 100 sec bins |
 |
 |
| Parameter | Plot |
|---|---|
| CZT HV Monitor |  |
| D_VDD |  |
| Temperature 1 |  |
| Veto HV Monitor |  |
| Veto LLD | 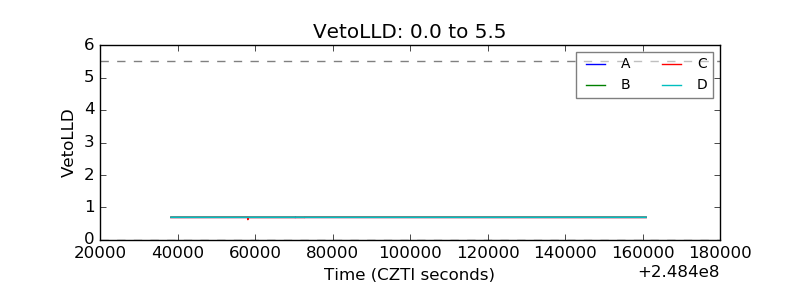 |
| Alpha Counter |  |
| _CPM_Rate |  |
| CZT Counter |  |
| +2.5 Volts monitor |  |
| +5 Volts monitor |  |
| _ROLL_ROT |  |
| _Roll_DEC | 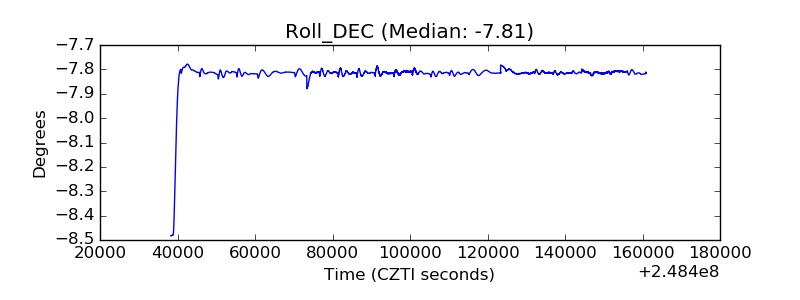 |
| _Roll_RA |  |
| Veto Counter |  |