| Param | Original file | Final file |
|---|---|---|
| Filename | modeM0/AS1G08_009T01_9000001692_11535cztM0_level2.evt | modeM0/AS1G08_009T01_9000001692_11535cztM0_level2_quad_clean.evt |
| Size (bytes) | 225,910,080 | 28,995,840 |
| Size | 215.4 MB | 27.7 MB |
| Events in quadrant A | 1,815,215 | 180,168 |
| Events in quadrant B | 1,587,965 | 184,166 |
| Events in quadrant C | 1,221,160 | 183,066 |
| Events in quadrant D | 2,058,470 | 163,222 |
| Mode M0 | |||
|---|---|---|---|
| Quadrant | BADHDUFLAG | Total packets | Discarded packets |
| A | 0 | 7044 | 2 |
| B | 0 | 6283 | 1 |
| C | 0 | 5000 | 1 |
| D | 0 | 7657 | 1 |
| Mode M9 | |||
|---|---|---|---|
| Quadrant | BADHDUFLAG | Total packets | Discarded packets |
| A | 0 | 13 | 0 |
| B | 0 | 13 | 0 |
| C | 0 | 13 | 0 |
| D | 0 | 13 | 0 |
| Mode SS | |||
|---|---|---|---|
| Quadrant | BADHDUFLAG | Total packets | Discarded packets |
| A | 0 | 48 | 0 |
| B | 0 | 48 | 0 |
| C | 0 | 48 | 0 |
| D | 0 | 48 | 0 |
| Quadrant | Total seconds | Saturated seconds | Saturation percentage |
|---|---|---|---|
| A | 2313 | 179 | 7.738867% |
| B | 2313 | 164 | 7.090359% |
| C | 2313 | 43 | 1.859058% |
| D | 2313 | 271 | 11.716386% |
Noise dominated data is calculated using 1-second bins in cleaned event files. If a bin has >2000 counts, and if more than 50% of those come from <1% of pixels, then it is considered to be noise-dominated and hence unusable.
| Quadrant | # 1 sec bins | Bins with >0 counts | Bins with >2000 counts | High rate bins dominated by noise | Noise dominated (total time) | Noise dominated (detector-on time) | Marked lightcurve |
|---|---|---|---|---|---|---|---|
| A | 3599 | 2315 | 57 | 57 | 1.58% | 2.46% | 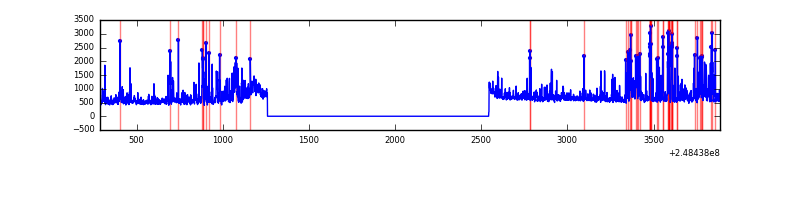 |
| B | 3599 | 2315 | 56 | 56 | 1.56% | 2.42% | 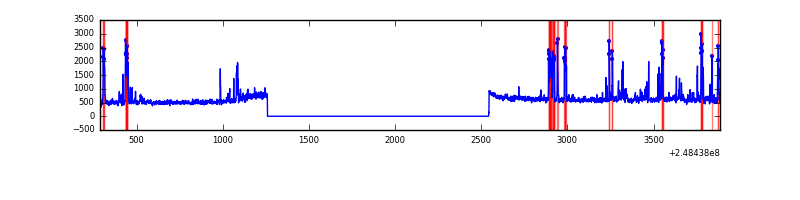 |
| C | 3599 | 2315 | 0 | 0 | 0.00% | 0.00% |  |
| D | 3599 | 2315 | 155 | 155 | 4.31% | 6.70% | 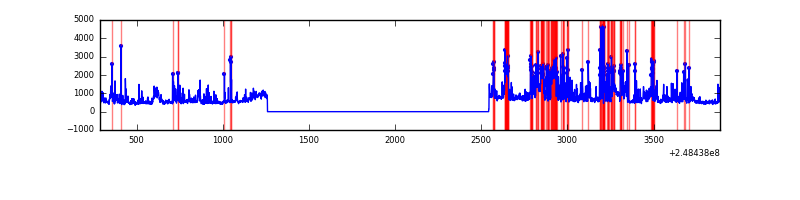 |
Top three noisy pixels from each quadrant. If the there are fewer than three noisy pixels in the level2.evt file, extra rows are filled as -1
| Pixel properties | Quadrant properties | ||||||
|---|---|---|---|---|---|---|---|
| Quadrant | DetID | PixID | Counts | Sigma | Mean | Median | Sigma |
| A | 8 | 5 | 487970 | 7259.74 | 322 | 316 | 67.2 |
| A | 1 | 162 | 31796 | 468.65 | 322 | 316 | 67.2 |
| A | 1 | 178 | 17814 | 260.49 | 322 | 316 | 67.2 |
| B | 4 | 239 | 280491 | 4480.35 | 320 | 313 | 62.5 |
| B | 15 | 204 | 33963 | 538.1 | 320 | 313 | 62.5 |
| B | 0 | 187 | 7932 | 121.84 | 320 | 313 | 62.5 |
| C | 13 | 61 | 2290 | 26.74 | 312 | 314 | 73.9 |
| C | 12 | 4 | 1786 | 19.92 | 312 | 314 | 73.9 |
| C | 3 | 202 | 751 | 5.91 | 312 | 314 | 73.9 |
| D | 1 | 52 | 796242 | 10800.65 | 302 | 293 | 73.7 |
| D | 13 | 137 | 44861 | 604.77 | 302 | 293 | 73.7 |
| D | 2 | 120 | 37843 | 509.54 | 302 | 293 | 73.7 |
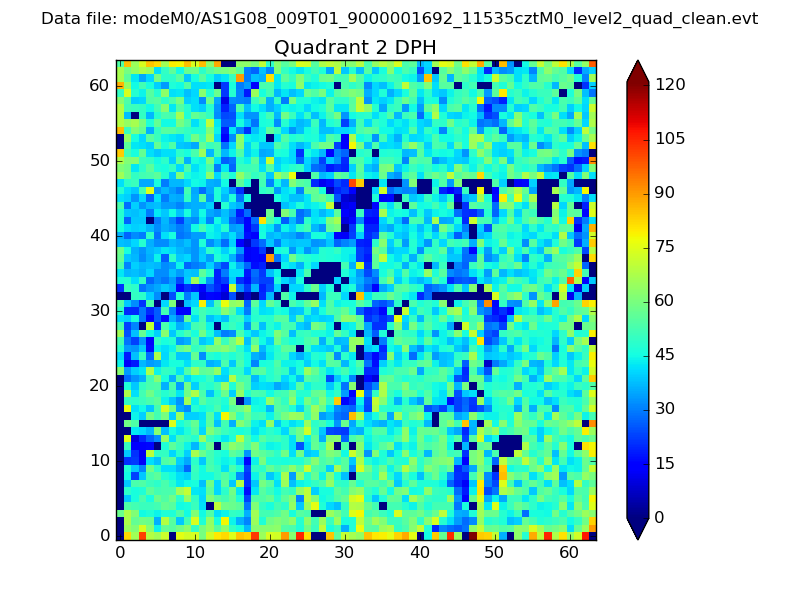
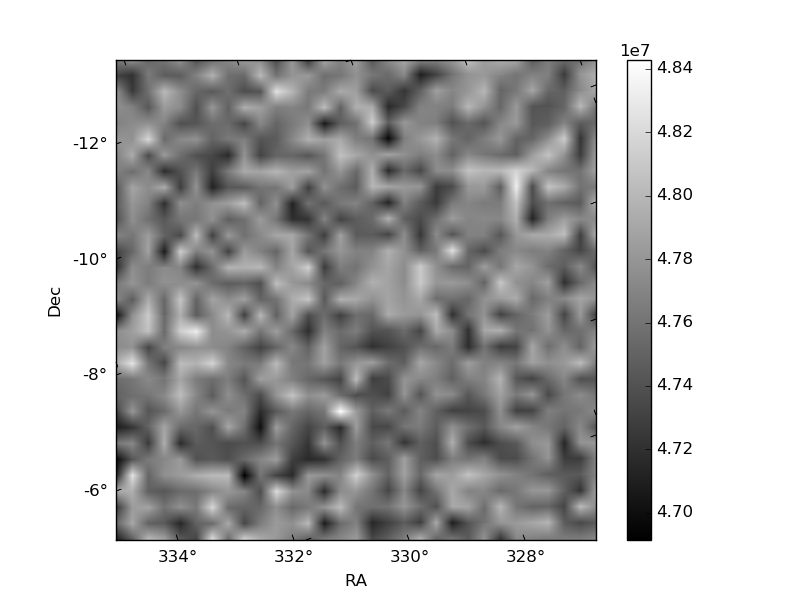
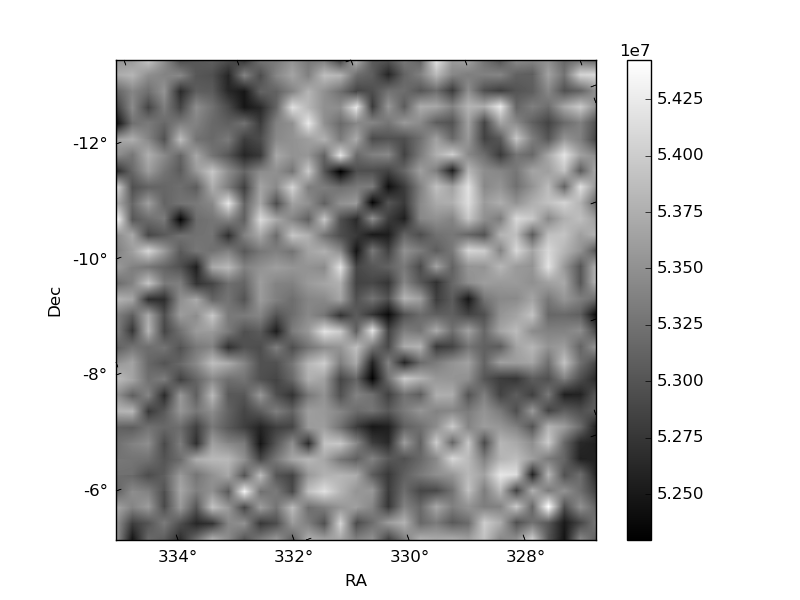
Histogram calculated using DETX and DETY for each event in the final _common_clean file
| Quadrant A | 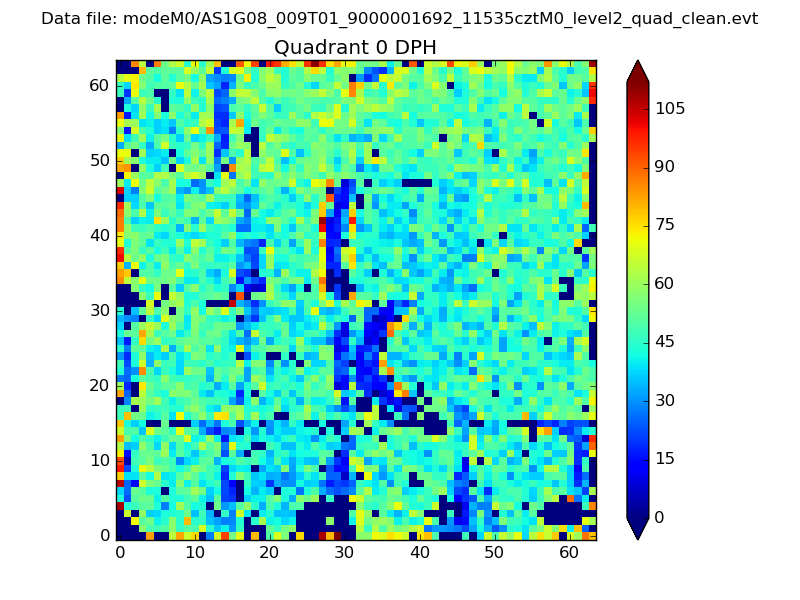 |
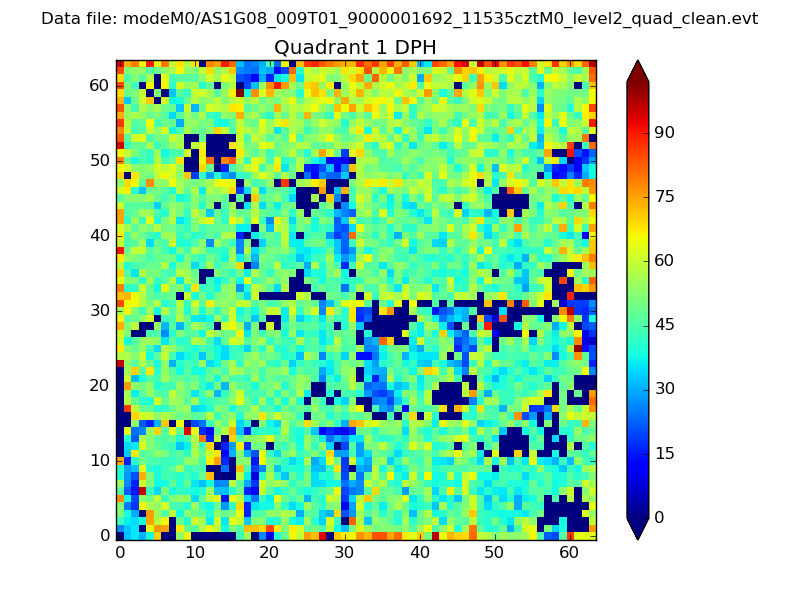 |
Quadrant B |
|---|---|---|---|
| Quadrant D | 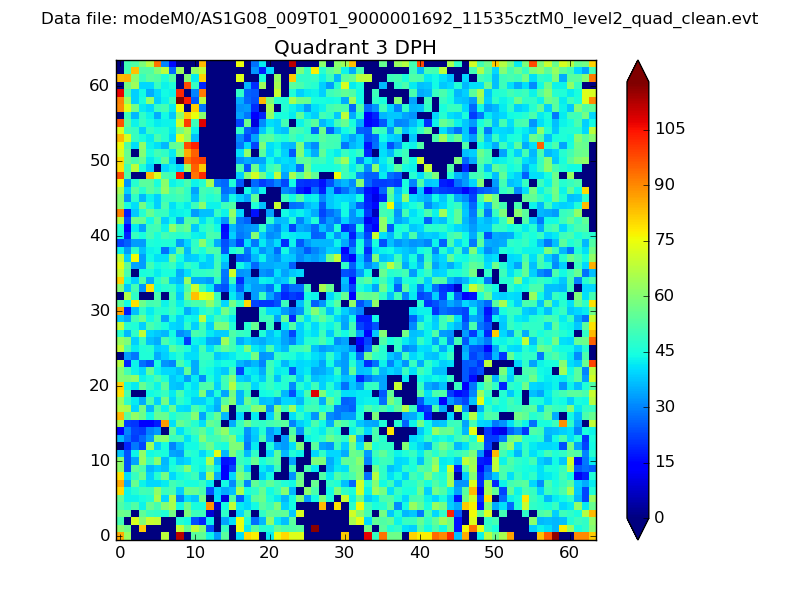 |
 |
Quadrant C |
| Plot type | Count rate plots | Images |
|---|---|---|
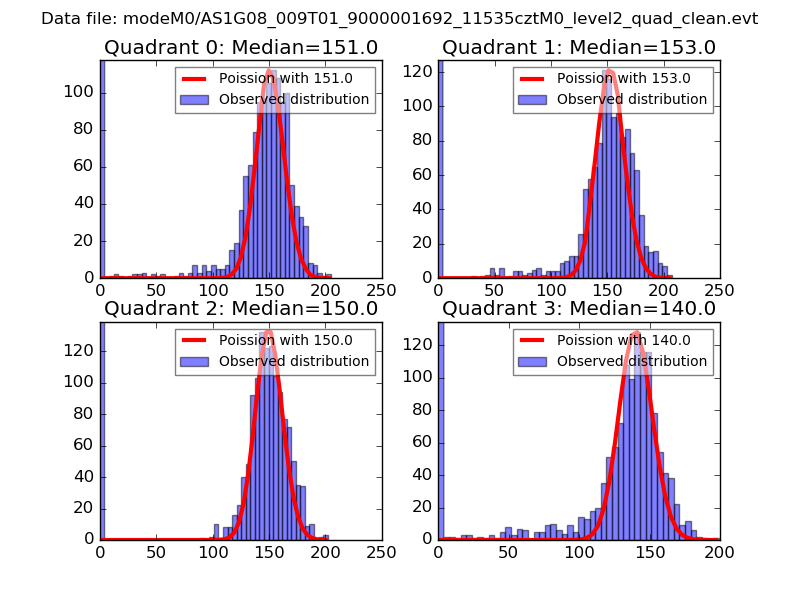
| Comparison with Poisson distribution Blue bars denote a histogram of data divided into 1 sec bins. Red curve is a Poisson curve with rate = median count rate of data. |
 |
 |
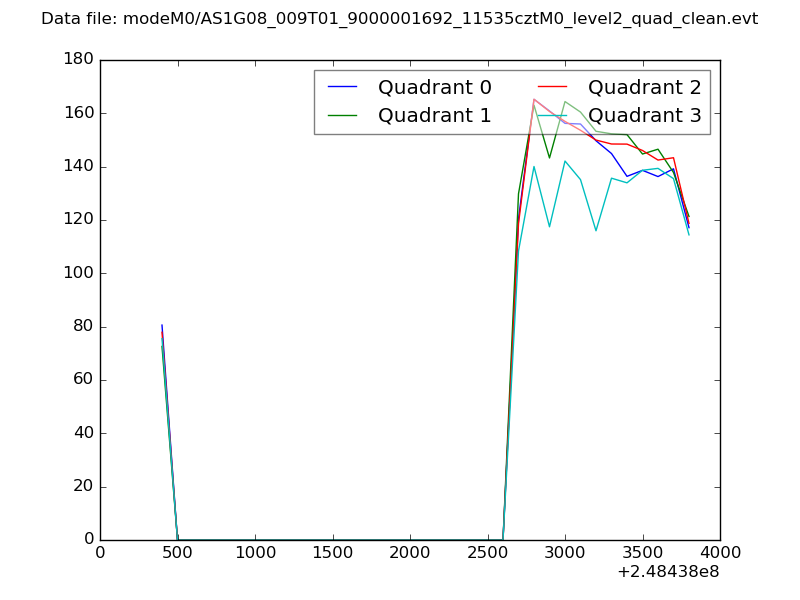
| Quadrant-wise count rates Data is divided into 100 sec bins |
 |
|
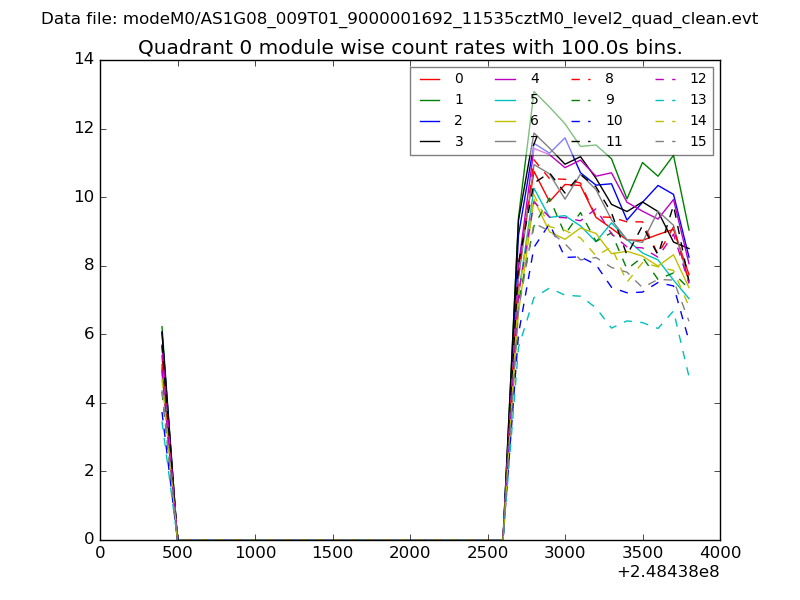
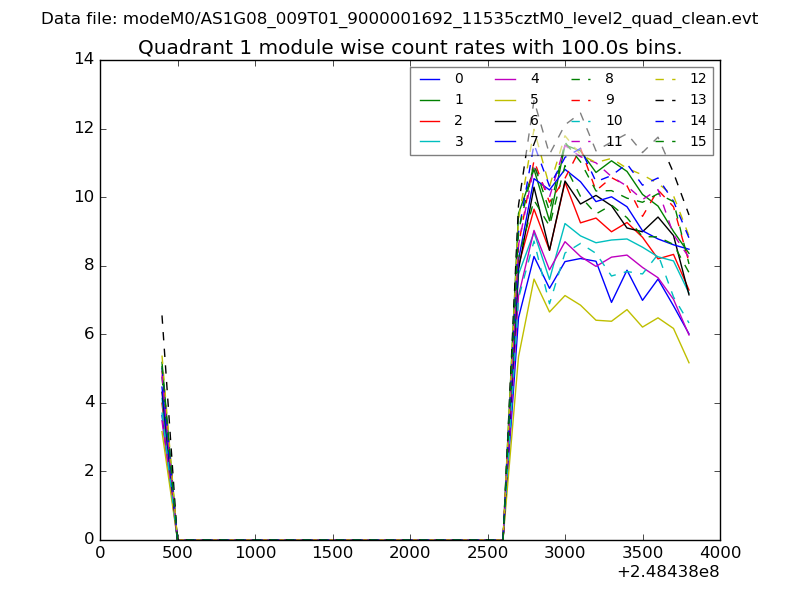
| Module-wise count rates for Quadrant A Data is divided into 100 sec bins |
 |
 |
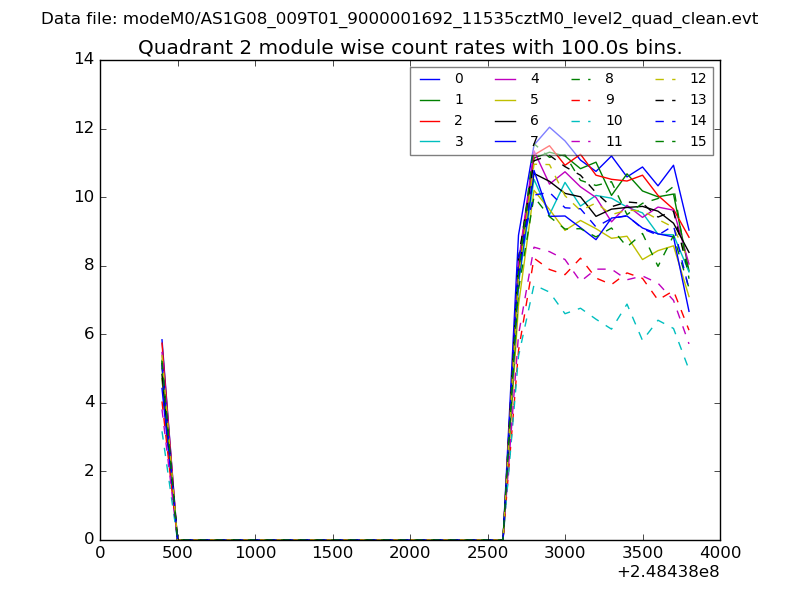
| Module-wise count rates for Quadrant B Data is divided into 100 sec bins |
 |
 |
| Module-wise count rates for Quadrant C Data is divided into 100 sec bins |
 |
 |
| Module-wise count rates for Quadrant D Data is divided into 100 sec bins |
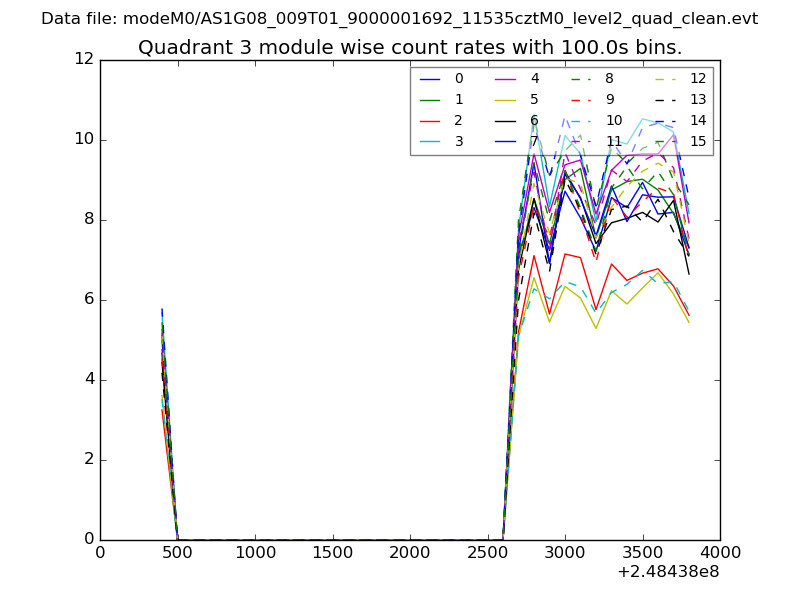 |
 |
| Parameter | Plot |
|---|---|
| CZT HV Monitor | 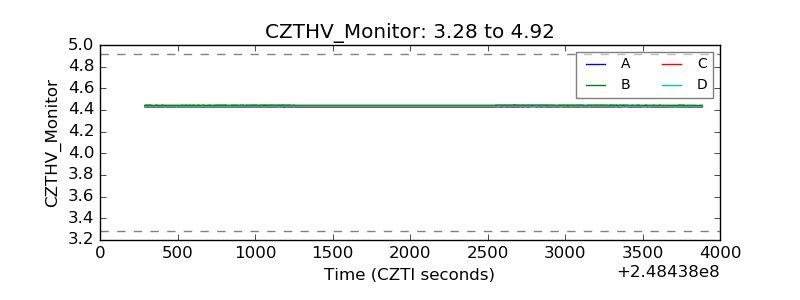 |
| D_VDD | 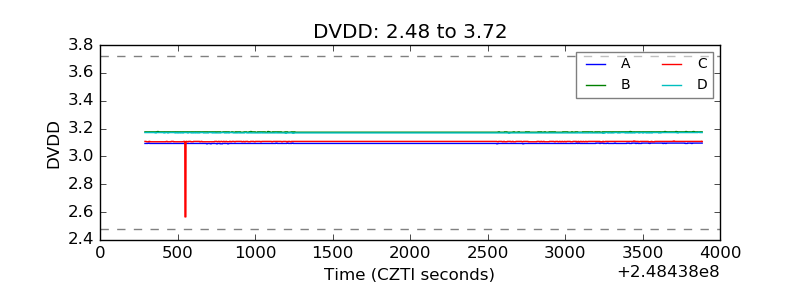 |
| Temperature 1 | 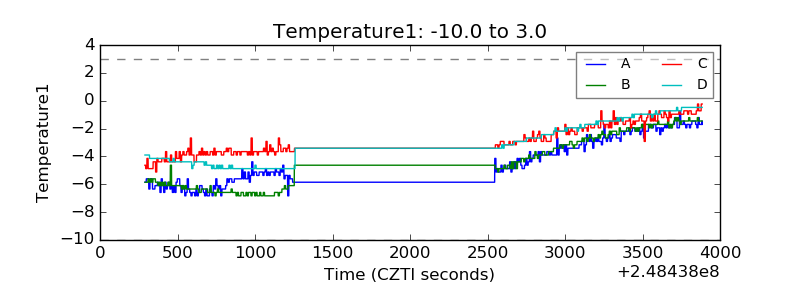 |
| Veto HV Monitor | 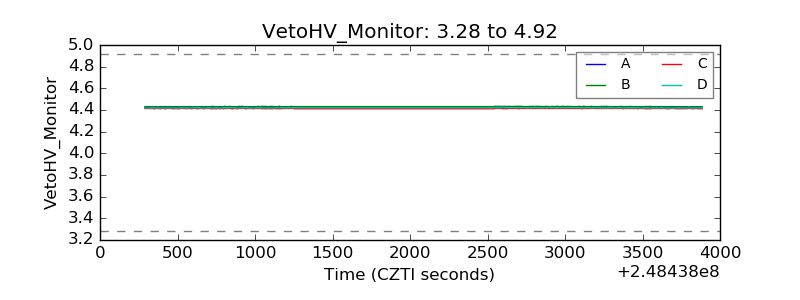 |
| Veto LLD |  |
| Alpha Counter | 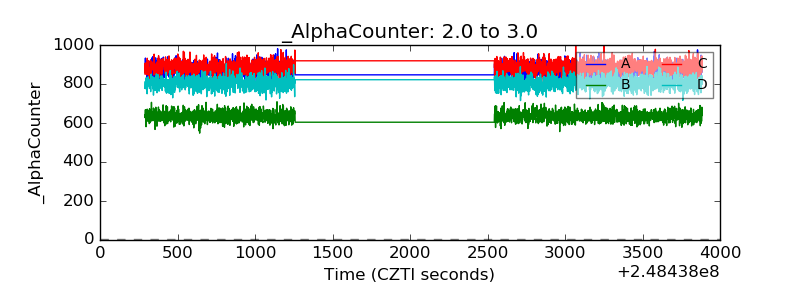 |
| _CPM_Rate | 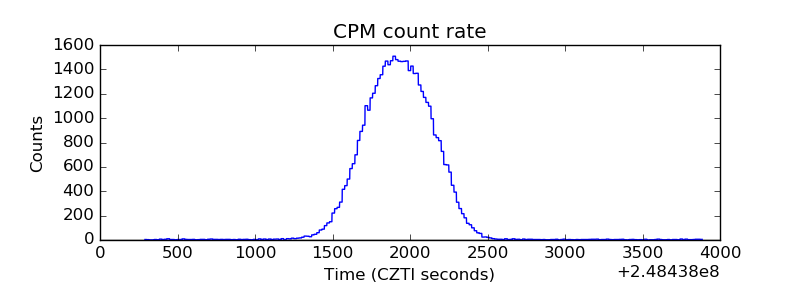 |
| CZT Counter | 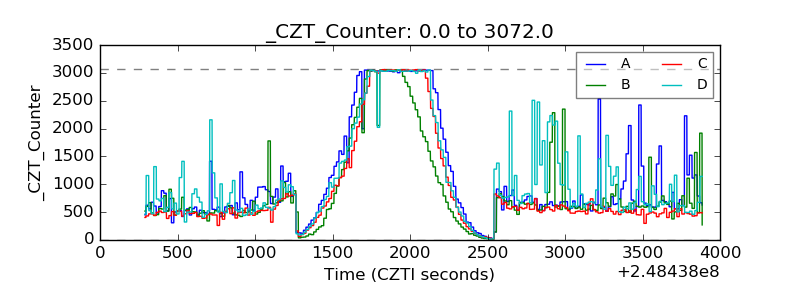 |
| +2.5 Volts monitor |  |
| +5 Volts monitor |  |
| _ROLL_ROT | 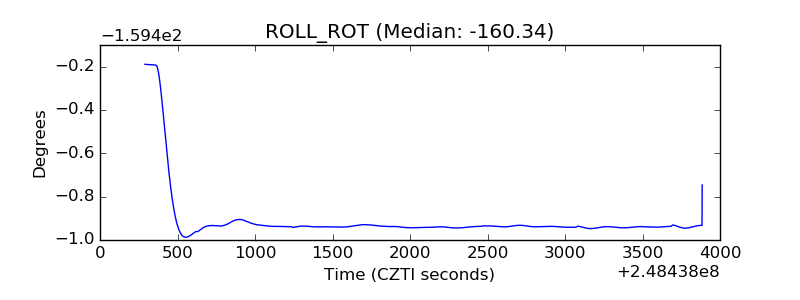 |
| _Roll_DEC | 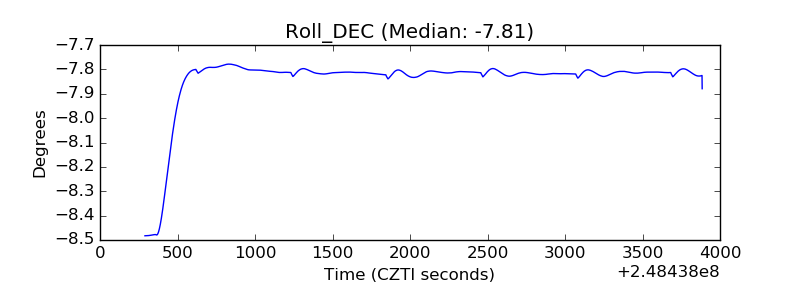 |
| _Roll_RA | 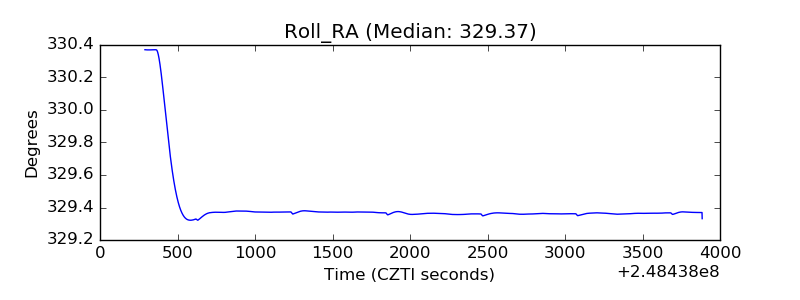 |
| Veto Counter | 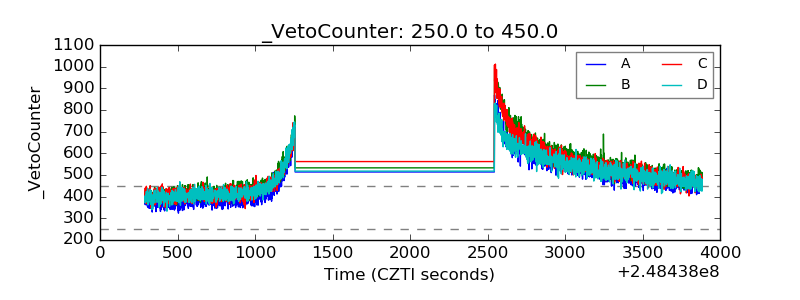 |