| Param | Original file | Final file |
|---|---|---|
| Filename | modeM0/AS1G08_009T01_9000001692_11538cztM0_level2.evt | modeM0/AS1G08_009T01_9000001692_11538cztM0_level2_quad_clean.evt |
| Size (bytes) | 571,049,280 | 85,000,320 |
| Size | 544.6 MB | 81.1 MB |
| Events in quadrant A | 5,092,098 | 522,336 |
| Events in quadrant B | 4,375,724 | 541,947 |
| Events in quadrant C | 2,982,346 | 542,401 |
| Events in quadrant D | 4,394,616 | 504,186 |
| Mode M0 | |||
|---|---|---|---|
| Quadrant | BADHDUFLAG | Total packets | Discarded packets |
| A | 0 | 19675 | 2 |
| B | 0 | 17348 | 1 |
| C | 0 | 13603 | 1 |
| D | 0 | 17600 | 1 |
| Mode M9 | |||
|---|---|---|---|
| Quadrant | BADHDUFLAG | Total packets | Discarded packets |
| A | 0 | 9 | 0 |
| B | 0 | 9 | 0 |
| C | 0 | 9 | 0 |
| D | 0 | 9 | 0 |
| Mode SS | |||
|---|---|---|---|
| Quadrant | BADHDUFLAG | Total packets | Discarded packets |
| A | 0 | 136 | 0 |
| B | 0 | 136 | 0 |
| C | 0 | 136 | 0 |
| D | 0 | 136 | 0 |
| Quadrant | Total seconds | Saturated seconds | Saturation percentage |
|---|---|---|---|
| A | 6631 | 436 | 6.575177% |
| B | 6631 | 280 | 4.222591% |
| C | 6631 | 35 | 0.527824% |
| D | 6631 | 380 | 5.730659% |
Noise dominated data is calculated using 1-second bins in cleaned event files. If a bin has >2000 counts, and if more than 50% of those come from <1% of pixels, then it is considered to be noise-dominated and hence unusable.
| Quadrant | # 1 sec bins | Bins with >0 counts | Bins with >2000 counts | High rate bins dominated by noise | Noise dominated (total time) | Noise dominated (detector-on time) | Marked lightcurve |
|---|---|---|---|---|---|---|---|
| A | 7552 | 6633 | 188 | 188 | 2.49% | 2.83% | 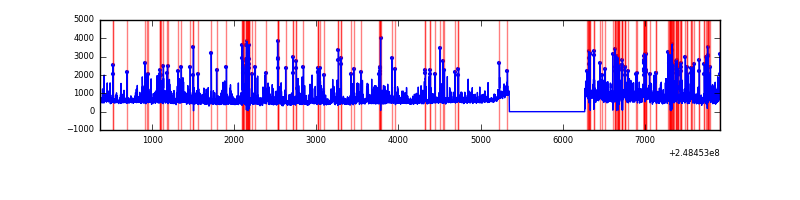 |
| B | 7552 | 6633 | 127 | 127 | 1.68% | 1.91% | 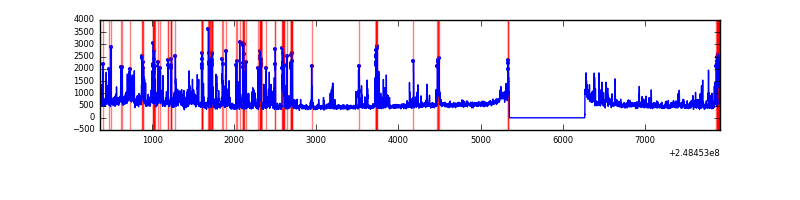 |
| C | 7552 | 6633 | 0 | 0 | 0.00% | 0.00% | 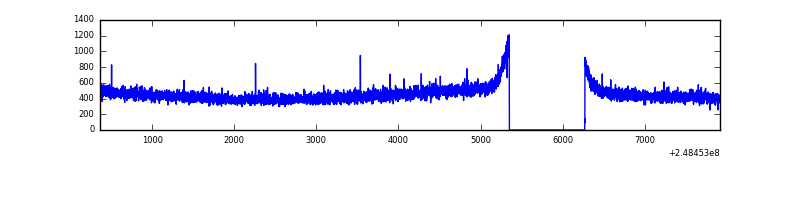 |
| D | 7552 | 6633 | 283 | 283 | 3.75% | 4.27% | 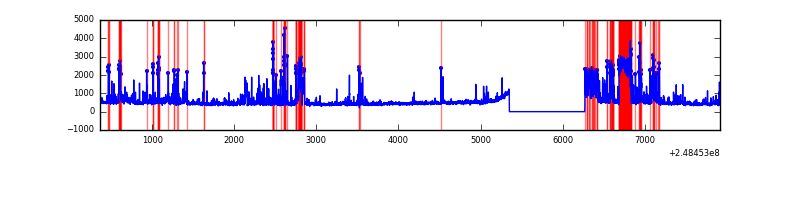 |
Top three noisy pixels from each quadrant. If the there are fewer than three noisy pixels in the level2.evt file, extra rows are filled as -1
| Pixel properties | Quadrant properties | ||||||
|---|---|---|---|---|---|---|---|
| Quadrant | DetID | PixID | Counts | Sigma | Mean | Median | Sigma |
| A | 8 | 5 | 1723299 | 10795.57 | 775 | 758 | 159.6 |
| A | 9 | 143 | 108526 | 675.41 | 775 | 758 | 159.6 |
| A | 1 | 162 | 103274 | 642.49 | 775 | 758 | 159.6 |
| B | 4 | 239 | 972626 | 6397.58 | 789 | 772 | 151.9 |
| B | 15 | 204 | 201970 | 1324.46 | 789 | 772 | 151.9 |
| B | 11 | 51 | 64062 | 416.63 | 789 | 772 | 151.9 |
| C | 13 | 61 | 5614 | 27.13 | 764 | 769 | 178.6 |
| C | 14 | 234 | 2879 | 11.81 | 764 | 769 | 178.6 |
| C | 3 | 202 | 1908 | 6.38 | 764 | 769 | 178.6 |
| D | 1 | 52 | 923328 | 5113.02 | 750 | 731 | 180.4 |
| D | 10 | 157 | 335045 | 1852.76 | 750 | 731 | 180.4 |
| D | 2 | 120 | 119876 | 660.3 | 750 | 731 | 180.4 |
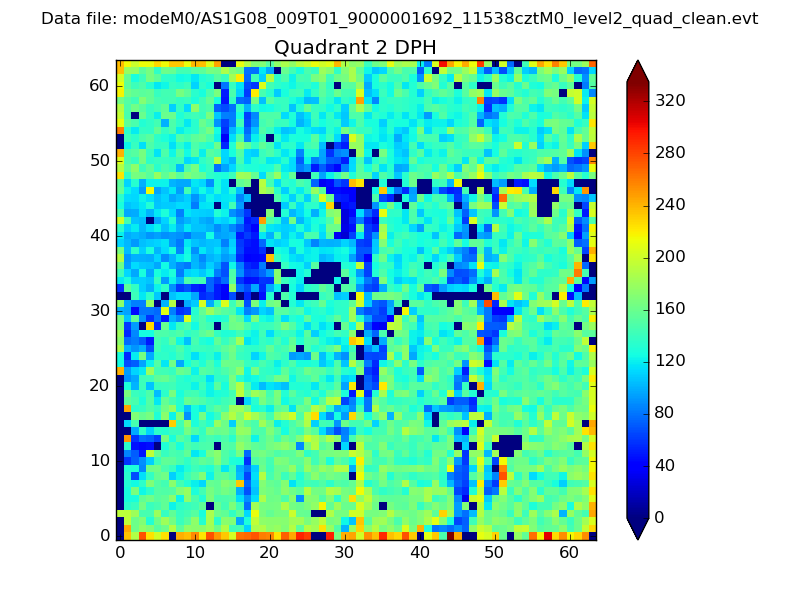
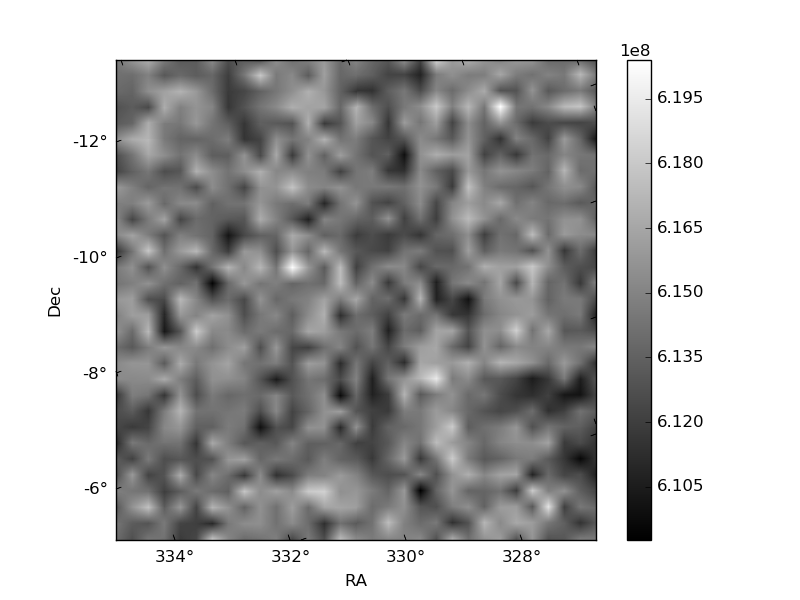
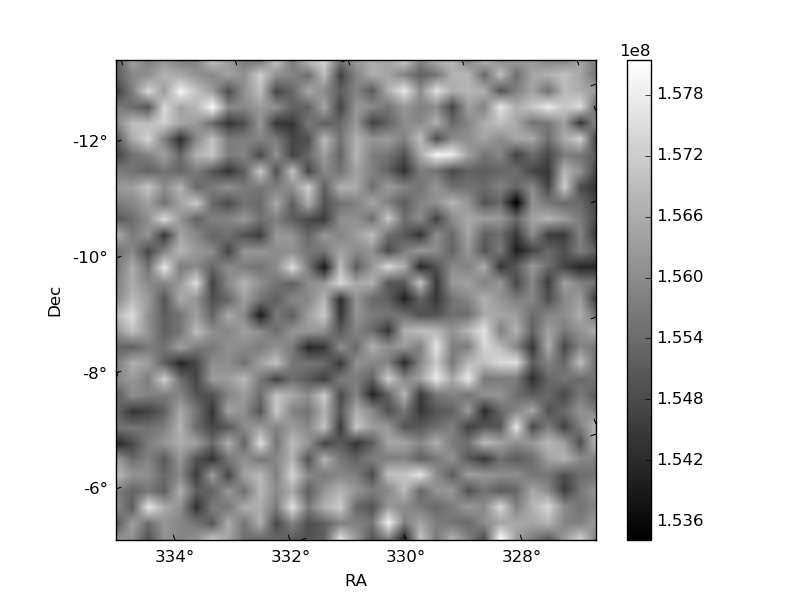
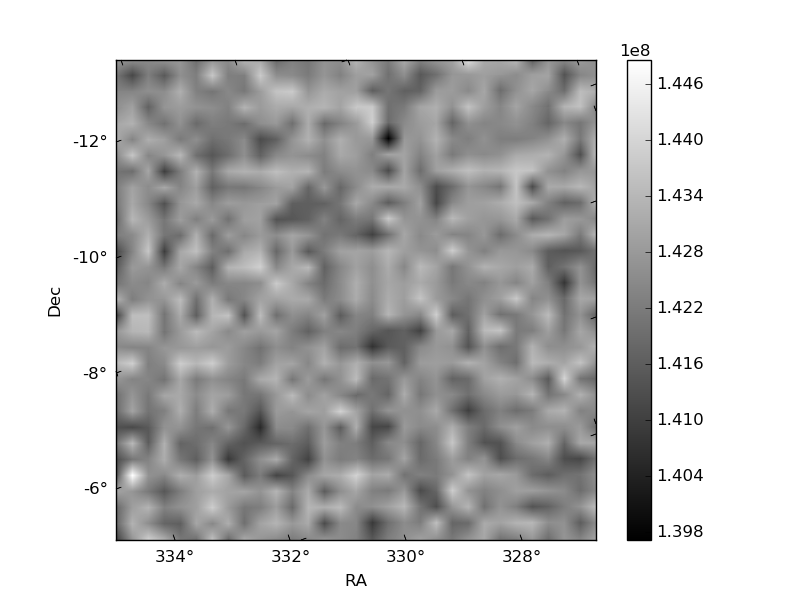
Histogram calculated using DETX and DETY for each event in the final _common_clean file
| Quadrant A | 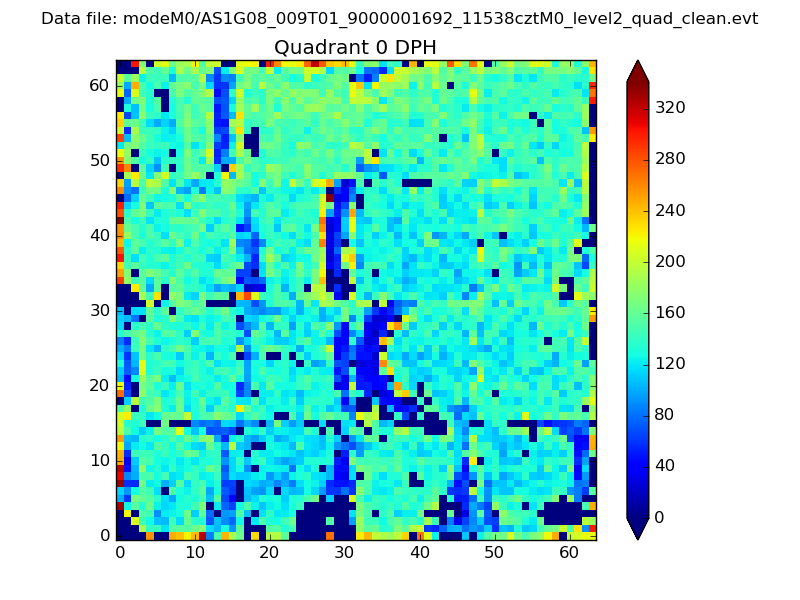 |
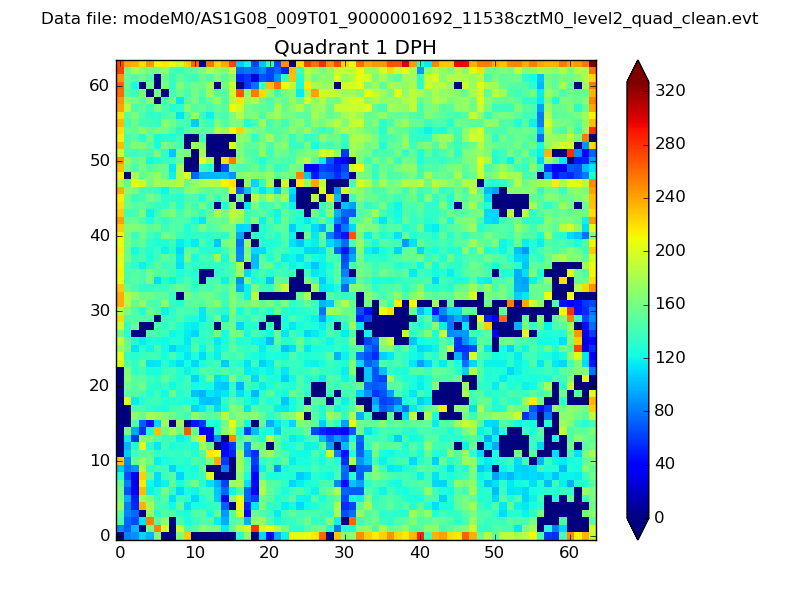 |
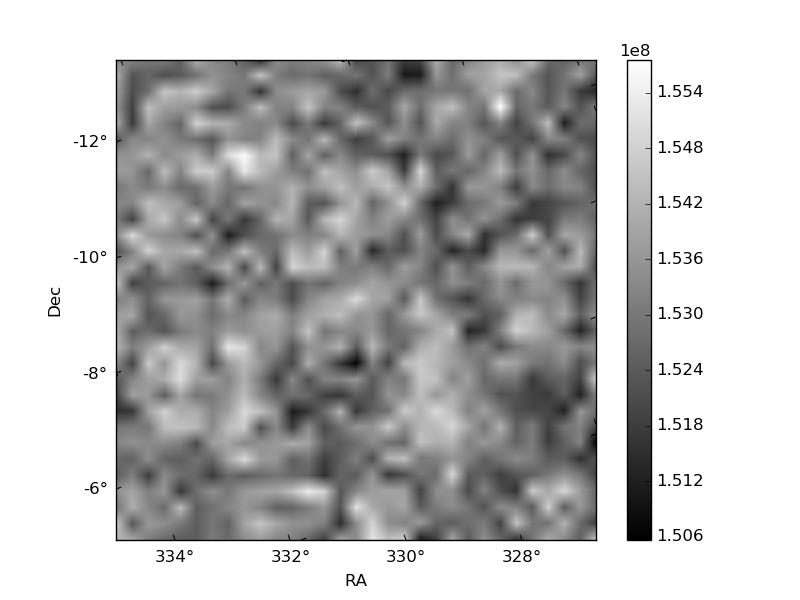
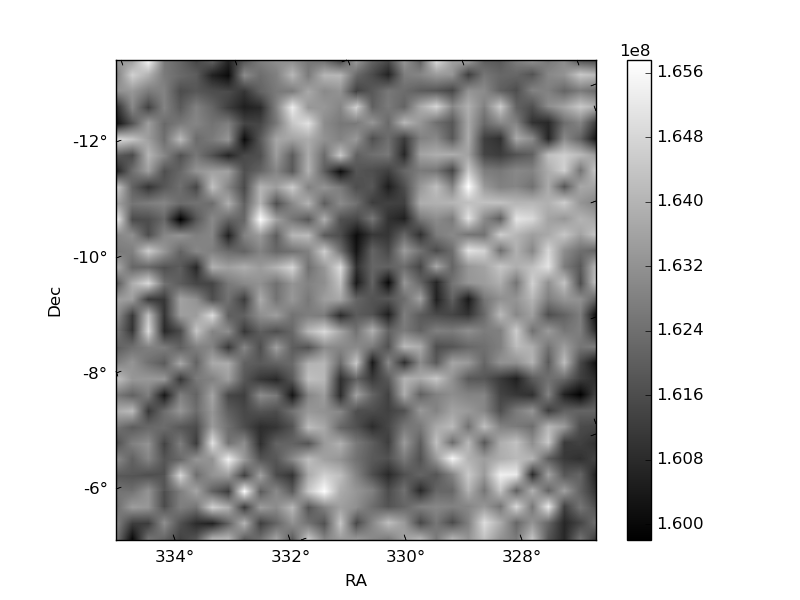
Quadrant B |
|---|---|---|---|
| Quadrant D | 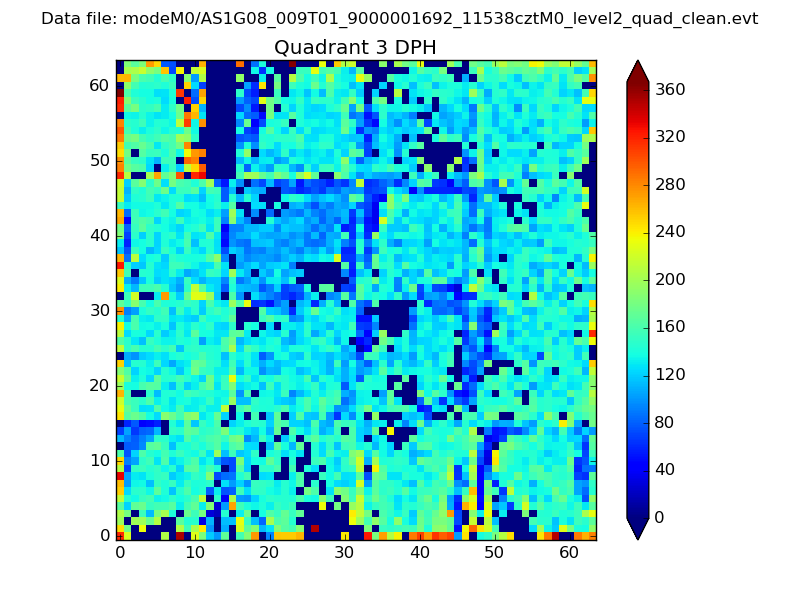 |
 |
Quadrant C |
| Plot type | Count rate plots | Images |
|---|---|---|
| Comparison with Poisson distribution Blue bars denote a histogram of data divided into 1 sec bins. Red curve is a Poisson curve with rate = median count rate of data. |
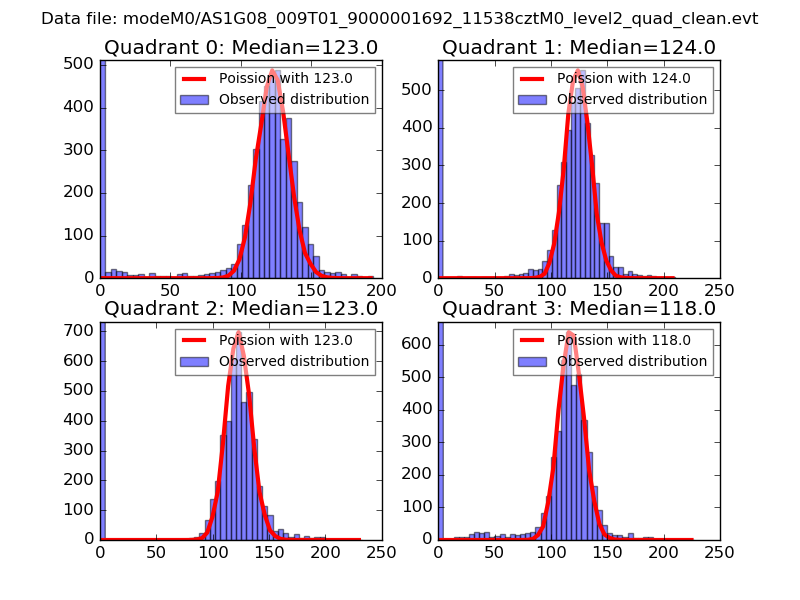 |
 |
| Quadrant-wise count rates Data is divided into 100 sec bins |
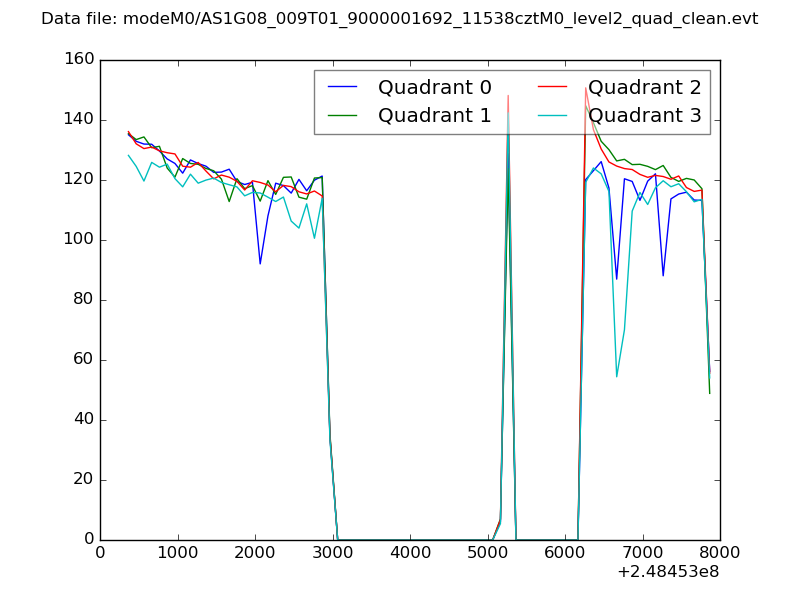 |
|
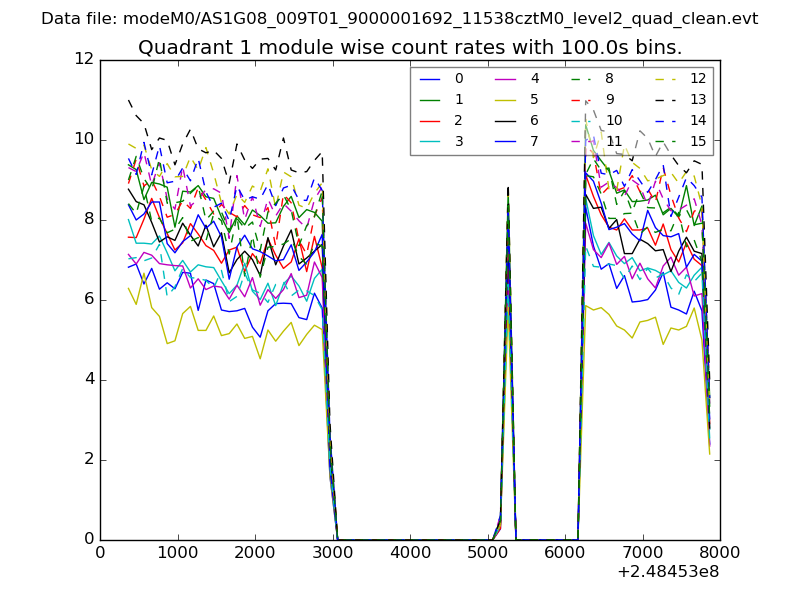
| Module-wise count rates for Quadrant A Data is divided into 100 sec bins |
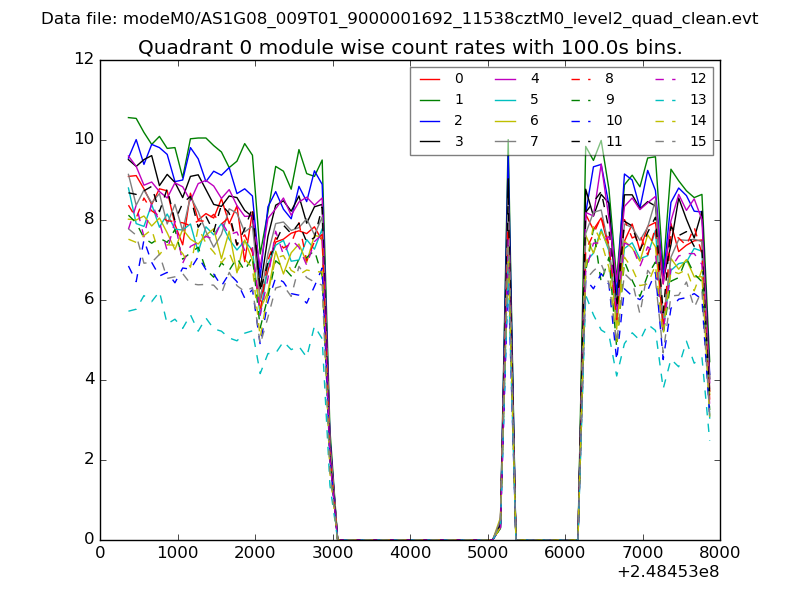 |
 |
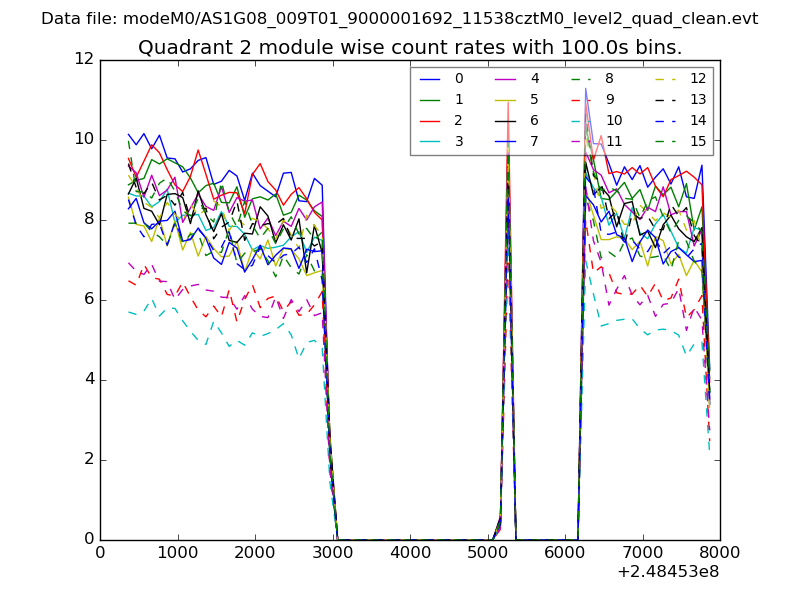
| Module-wise count rates for Quadrant B Data is divided into 100 sec bins |
 |
 |
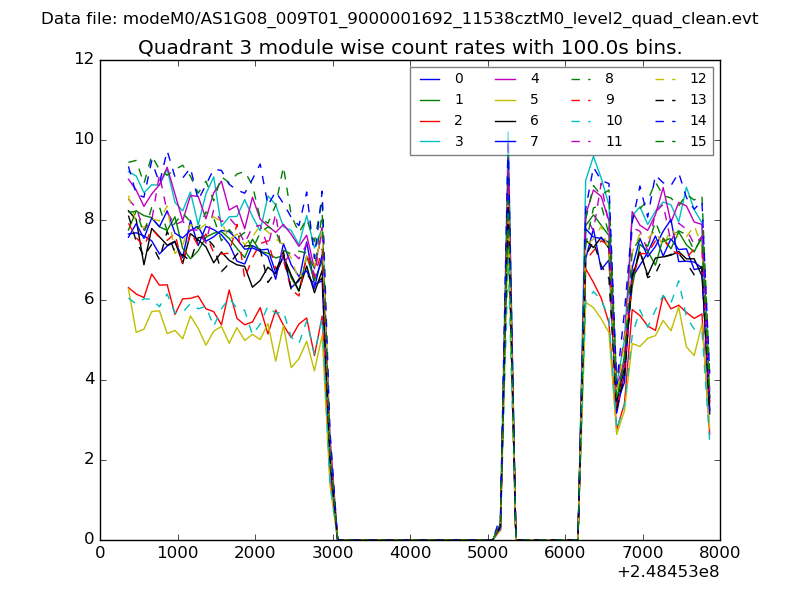
| Module-wise count rates for Quadrant C Data is divided into 100 sec bins |
 |
 |
| Module-wise count rates for Quadrant D Data is divided into 100 sec bins |
 |
 |
| Parameter | Plot |
|---|---|
| CZT HV Monitor | 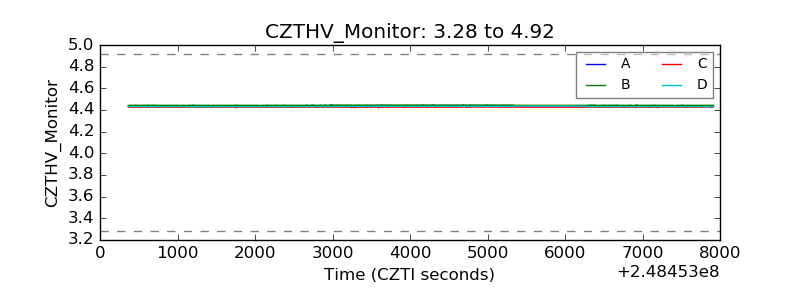 |
| D_VDD | 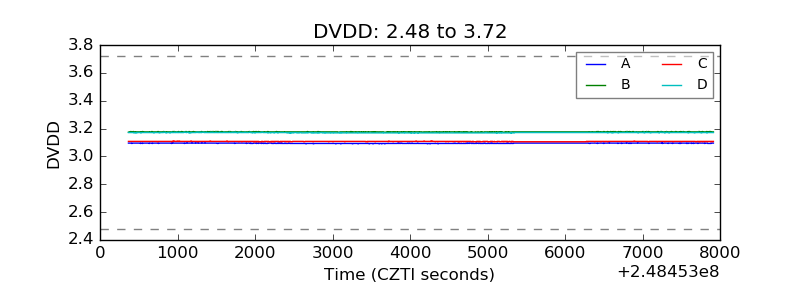 |
| Temperature 1 | 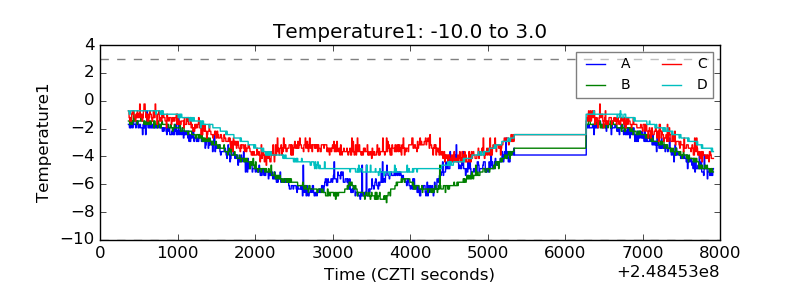 |
| Veto HV Monitor | 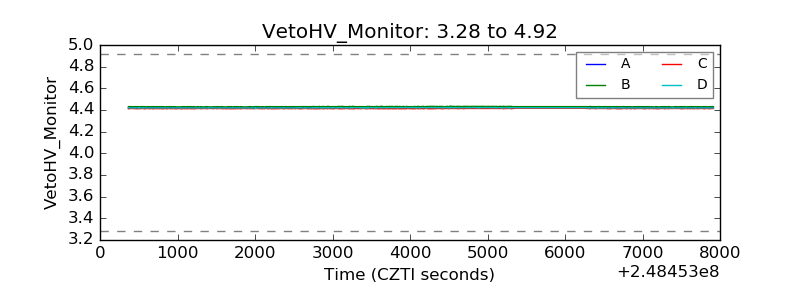 |
| Veto LLD | 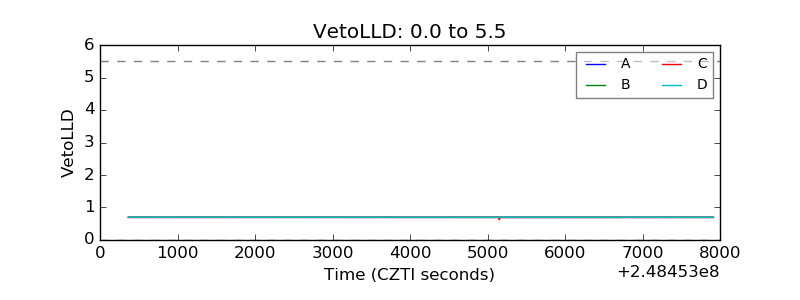 |
| Alpha Counter | 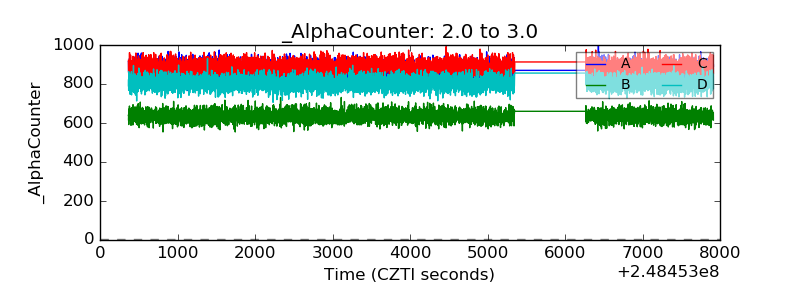 |
| _CPM_Rate | 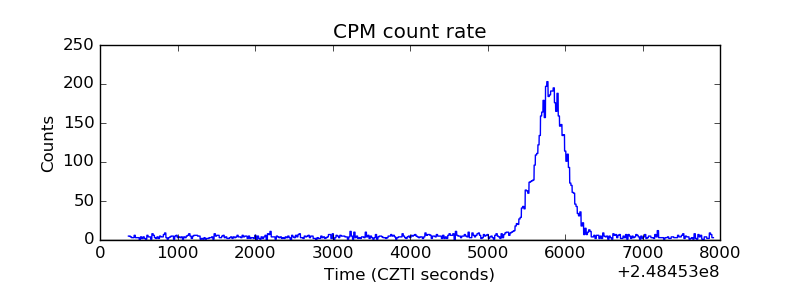 |
| CZT Counter | 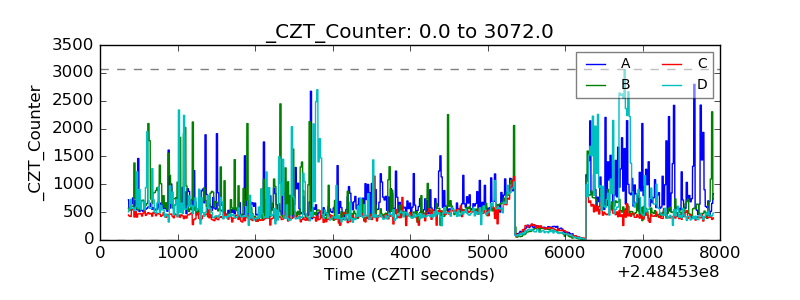 |
| +2.5 Volts monitor |  |
| +5 Volts monitor |  |
| _ROLL_ROT | 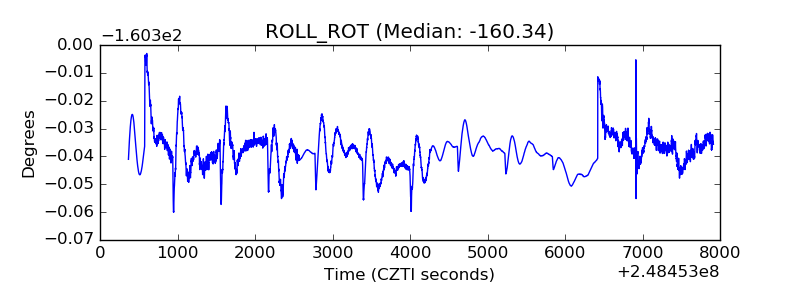 |
| _Roll_DEC | 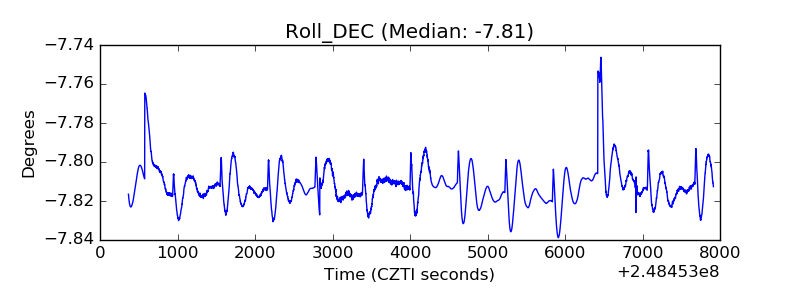 |
| _Roll_RA | 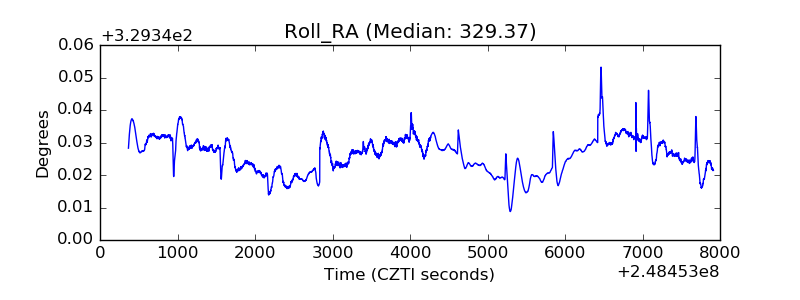 |
| Veto Counter | 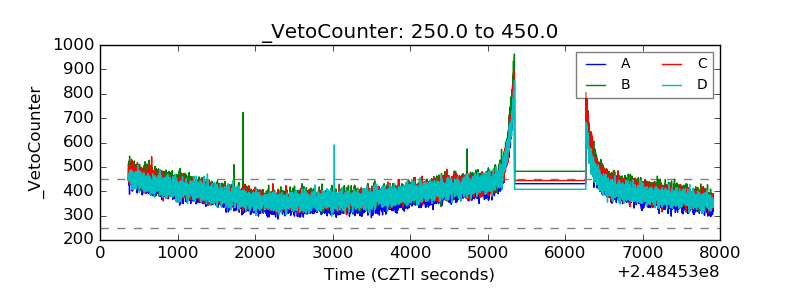 |