| Param | Original file | Final file |
|---|---|---|
| Filename | modeM0/AS1G08_009T01_9000001692_11539cztM0_level2.evt | modeM0/AS1G08_009T01_9000001692_11539cztM0_level2_quad_clean.evt |
| Size (bytes) | 555,958,080 | 89,547,840 |
| Size | 530.2 MB | 85.4 MB |
| Events in quadrant A | 4,788,496 | 555,827 |
| Events in quadrant B | 4,370,379 | 568,562 |
| Events in quadrant C | 3,062,983 | 571,250 |
| Events in quadrant D | 4,150,001 | 537,828 |
| Mode M0 | |||
|---|---|---|---|
| Quadrant | BADHDUFLAG | Total packets | Discarded packets |
| A | 0 | 18881 | 2 |
| B | 0 | 17466 | 1 |
| C | 0 | 14023 | 1 |
| D | 0 | 17187 | 1 |
| Mode M9 | |||
|---|---|---|---|
| Quadrant | BADHDUFLAG | Total packets | Discarded packets |
| A | 0 | 6 | 0 |
| B | 0 | 6 | 0 |
| C | 0 | 6 | 0 |
| D | 0 | 6 | 0 |
| Mode SS | |||
|---|---|---|---|
| Quadrant | BADHDUFLAG | Total packets | Discarded packets |
| A | 0 | 138 | 0 |
| B | 0 | 138 | 0 |
| C | 0 | 138 | 0 |
| D | 0 | 138 | 0 |
| Quadrant | Total seconds | Saturated seconds | Saturation percentage |
|---|---|---|---|
| A | 6865 | 346 | 5.040058% |
| B | 6865 | 323 | 4.705025% |
| C | 6865 | 23 | 0.335033% |
| D | 6865 | 279 | 4.064093% |
Noise dominated data is calculated using 1-second bins in cleaned event files. If a bin has >2000 counts, and if more than 50% of those come from <1% of pixels, then it is considered to be noise-dominated and hence unusable.
| Quadrant | # 1 sec bins | Bins with >0 counts | Bins with >2000 counts | High rate bins dominated by noise | Noise dominated (total time) | Noise dominated (detector-on time) | Marked lightcurve |
|---|---|---|---|---|---|---|---|
| A | 7406 | 6867 | 163 | 163 | 2.20% | 2.37% | 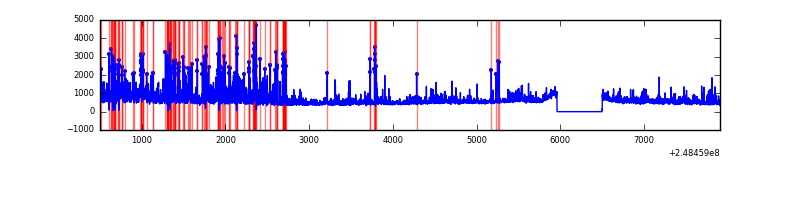 |
| B | 7406 | 6867 | 186 | 186 | 2.51% | 2.71% | 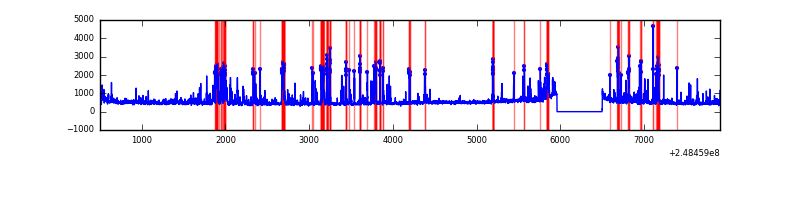 |
| C | 7406 | 6867 | 0 | 0 | 0.00% | 0.00% | 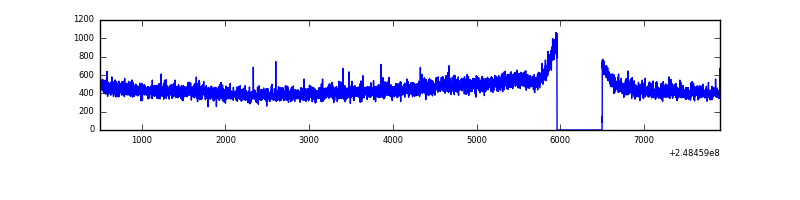 |
| D | 7406 | 6867 | 225 | 225 | 3.04% | 3.28% | 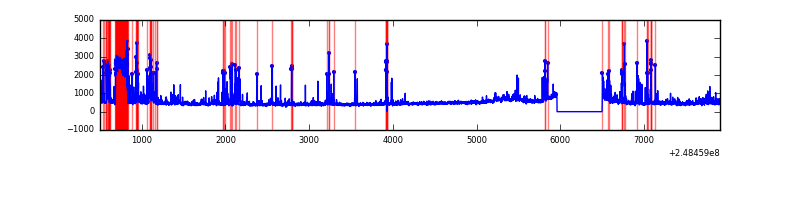 |
Top three noisy pixels from each quadrant. If the there are fewer than three noisy pixels in the level2.evt file, extra rows are filled as -1
| Pixel properties | Quadrant properties | ||||||
|---|---|---|---|---|---|---|---|
| Quadrant | DetID | PixID | Counts | Sigma | Mean | Median | Sigma |
| A | 8 | 5 | 1326809 | 8103.7 | 802 | 784 | 163.6 |
| A | 1 | 162 | 117819 | 715.23 | 802 | 784 | 163.6 |
| A | 1 | 178 | 72453 | 437.99 | 802 | 784 | 163.6 |
| B | 4 | 239 | 1017268 | 6514.74 | 805 | 786 | 156.0 |
| B | 15 | 204 | 141573 | 902.32 | 805 | 786 | 156.0 |
| B | 0 | 197 | 33093 | 207.06 | 805 | 786 | 156.0 |
| C | 13 | 61 | 5808 | 27.19 | 785 | 791 | 184.5 |
| C | 3 | 202 | 1937 | 6.21 | 785 | 791 | 184.5 |
| C | 7 | 247 | 1730 | 5.09 | 785 | 791 | 184.5 |
| D | 1 | 52 | 489134 | 2604.06 | 774 | 753 | 187.5 |
| D | 10 | 157 | 343580 | 1827.96 | 774 | 753 | 187.5 |
| D | 2 | 120 | 102372 | 541.83 | 774 | 753 | 187.5 |
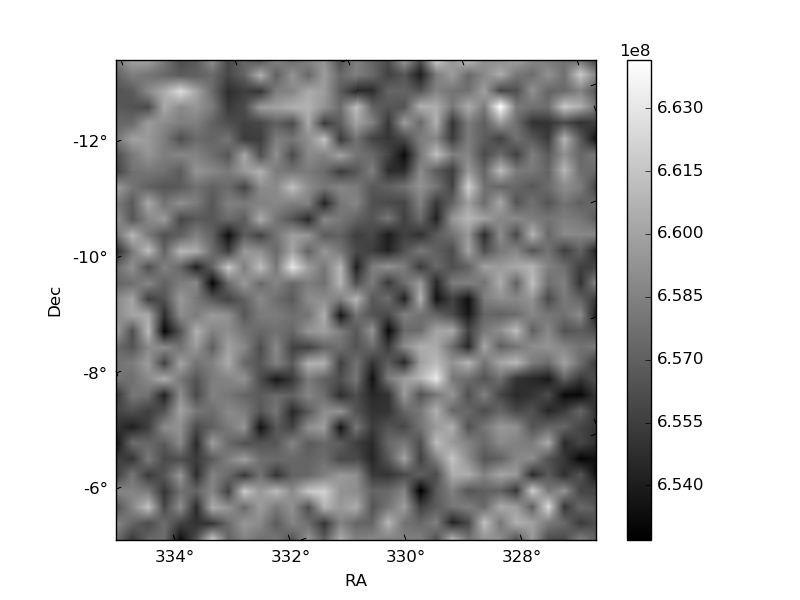
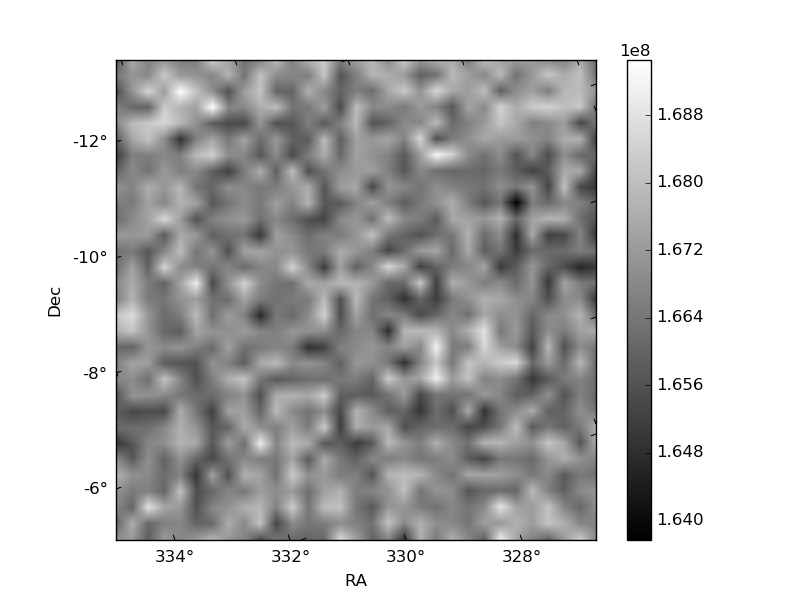
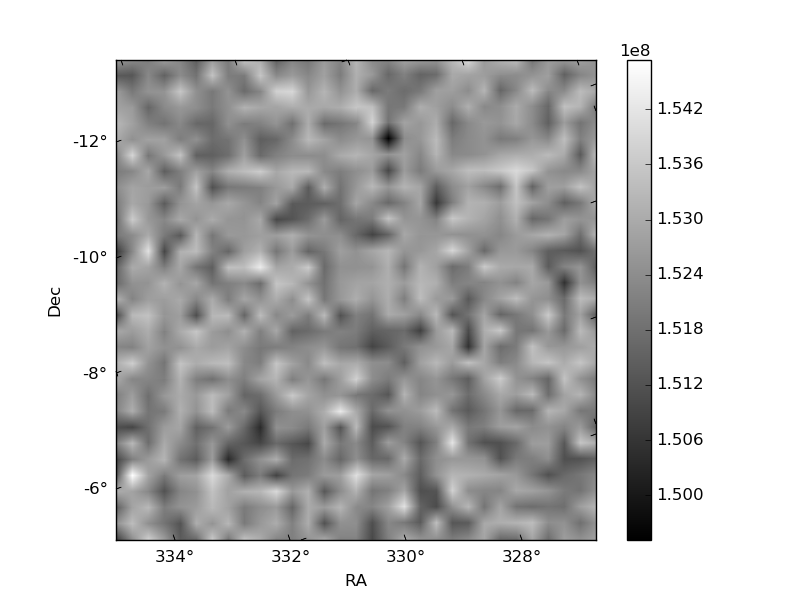
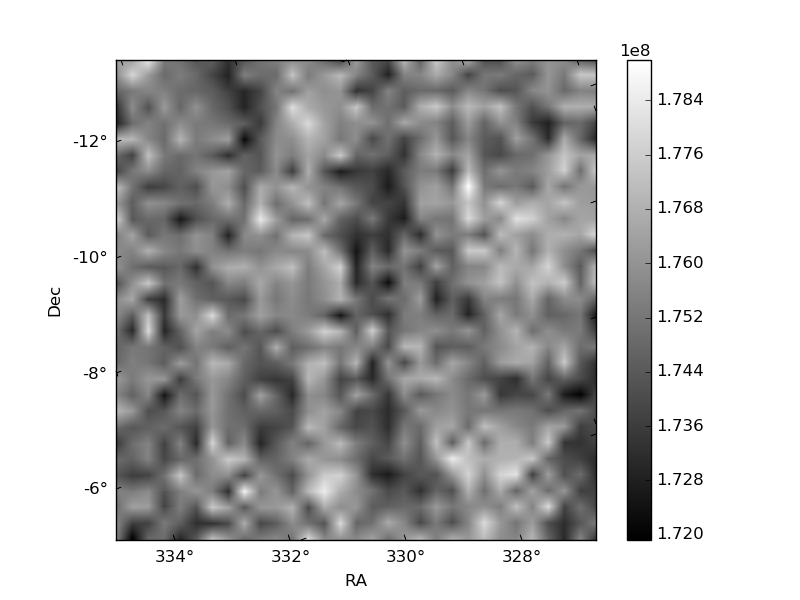
Histogram calculated using DETX and DETY for each event in the final _common_clean file
| Quadrant A | 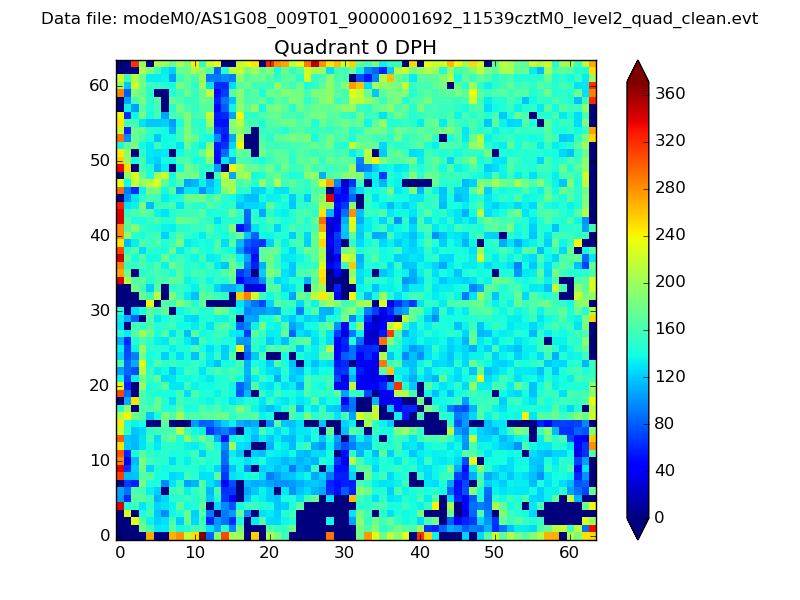 |
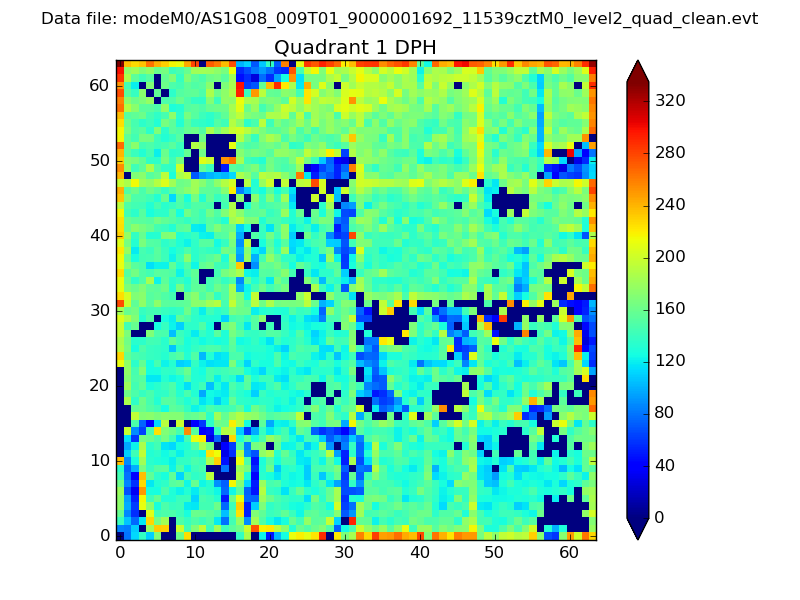 |
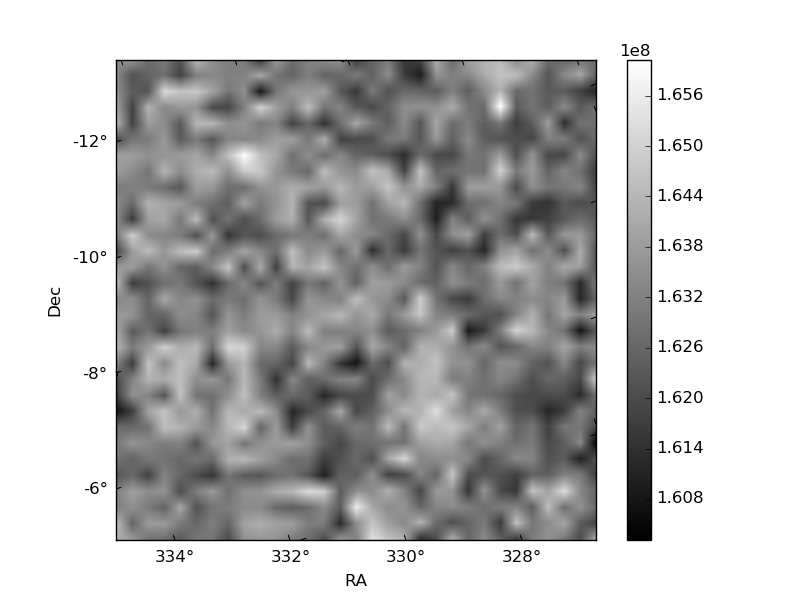
Quadrant B |
|---|---|---|---|
| Quadrant D | 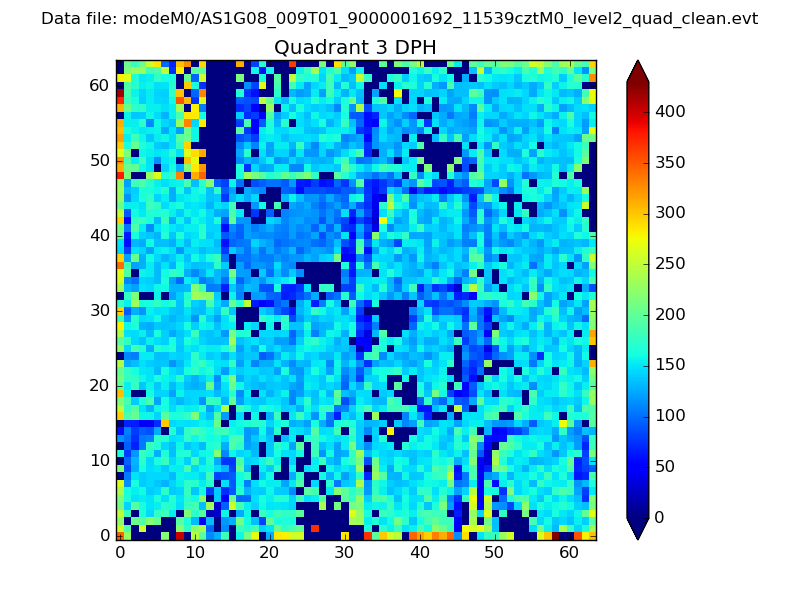 |
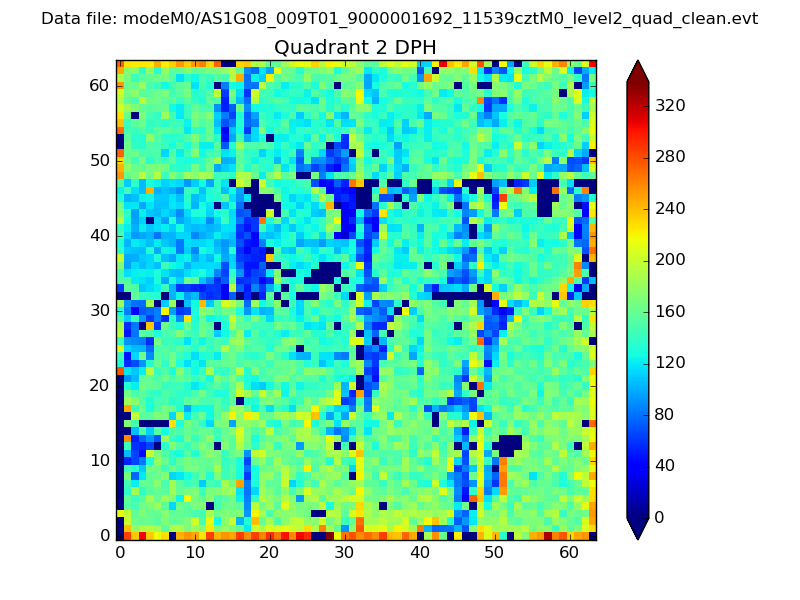 |
Quadrant C |
| Plot type | Count rate plots | Images |
|---|---|---|
| Comparison with Poisson distribution Blue bars denote a histogram of data divided into 1 sec bins. Red curve is a Poisson curve with rate = median count rate of data. |
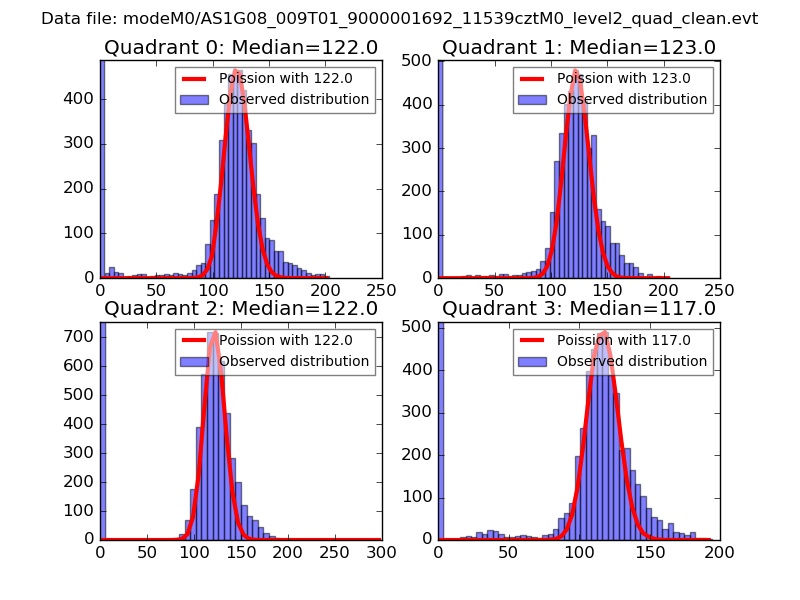 |
 |
| Quadrant-wise count rates Data is divided into 100 sec bins |
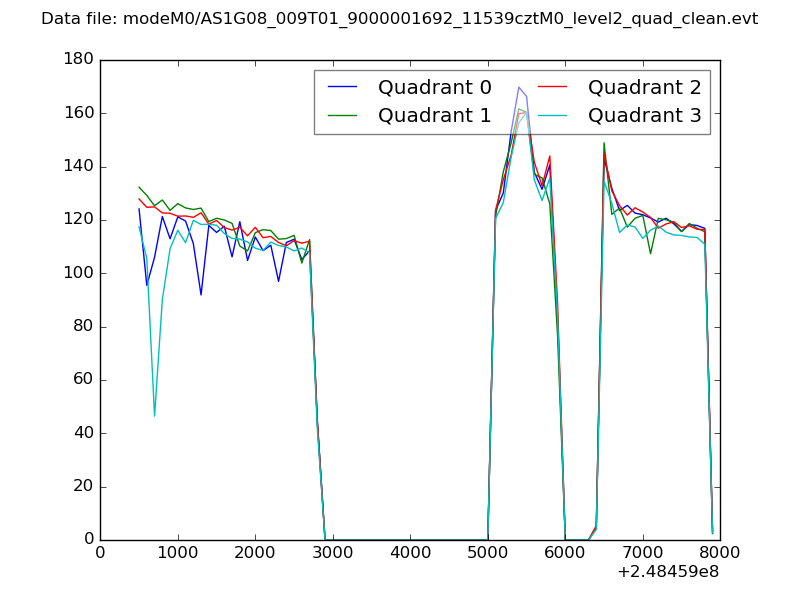 |
|
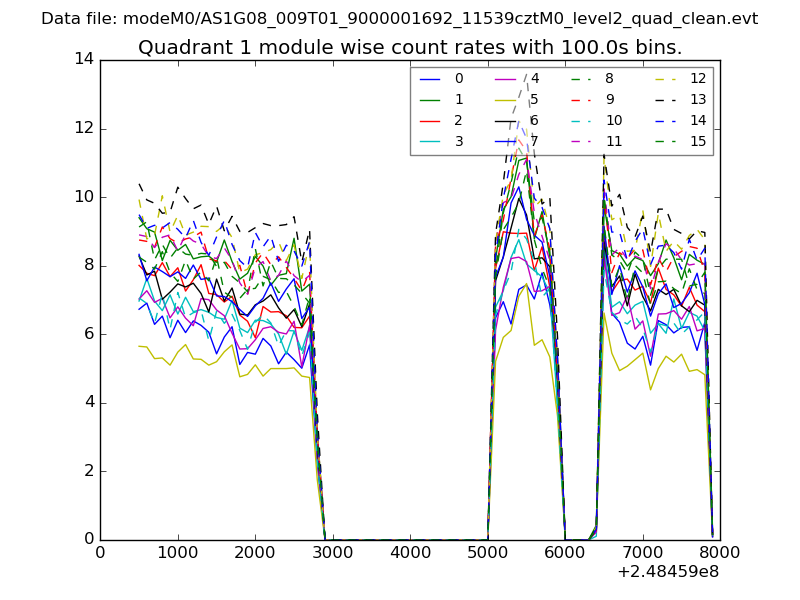
| Module-wise count rates for Quadrant A Data is divided into 100 sec bins |
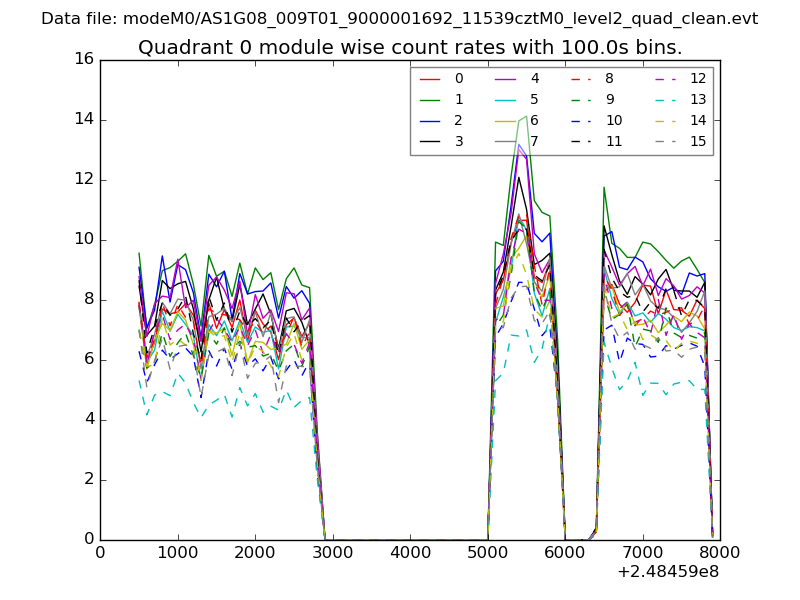 |
 |
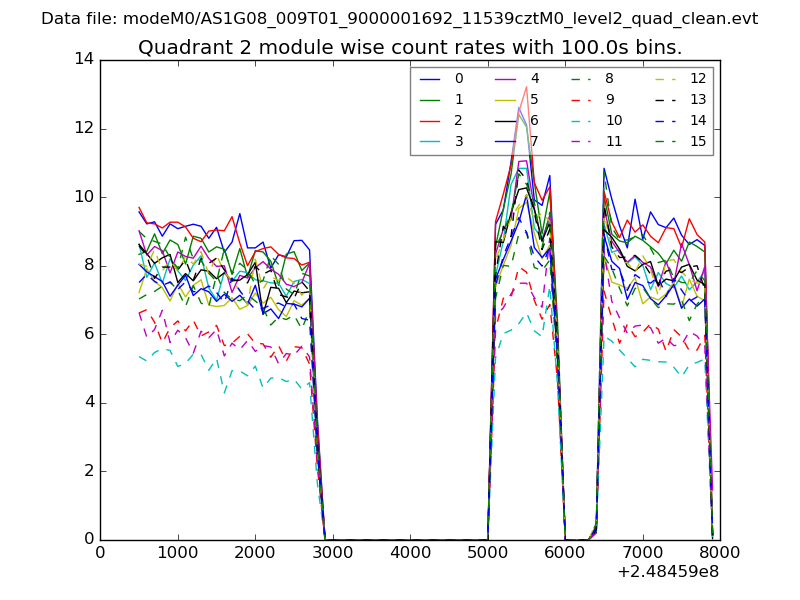
| Module-wise count rates for Quadrant B Data is divided into 100 sec bins |
 |
 |
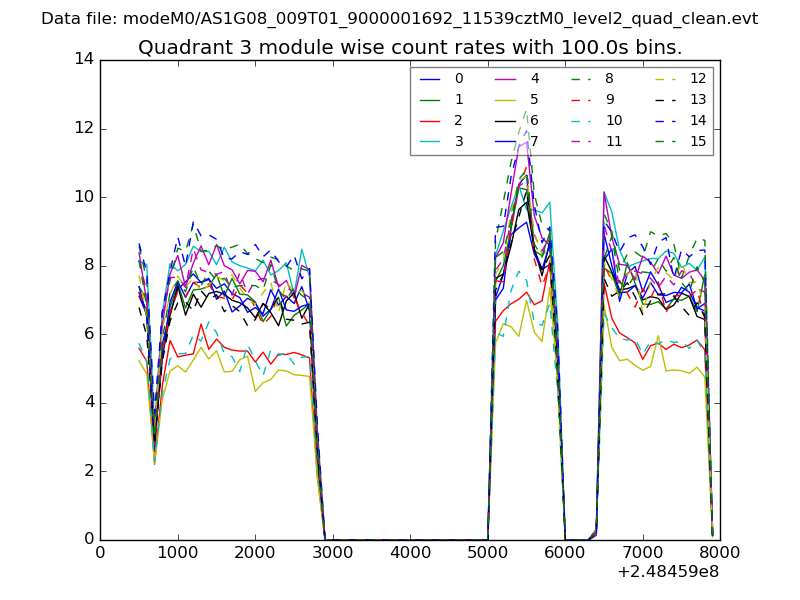
| Module-wise count rates for Quadrant C Data is divided into 100 sec bins |
 |
 |
| Module-wise count rates for Quadrant D Data is divided into 100 sec bins |
 |
 |
| Parameter | Plot |
|---|---|
| CZT HV Monitor | 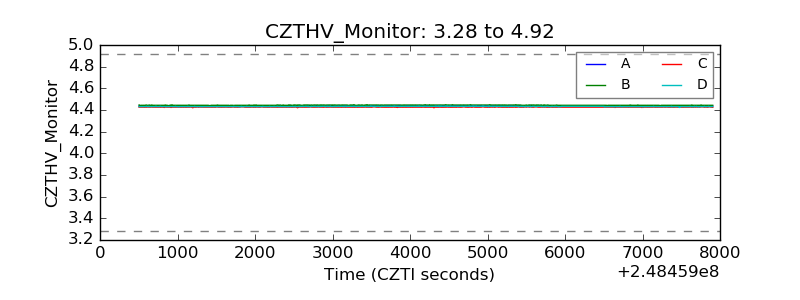 |
| D_VDD | 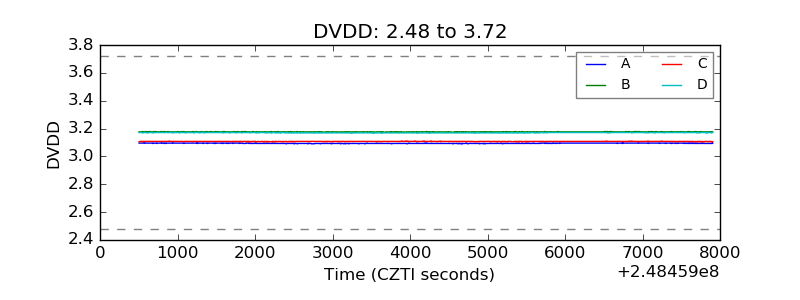 |
| Temperature 1 | 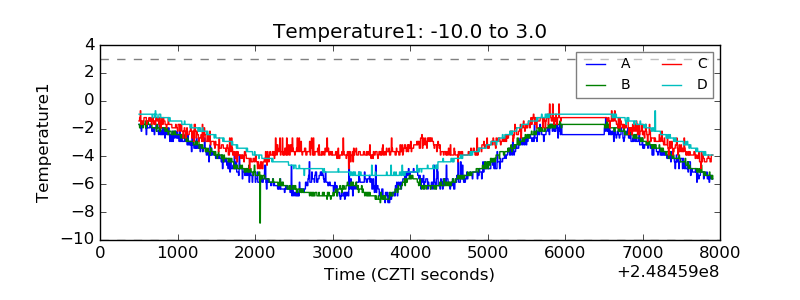 |
| Veto HV Monitor | 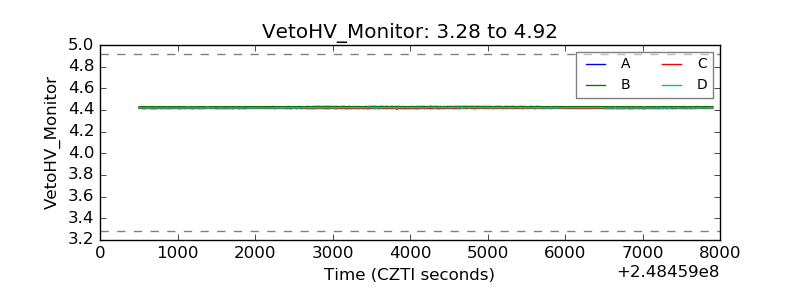 |
| Veto LLD |  |
| Alpha Counter | 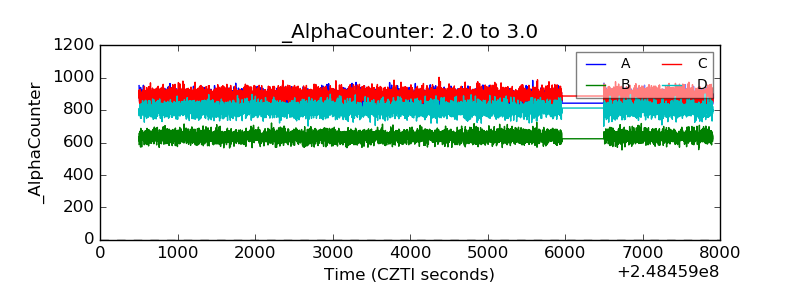 |
| _CPM_Rate | 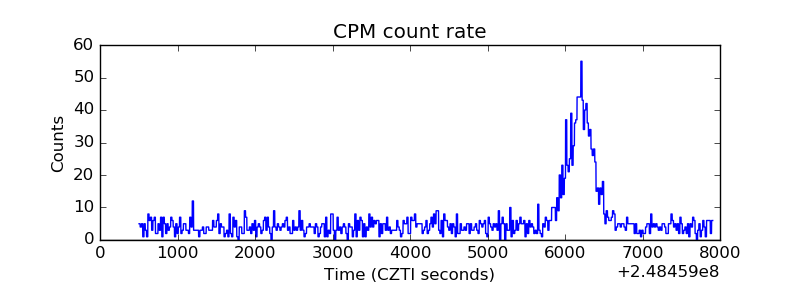 |
| CZT Counter | 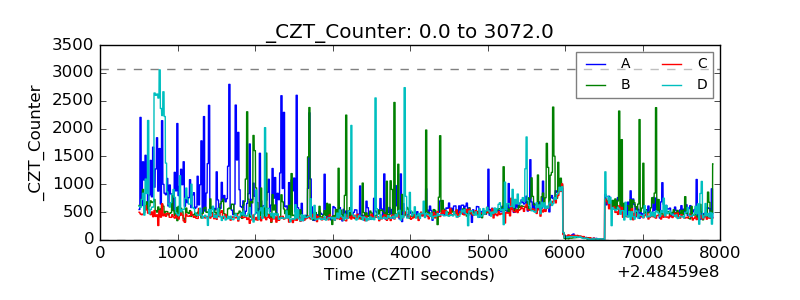 |
| +2.5 Volts monitor |  |
| +5 Volts monitor |  |
| _ROLL_ROT | 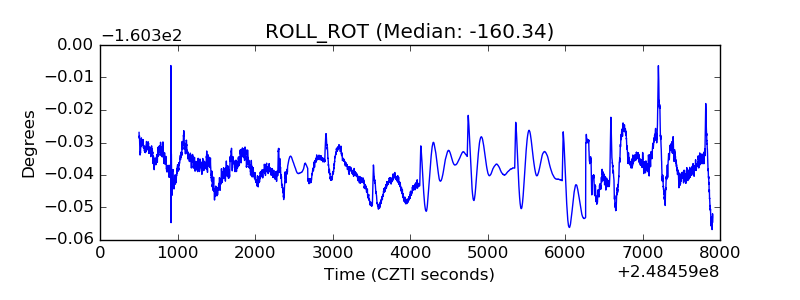 |
| _Roll_DEC | 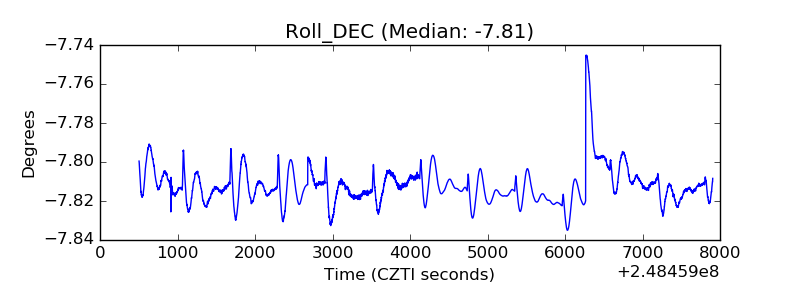 |
| _Roll_RA | 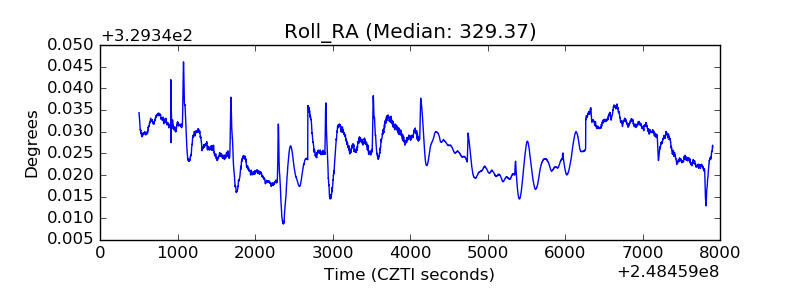 |
| Veto Counter | 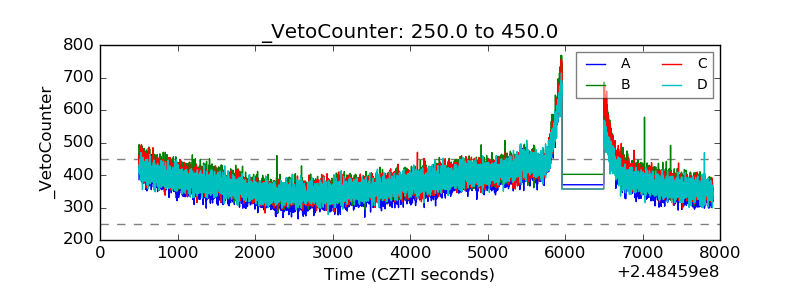 |